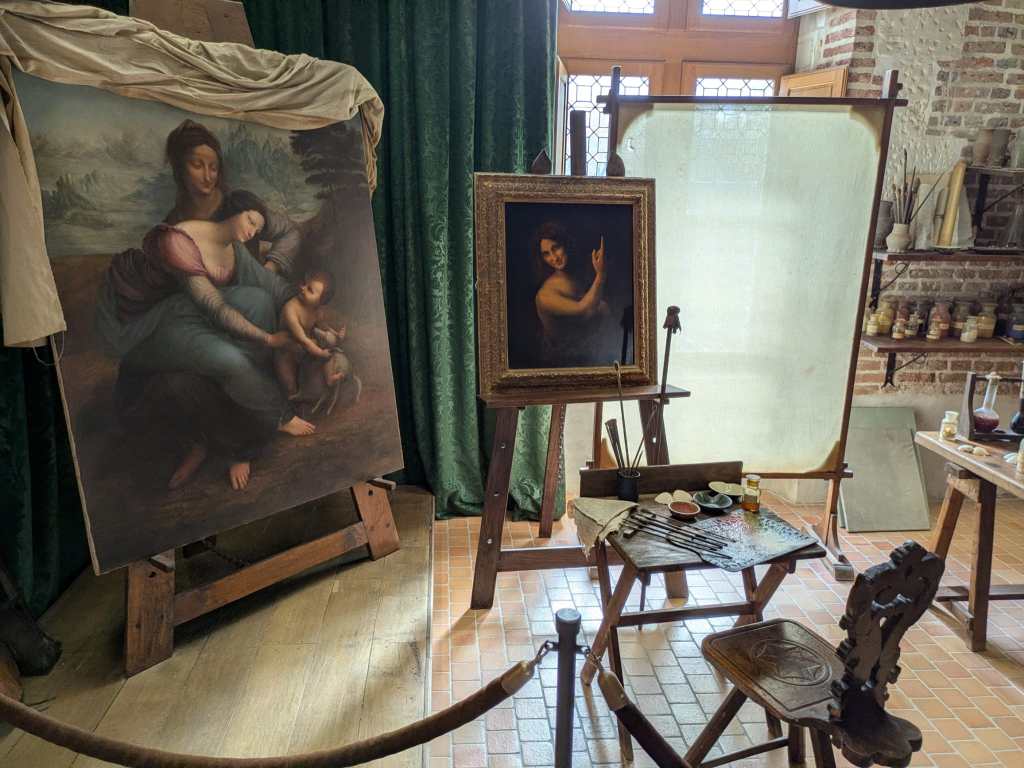
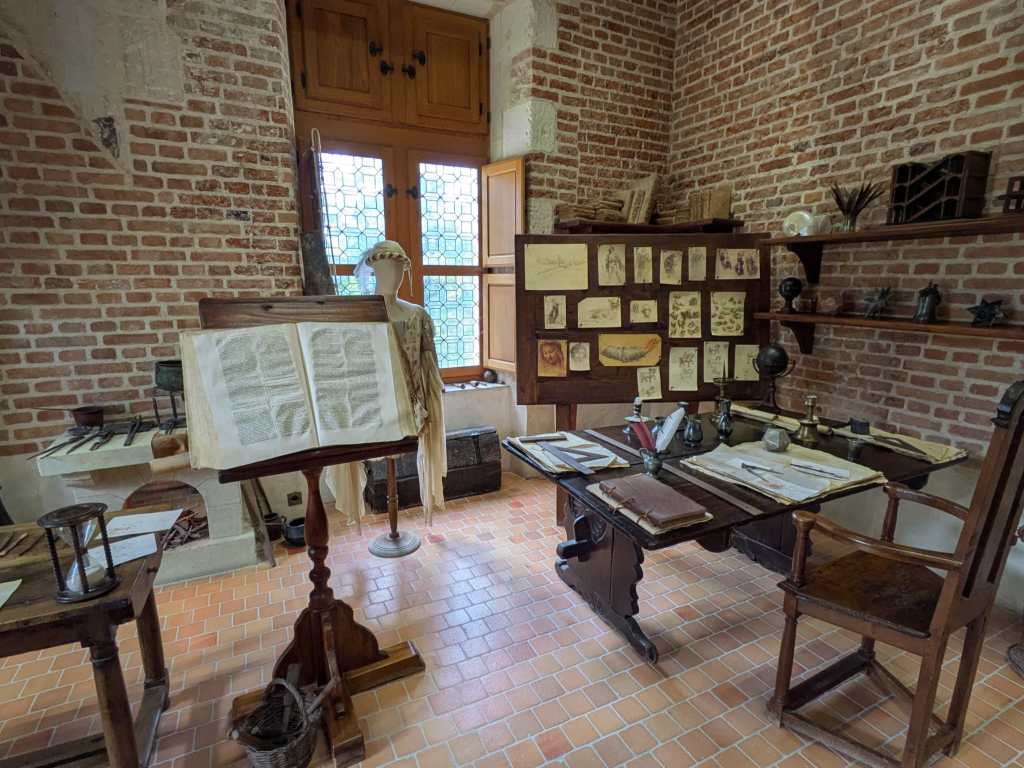
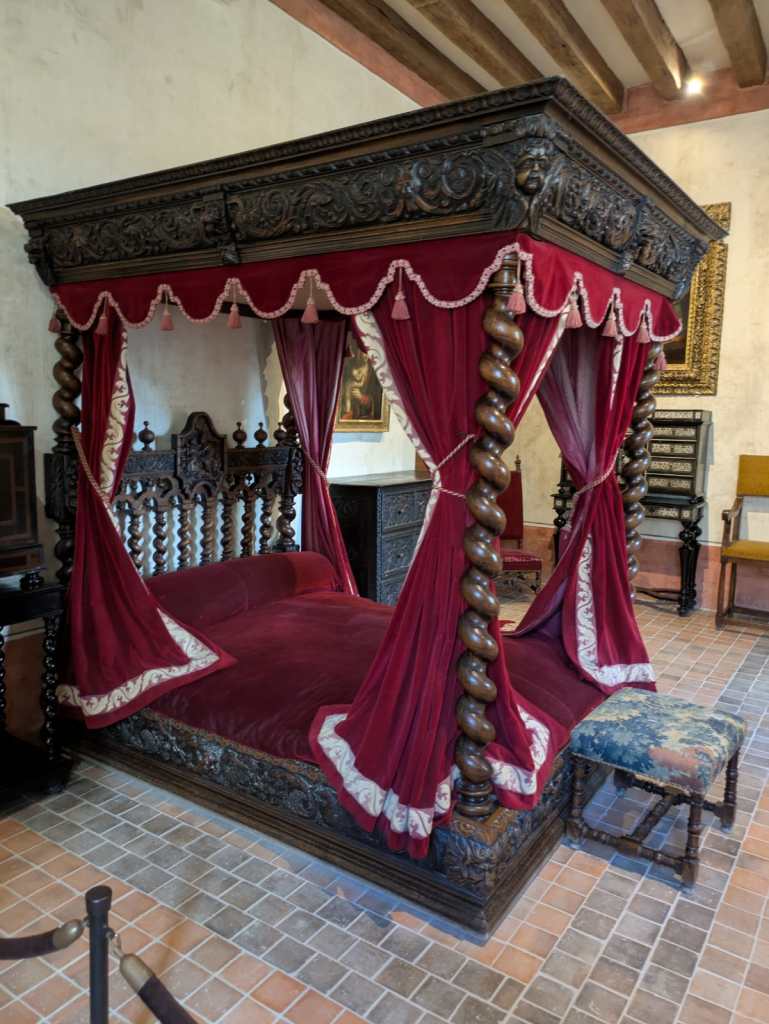
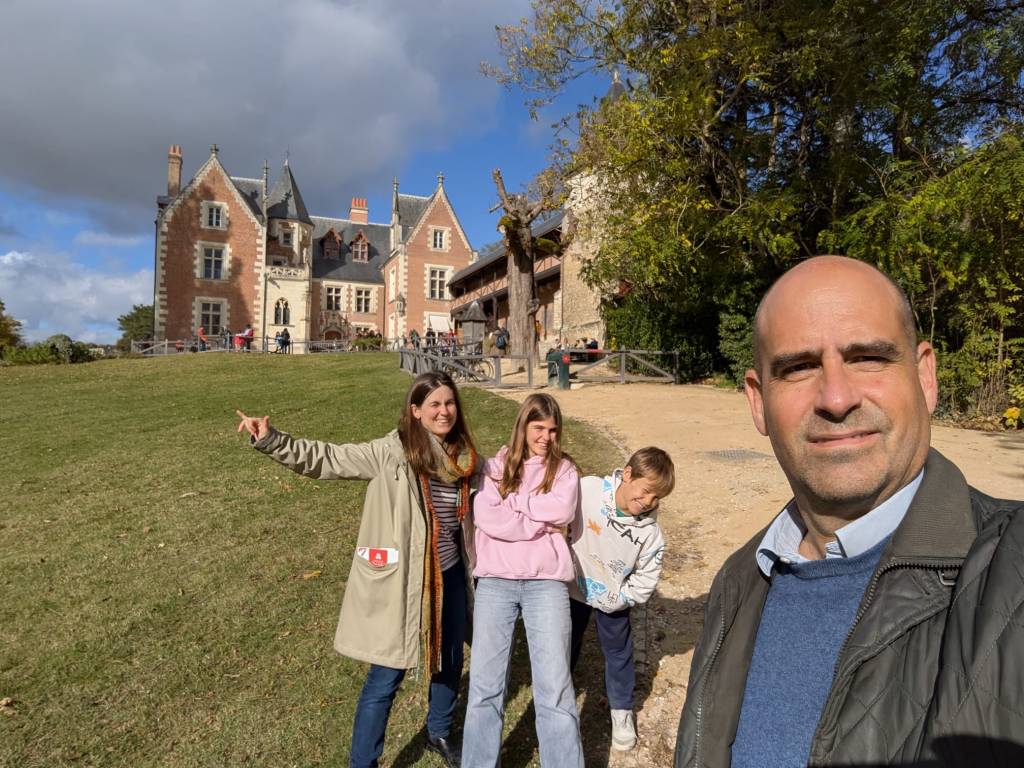
This is a post about the Château du Clos Lucé in Amboise, the place where Leonardo da Vinci spent his last three years (1516-1519) and where he died, a guest of King Francis I, who had appointed him “premier peintre, ingénieur et architecte du roi” (“first painter, engineer and architect to the king”).
I first visited it with the family in December 2018, during a Christmas road trip to The Netherlands with a stop over in the Loire. We returned in late October 2025, seven years later.
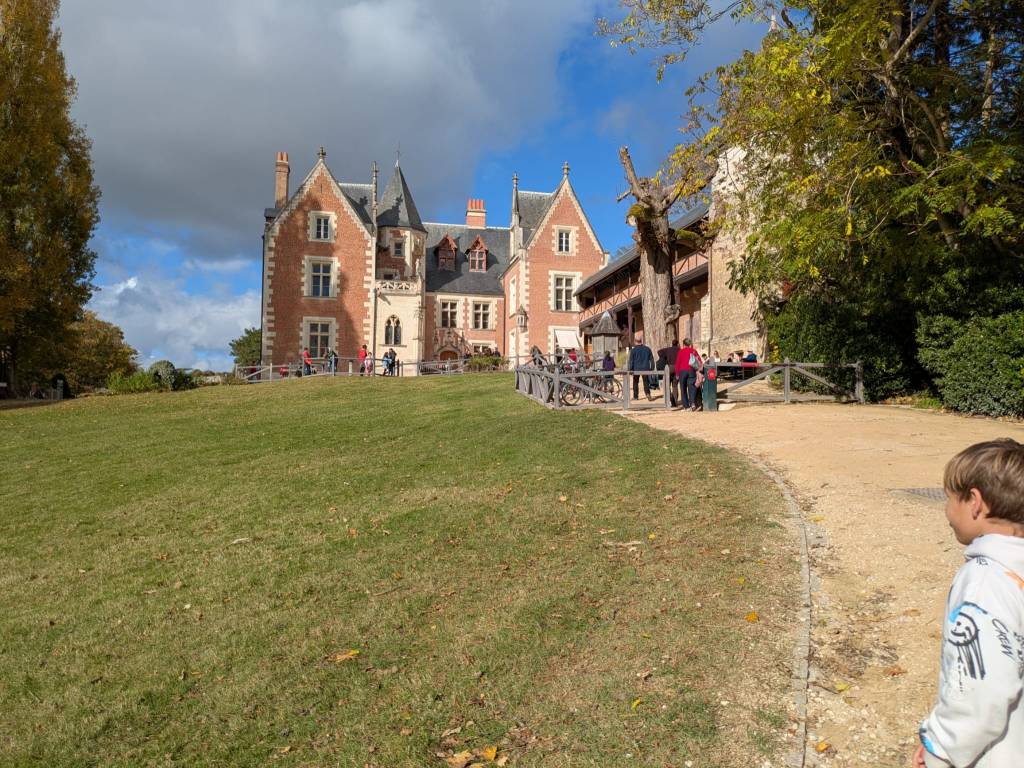
The château, built of pink brick and tuffeau stone.
The estate was given by Louis XI to Étienne le Loup in 1471, who built the manor then known as Château du Cloux. In 1490 it was bought by Charles VIII and became a summer house of the kings of France; Louise of Savoy, regent of France, raised her children there, among them the future Francis I. In 1516, after the death of his patron Giuliano de’ Medici, Leonardo accepted the king’s invitation and travelled to France with a few pupils and three of his paintings, including the Mona Lisa.
The château stands about 400 metres from the royal Château d’Amboise, and the visit shows the entrance to an underground passage that connected the two. Legend has it that Francis I used it to visit Leonardo.
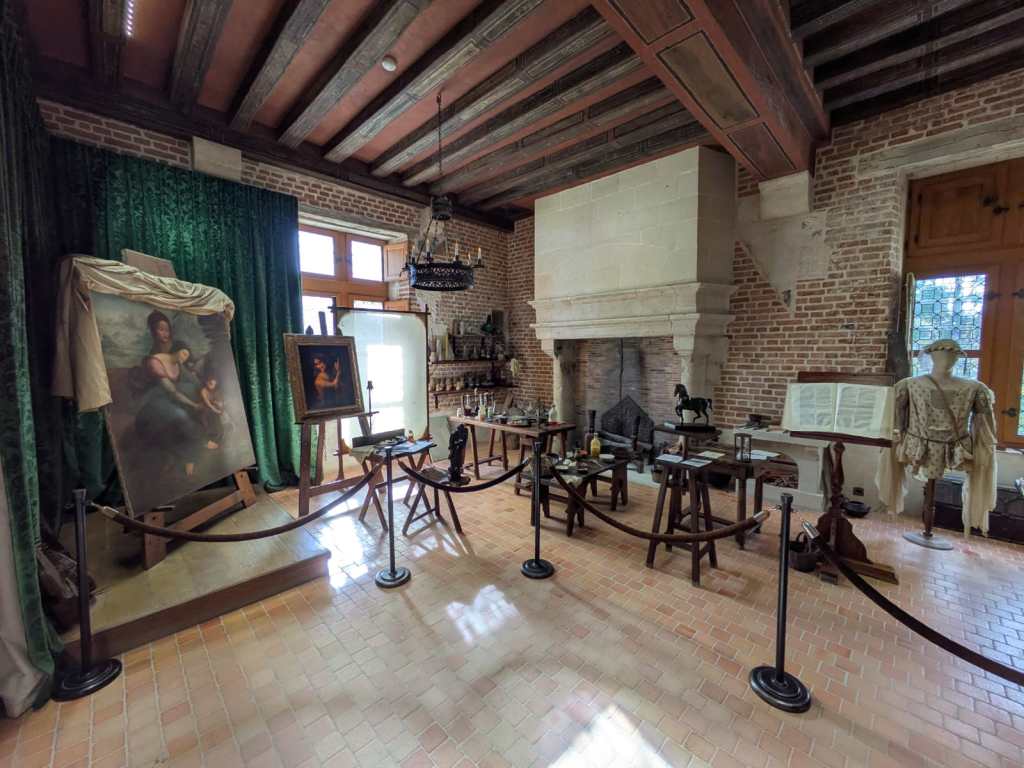
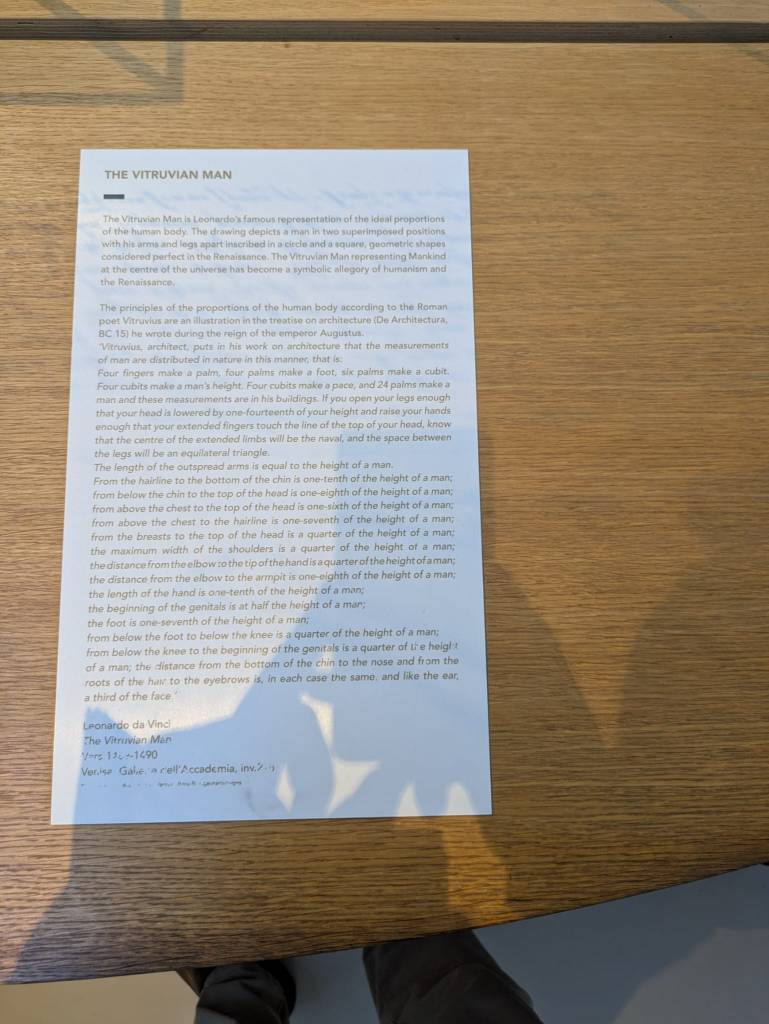
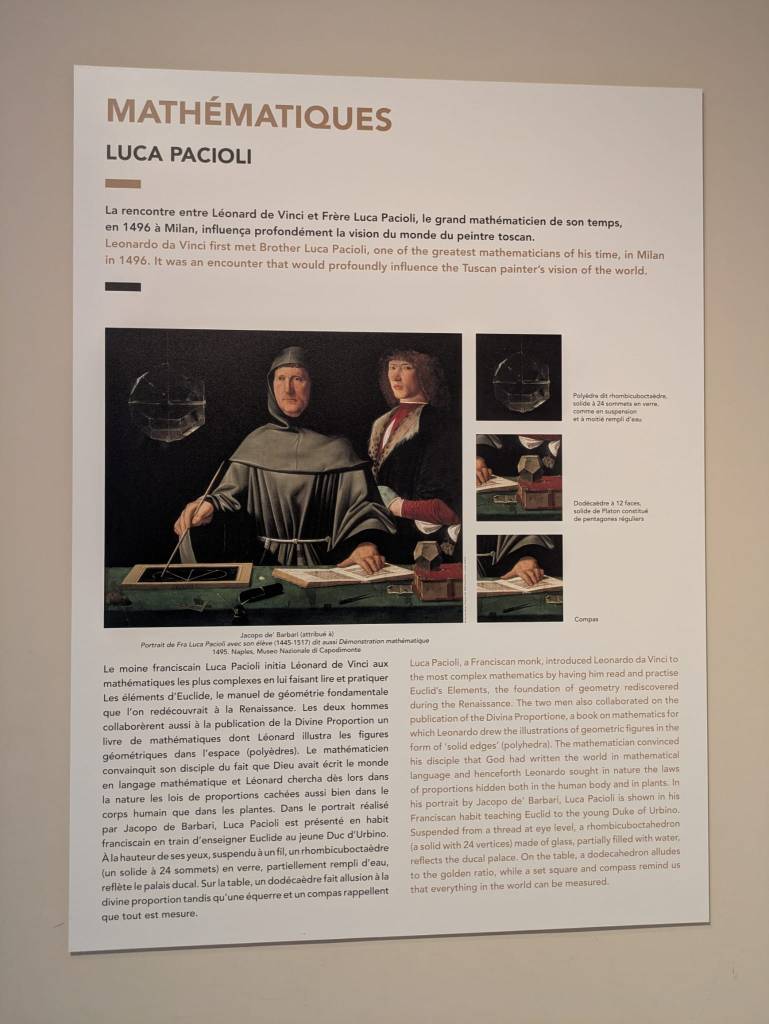
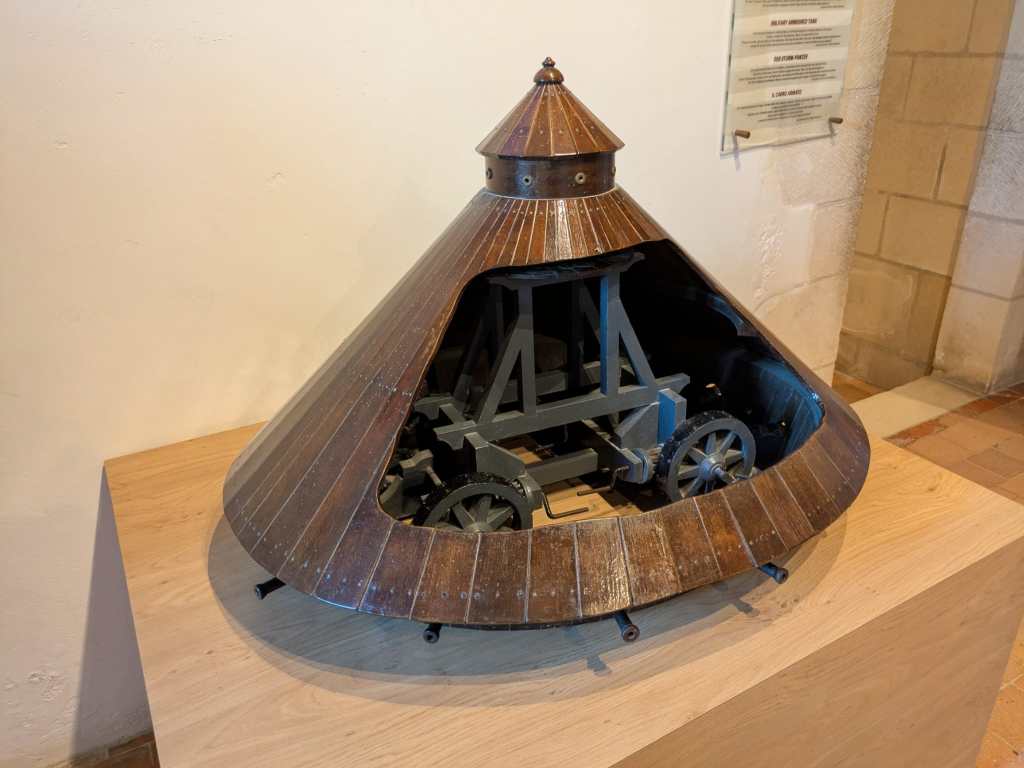
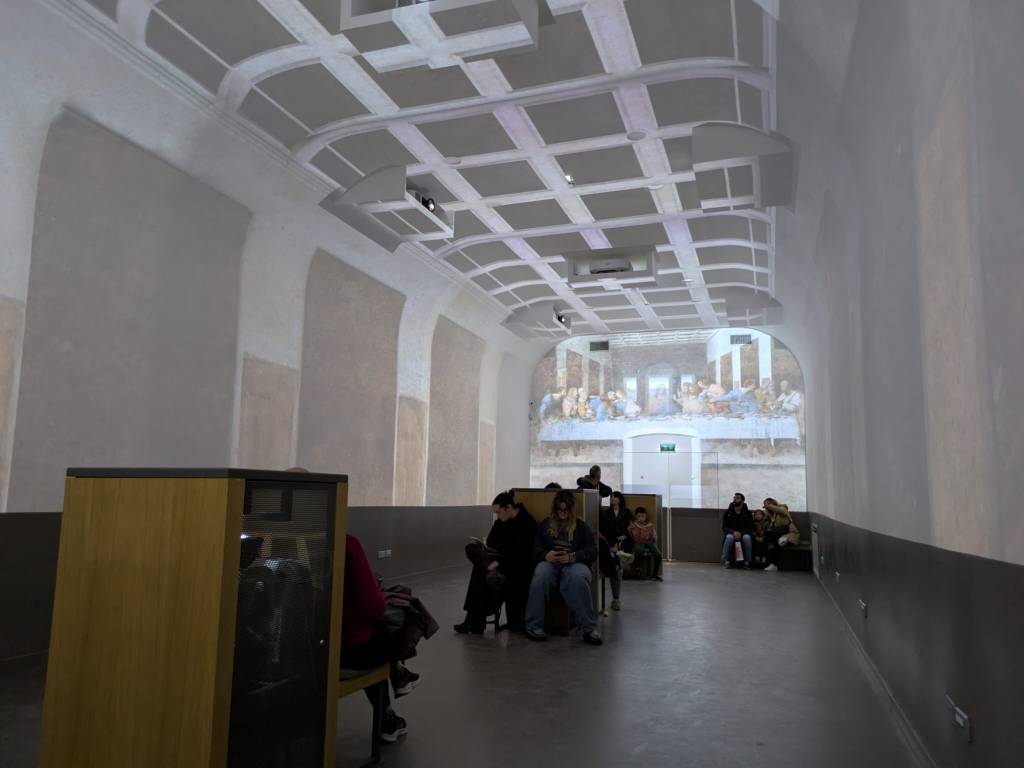
Today Clos Lucé is a museum dedicated to Leonardo. The bedchamber, the studio (bottega) and the study are evocations decorated with period furniture, as no description of his rooms has survived. The museum holds a collection of 40 models built from his drawings, didactic panels (the Vitruvian Man, his encounter with the mathematician Luca Pacioli…), immersive projections of his works, and a hologram recreating the visit of Cardinal Louis of Aragon: thanks to the account of the cardinal’s secretary, Antonio de Beatis, we know that the Mona Lisa, the Virgin and Child with Saint Anne and the Saint John the Baptist, all three now at the Louvre, were kept here at the time.
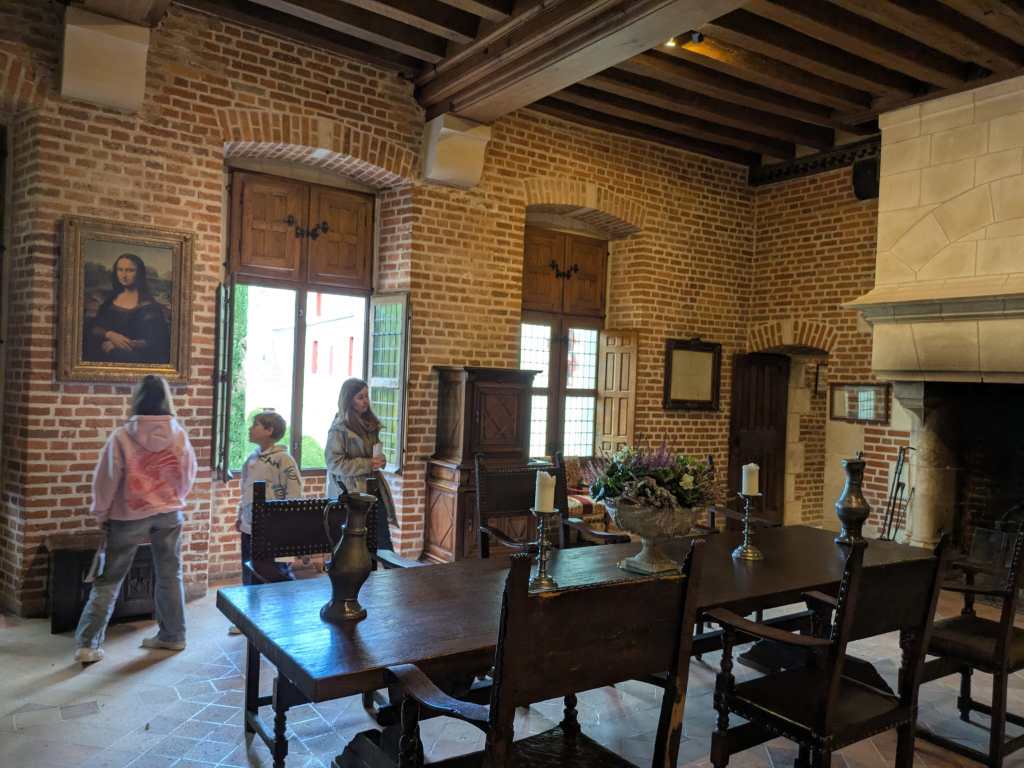
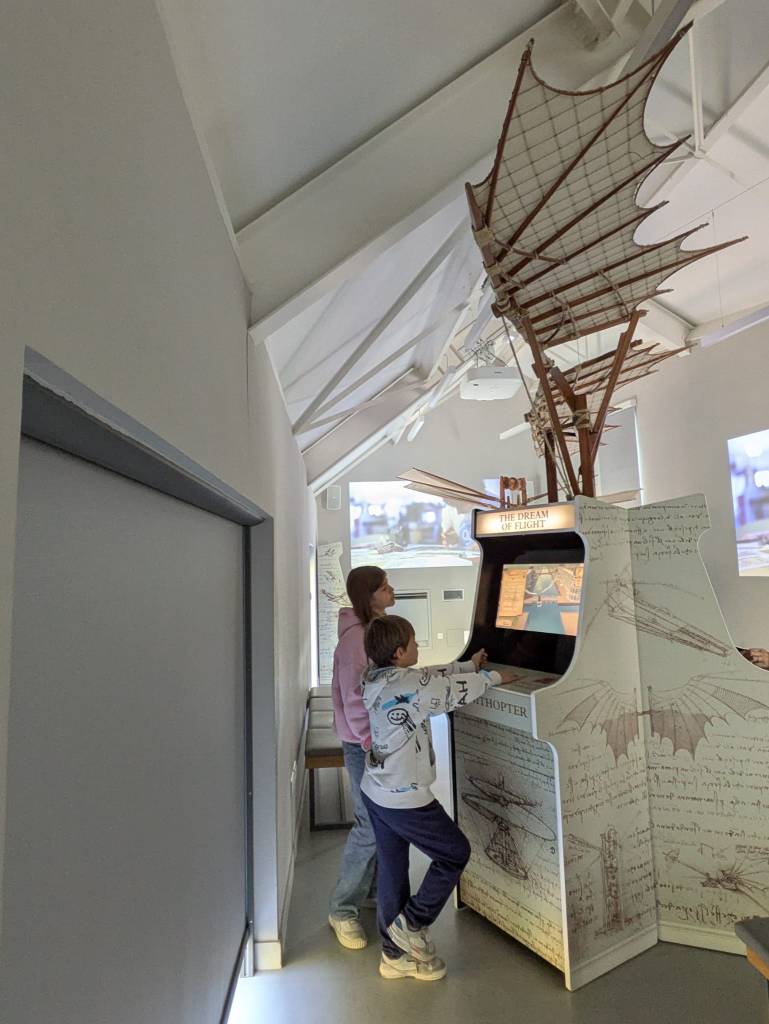
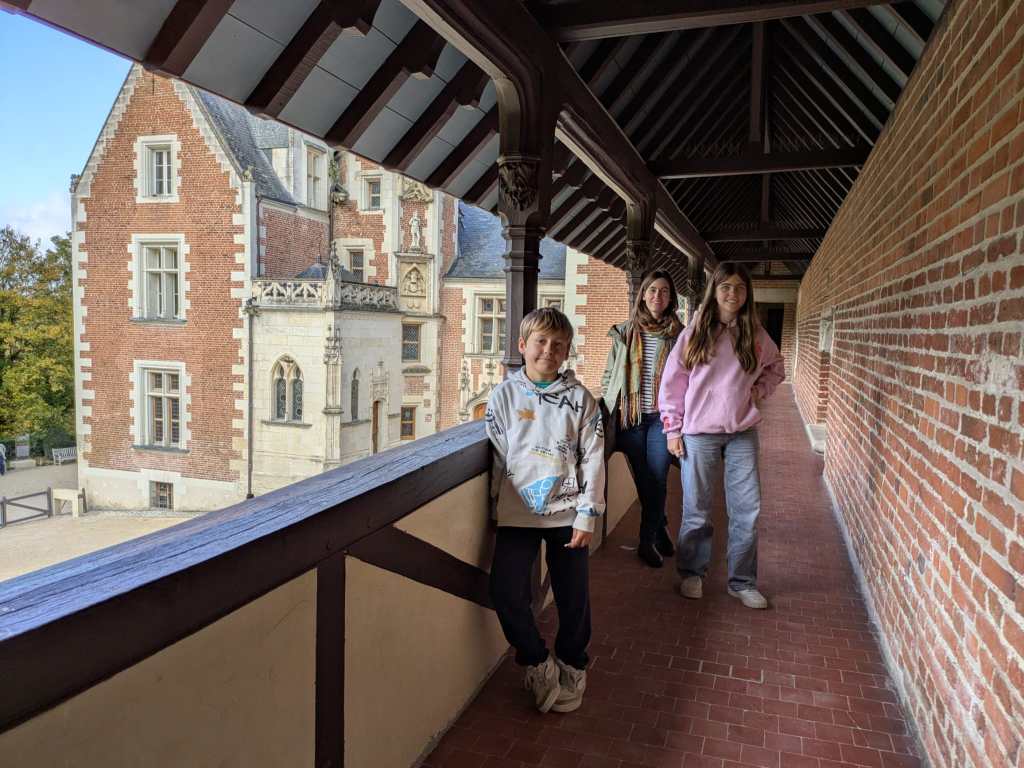
The great hall, furnished in period style; on the wall, a copy of the Mona Lisa.The studio or bottega, with copies of the Saint Anne and the Saint John the Baptist on the easels.Brushes and pigments in the studio.The study.The bedchamber and the bed where Leonardo passed away.Panel on the Vitruvian Man.Panel on Luca Pacioli, who introduced Leonardo to mathematics in Milan in 1496.Model of the armoured vehicle.“The dream of flight”: the kids try out an ornithopter.The immersive projection room.The Last Supper, projected in the immersive room.The covered gallery.
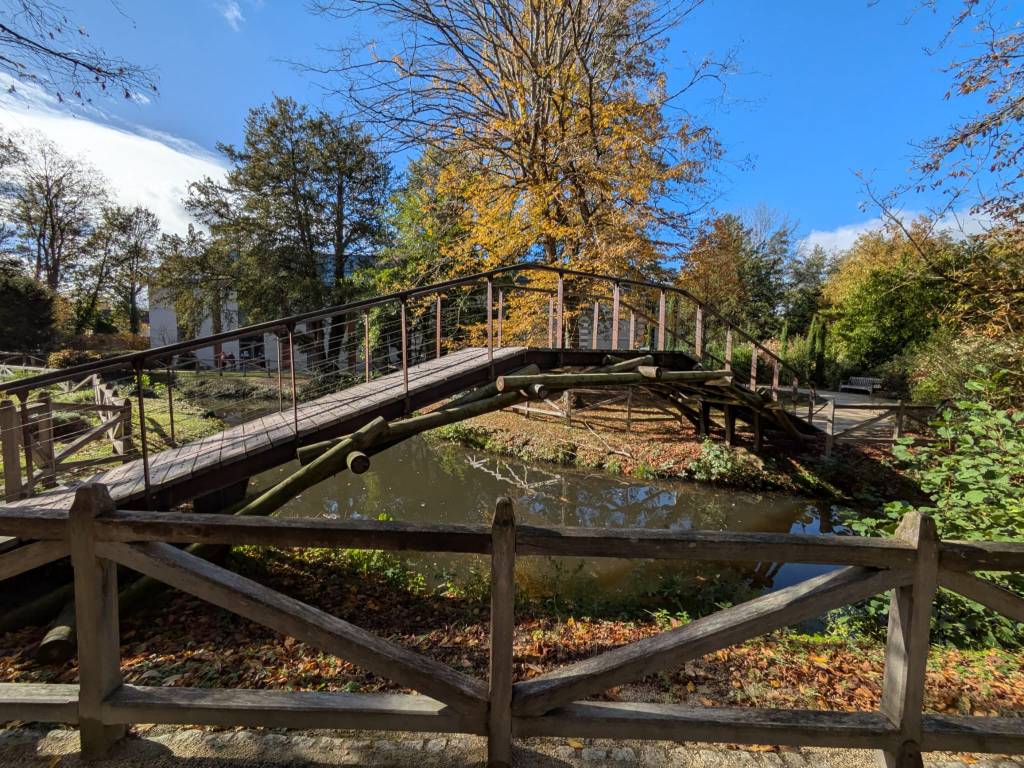
In the park, crossed by the Amasse stream, more models and life-size constructions bring his engineering drawings to life: the self-supporting bridge, the armoured vehicle, flying machines…
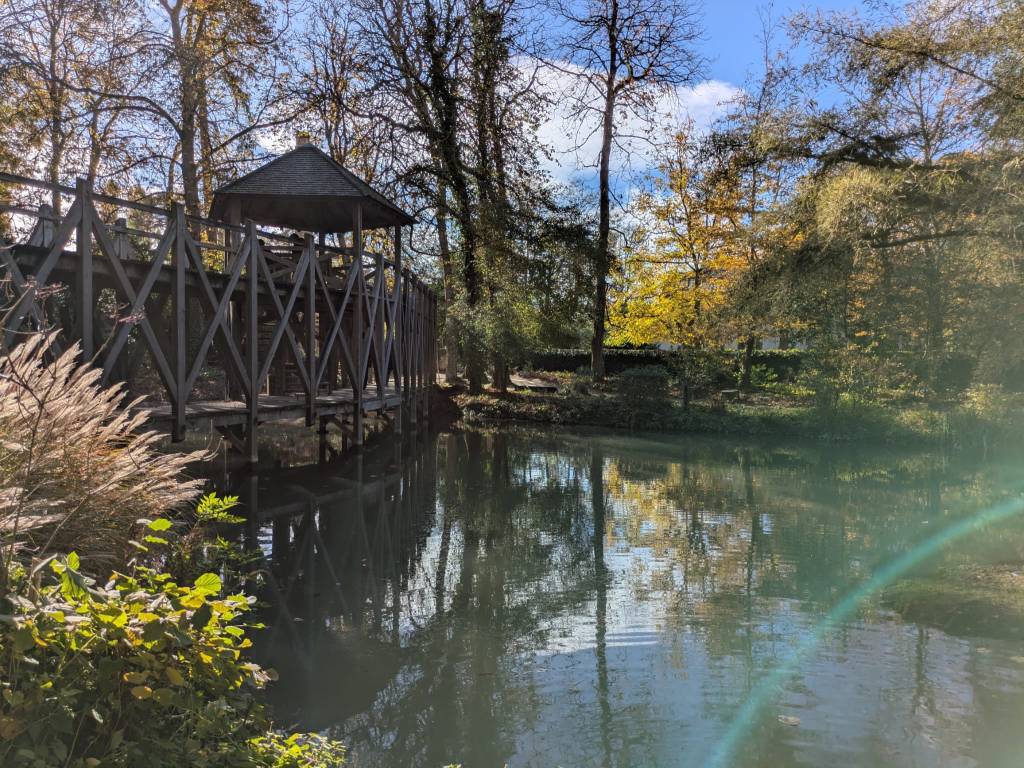
A bridge over the Amasse, in the park.The pond in the park.
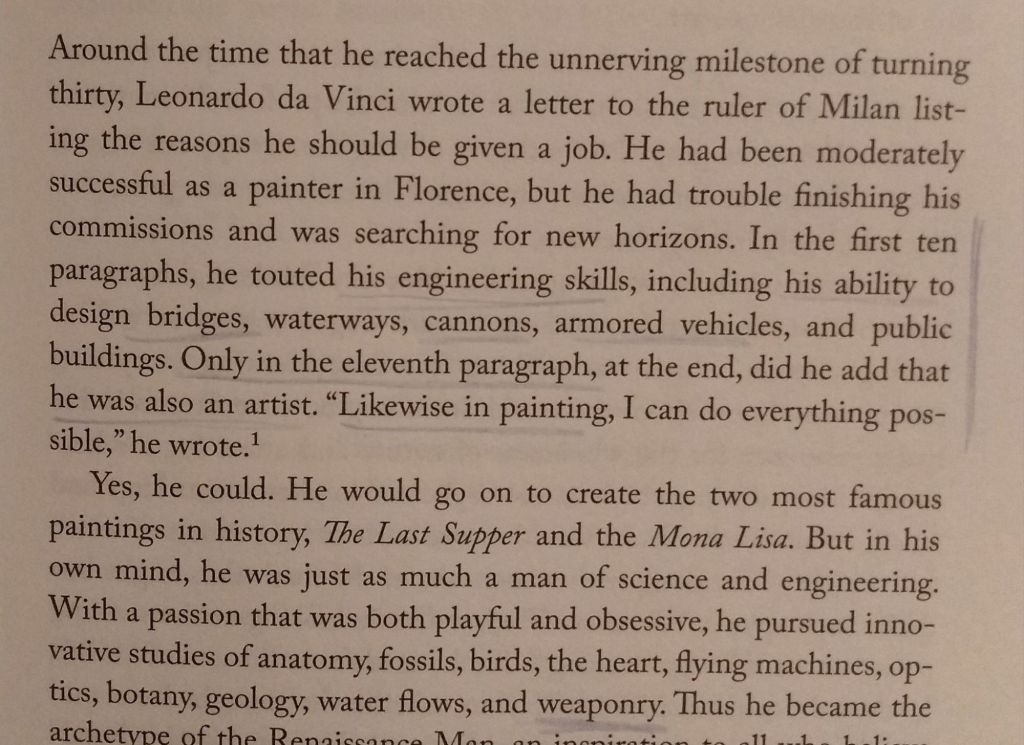
After the 2018 visit we wondered about the balance between the artistic and the military engineering sides of Francis I’s patronage. As Luca put it neatly: Leonardo was invited to be the DARPA of sixteenth-century France. Reading Walter Isaacson‘s “Leonardo da Vinci” biography, which I started soon after, confirmed the impression from the very first pages: when Leonardo pitched himself to Ludovico Sforza in Milan decades earlier, his letter deals almost entirely with military engineering, and painting is mentioned almost as an afterthought. The biography is worth reading on its own (I reviewed it in my 2019 reading list), and it helps understanding the origin of the designs and objects at Clos Lucé.
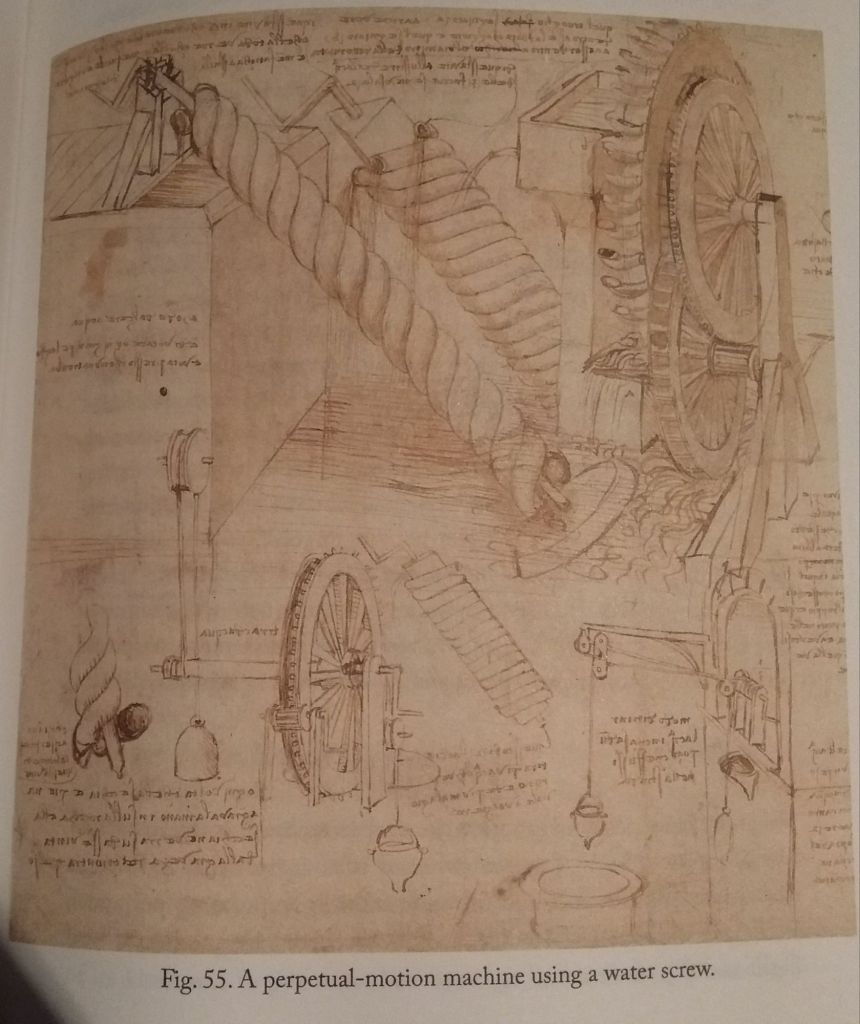
Extract from Walter Isaacson biography of Leonardo.
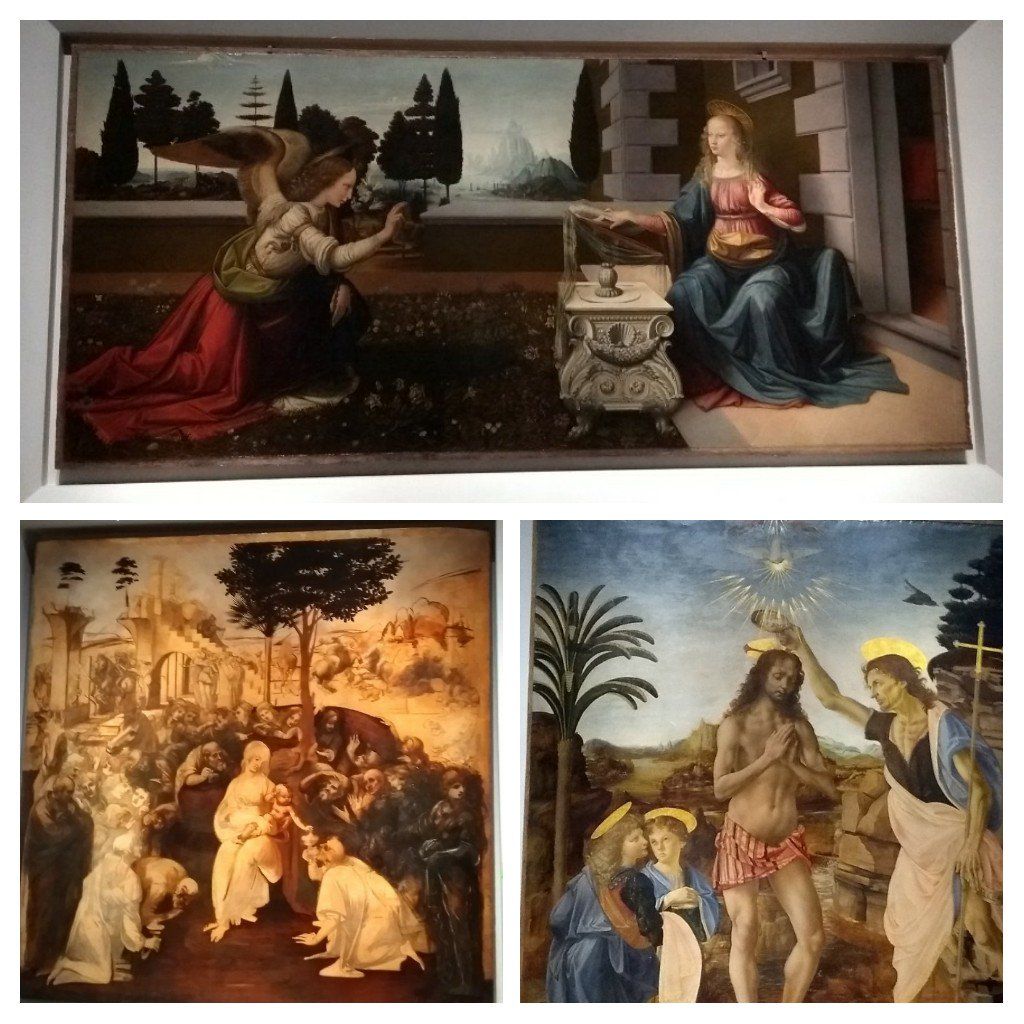
Back in 2019, to celebrate the 500th anniversary of the death of Leonardo we made a couple of other visits following his trail during a summer trip to Tuscany: we stopped at Vinci and Anchiano, where he was born, and visited the Museo Leonardiano; and at the Uffizi gallery in Florence we saw some of his original works.
Some of Leonardo’s master pieces at the Uffizi gallery: The Annunciation, The Adoration of the Magi, The Baptism of Christ.
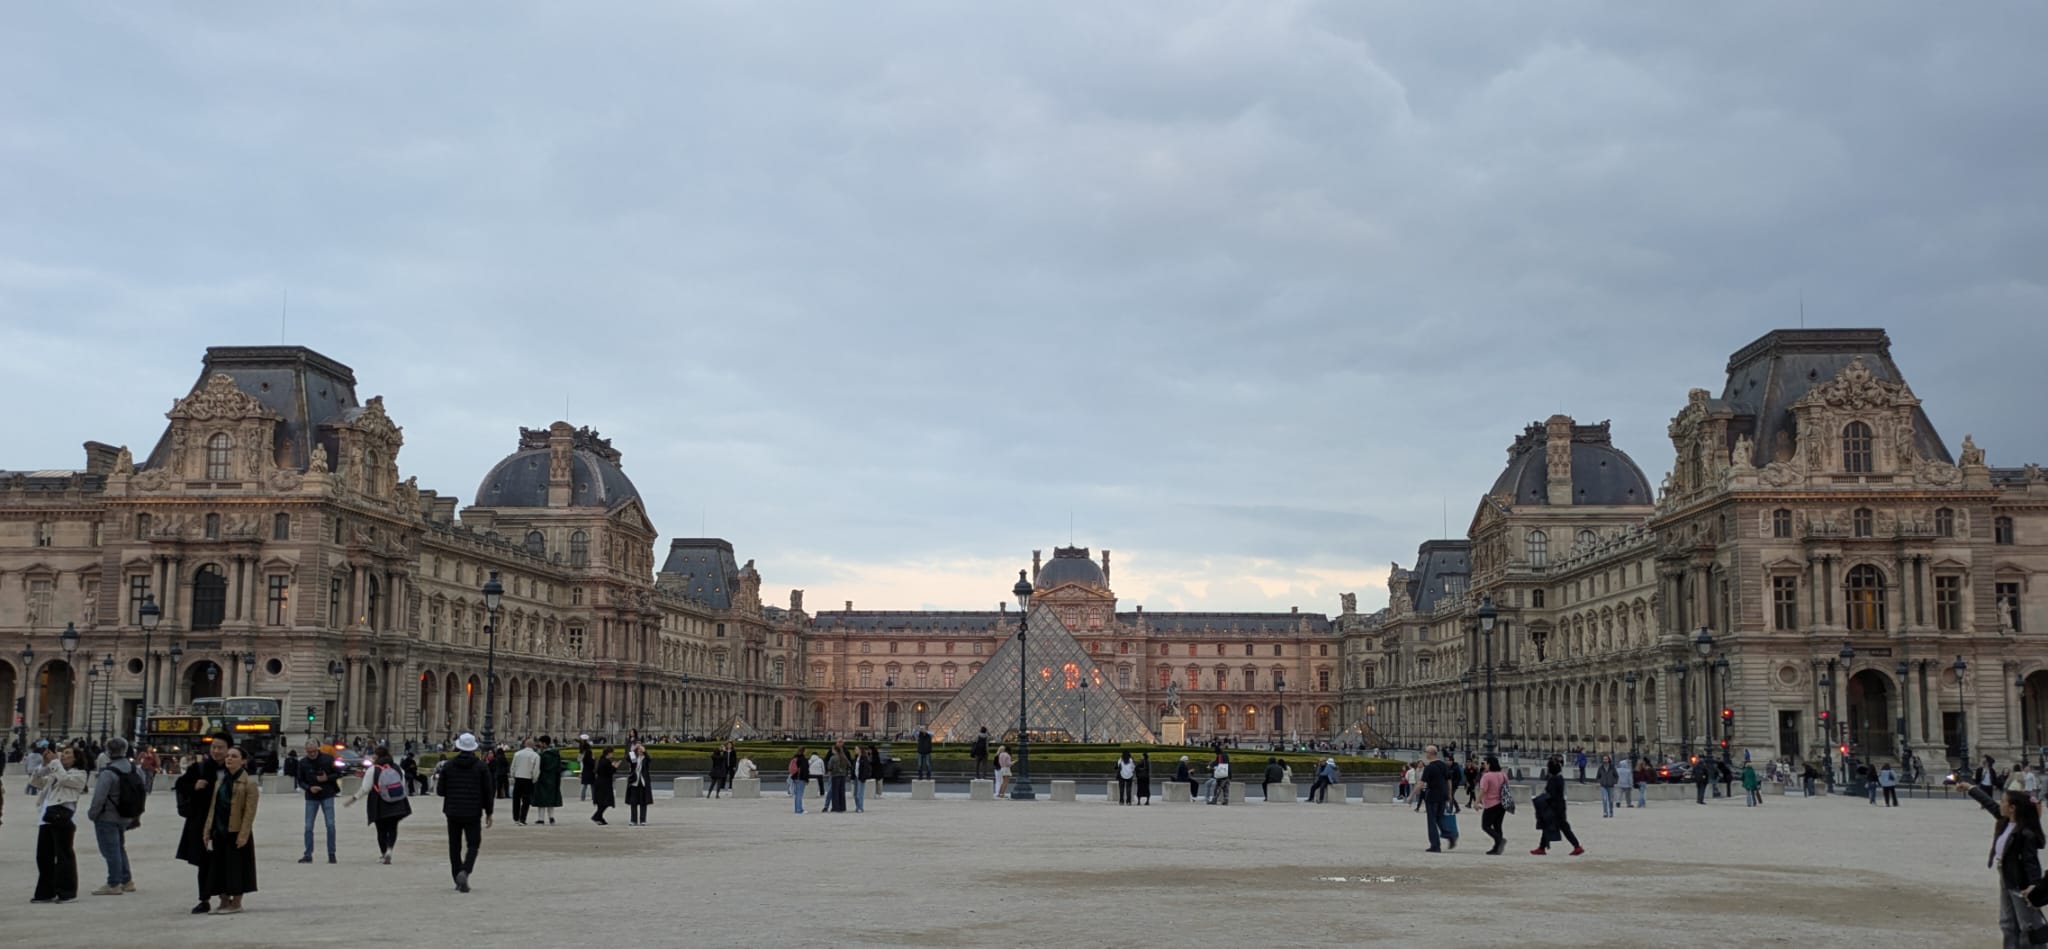
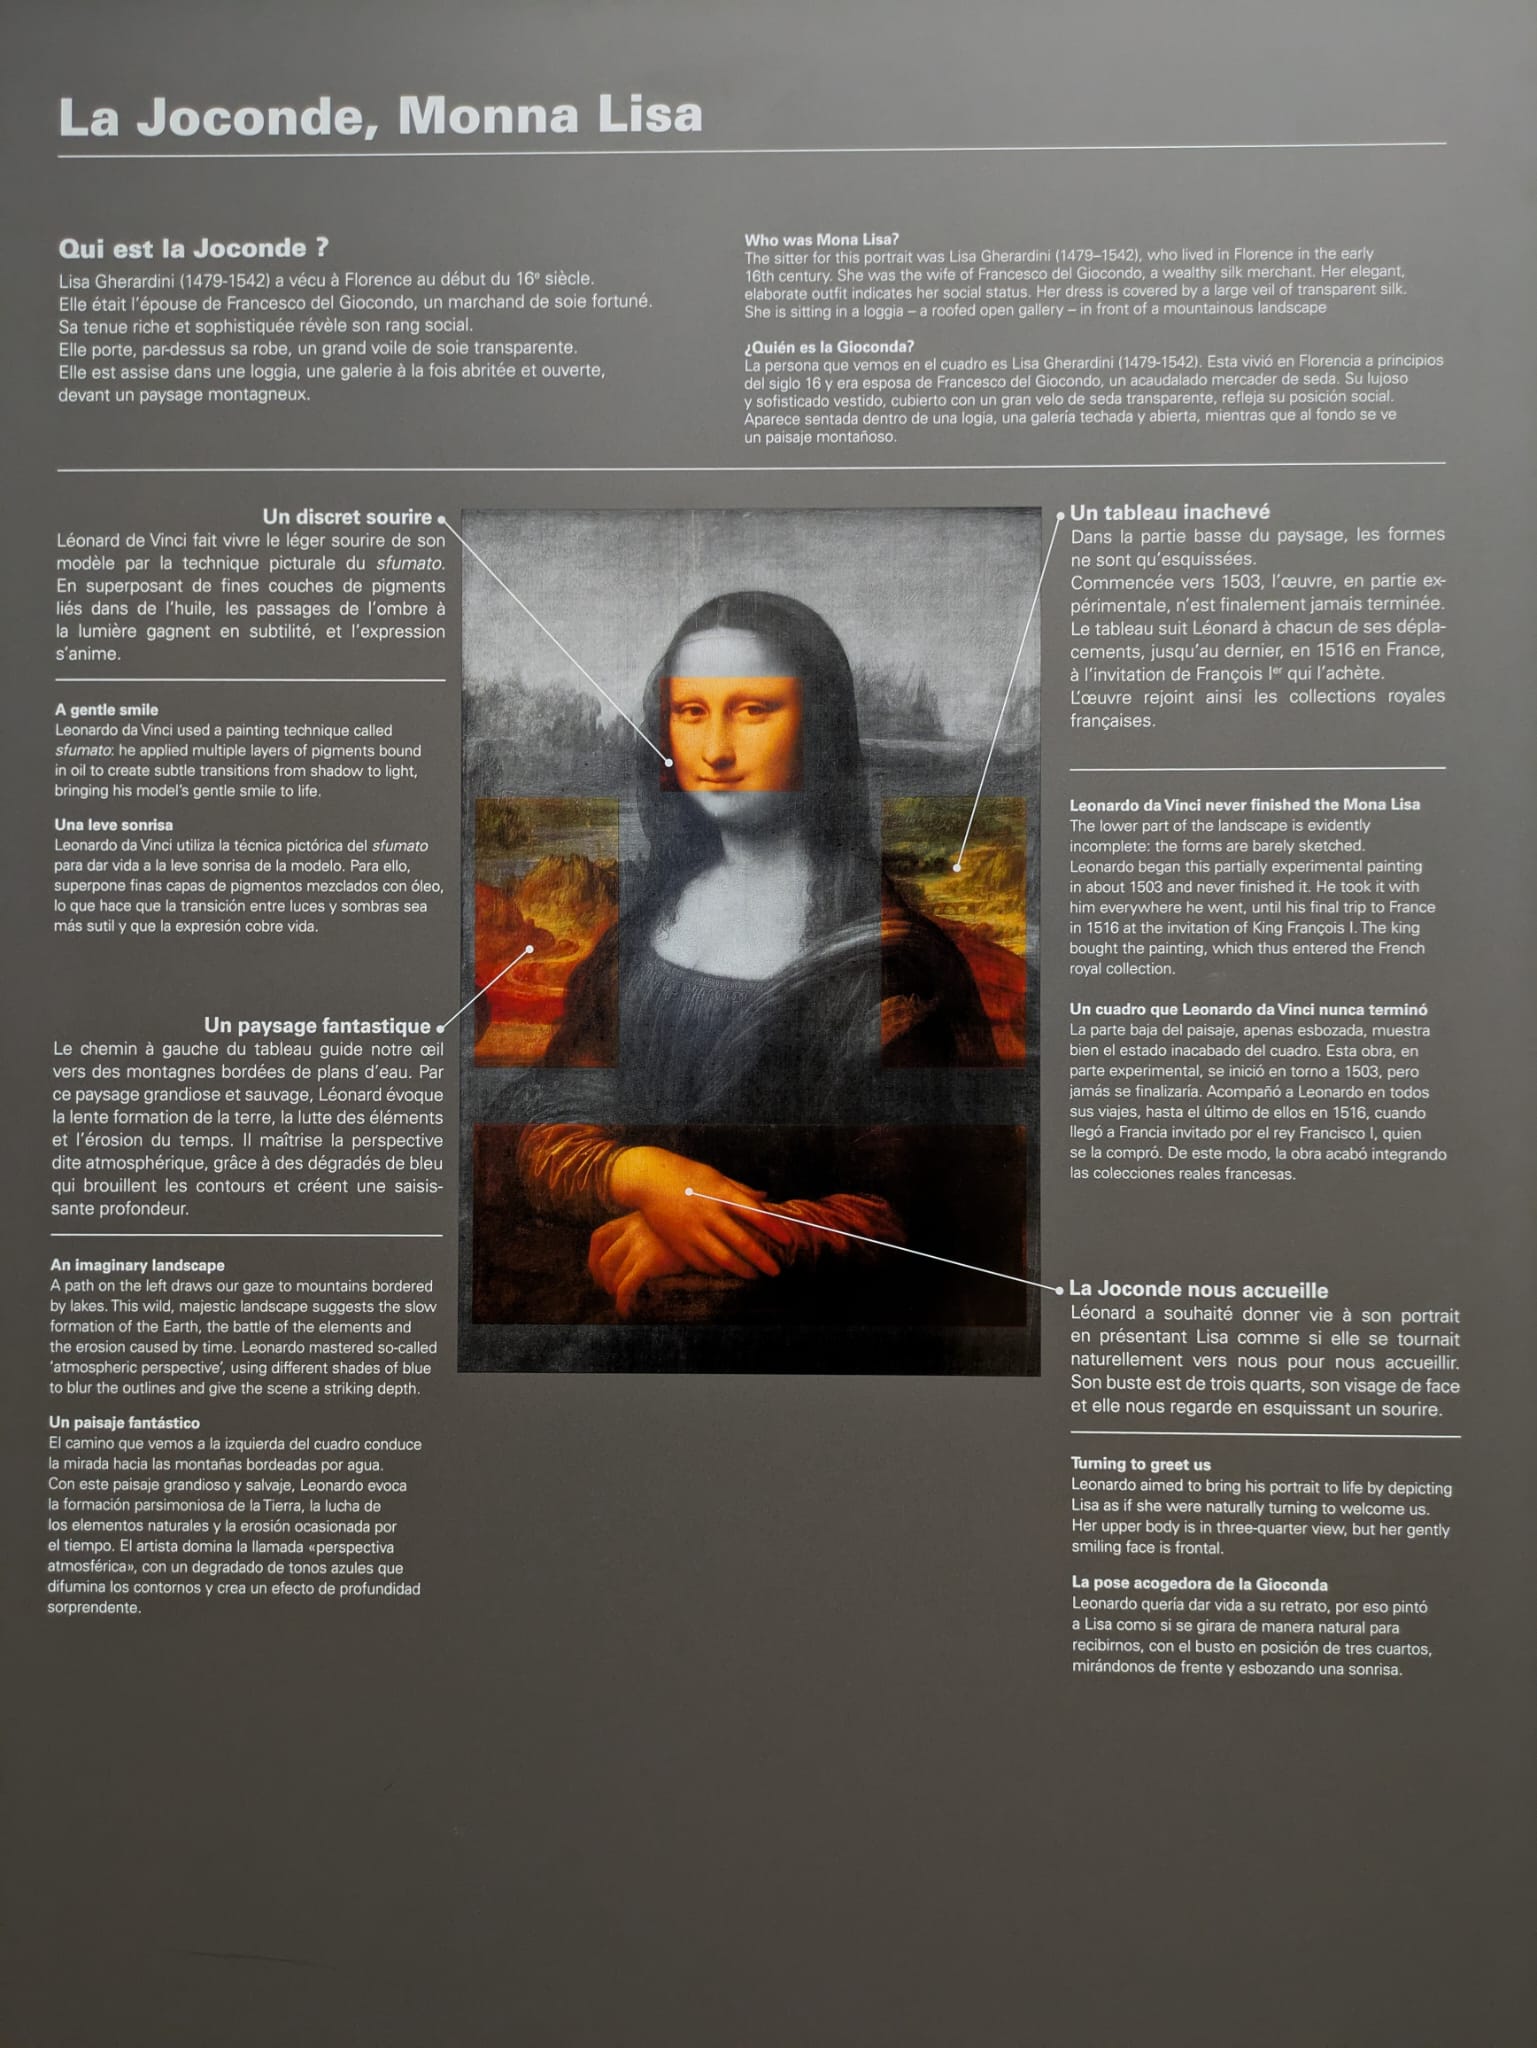
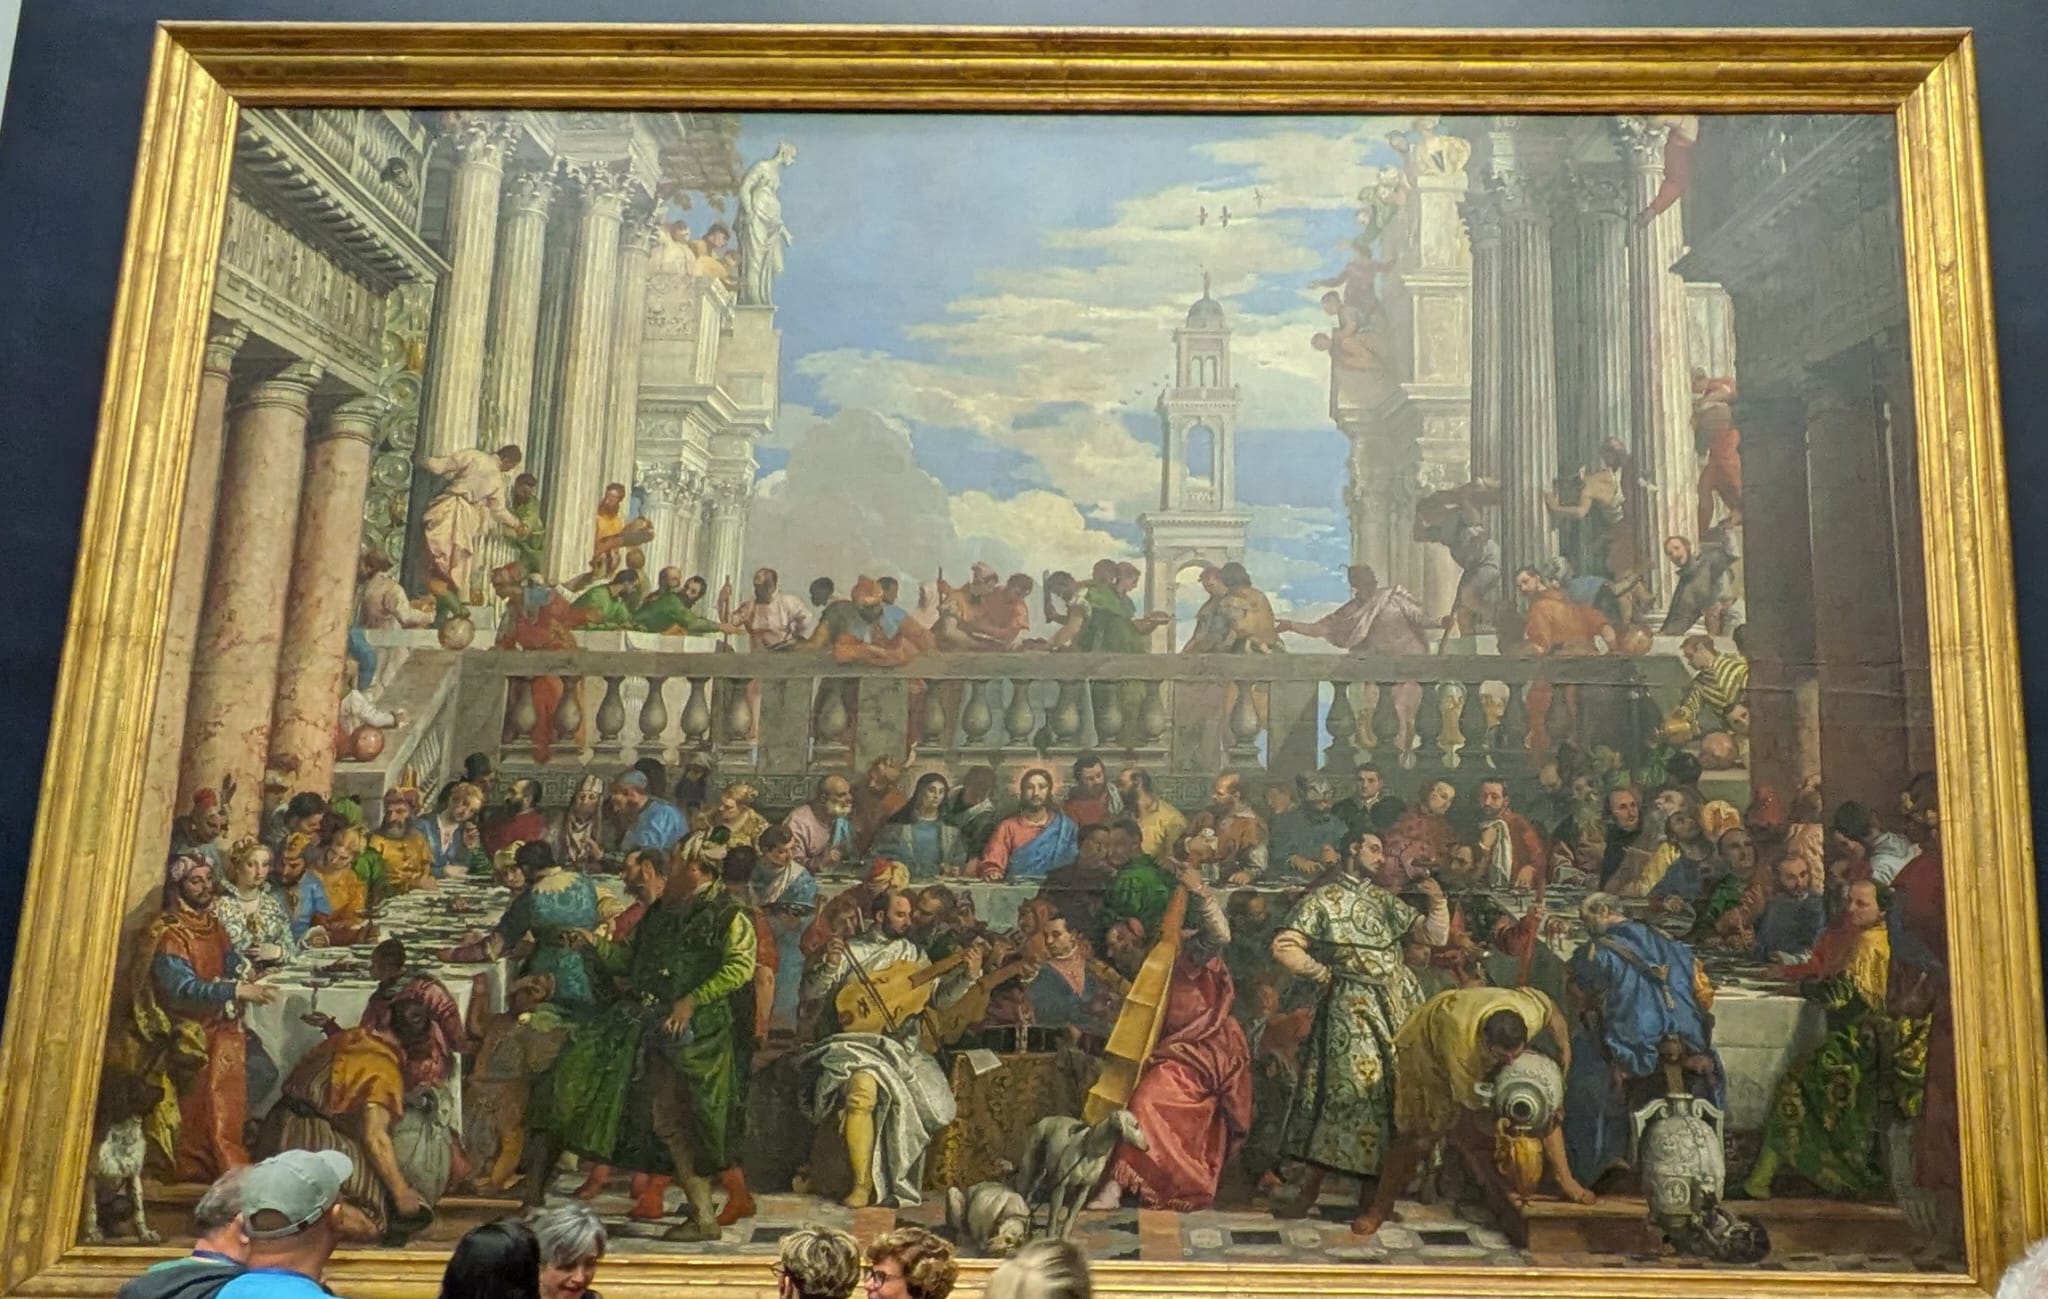
Years later, also in 2025, during the trip that took us Paris, we visited the Louvre for the first time with the kids and they could stand in front of the Mona Lisa: the very painting Leonardo brought with him to Amboise and that Francis I bought, which is how it entered the French royal collection. Today it hangs in the Salle des États, facing Veronese’s “Wedding Feast at Cana”.
The Louvre.The Mona Lisa panel at the Louvre: Leonardo took the unfinished painting with him on all his travels, until his final move to France in 1516.Veronese’s “Wedding Feast at Cana”, facing the Mona Lisa in the Salle des États.
In 2025, we also visited the village of Romorantin where Leonardo had plans to build the ideal city, but that project could not be pursued and there are no traces of it other than a small model in the village’s museum. What we still miss seeing in person is the Last Supper in Milano.
As the site itself puts it, together with his birthplace in Vinci the Clos Lucé is the only known home Leonardo ever had. That, the machines in the park and the immersive center make it a must visit for those wanting to enjoy Leonardo’s legacy.
“The discovery of America, and that of the passage to the East Indies by the Cape of Good Hope, are the two greatest and most important events recorded in the history of mankind.”
“What benefits or what misfortunes to mankind may hereafter result from those great events, no human wisdom can foresee.”
Adam Smith, The Wealth of Nations (1776), Book IV, Chapter VII
I come back very often to this quote, typically around Columbus day (October 12th) or when discussing the discovery of America. In this post I wanted to focus on the passage to the East Indies by the Cape of Good Hope, who opened it, how it happened, and what the route looks like today, with some data on trade and ships.
Portuguese exploration along the African coast accelerated under Prince Henry the Navigator in the early 15th century. The goals were practical and ambitious: find a sea route to the spice markets of India, reduce dependence on Muslim-controlled land routes, and expand trade and Christian influence.
Bartolomeu Dias, the man who opened the route
Very little is known about his early years. Bartolomeu Dias was born around 1450 in Portugal, probably into a family with a maritime tradition. He served at the court of King John II (João II) as a cavalier of the royal household and superintendent of the royal warehouses, and in 1481 he is believed to have taken part in Diogo de Azambuja’s expedition to the Gold Coast (modern Ghana) to establish the fortress and trading post of São Jorge da Mina (Elmina). In October 1486 he received an annuity from the king for “services to come”.
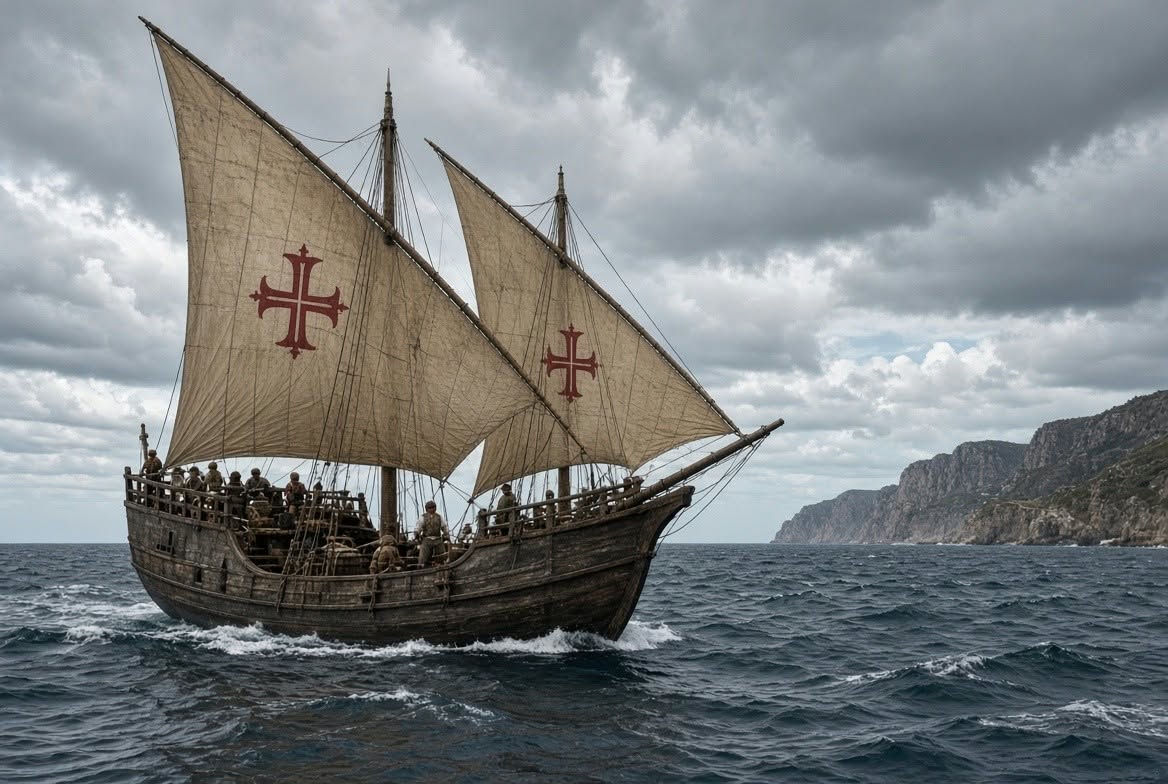
In 1487 the king commissioned him to continue the exploration of the African coast beyond the points reached by Diogo Cão, and to seek a sea route to Asia. He left Lisbon in July or August 1487 with three ships: two caravels of about 50 tons each (São Cristóvão, captained by himself, and São Pantaleão) plus a supply ship commanded by his brother Diogo. Some key points of the voyage:
He sailed down the West African coast past Cão’s markers, reaching Walvis Bay (Namibia) around 8 December 1487.
Driven southwest by storms (or deliberately sailing) into the open South Atlantic, he traced a wide arc well west of the African coast.
First landfall east of the cape: around 3-4 February 1488, at what is today Mossel Bay (South Africa). Without knowing it, he had already rounded the southern tip of Africa.
He continued east to Kwaaihoek, near the mouth of the Bushman’s River, where on 12 March 1488 the crew planted a padrão (stone pillar) dedicated to St. Gregory.
There the exhausted crew forced the return. On the way back they finally sighted the cape itself (May 1488). Dias reportedly named it Cabo das Tormentas (“Cape of Storms”); King John II later renamed it Cabo da Boa Esperança, “Cape of Good Hope”, because it promised a route to the East.
He arrived back in Lisbon in December 1488, some 16 months later, having charted hundreds of miles of previously unknown coast.
A caravel of the kind Dias sailed in 1487-88, lateen sails bearing the Cross of the Order of Christ (AI image by Grok)
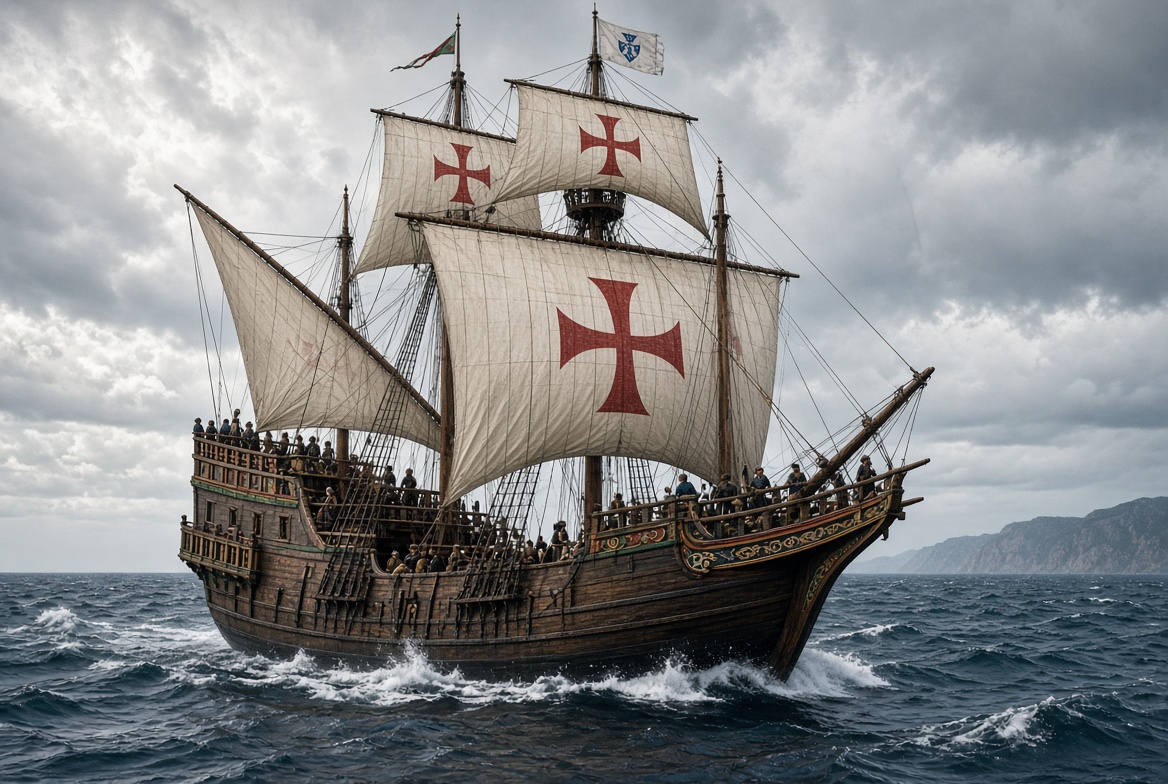
After his return he received limited recognition, but he helped design and outfit the ships (São Gabriel and São Rafael) for Vasco da Gama‘s 1497-1499 expedition to India. In 1500 he commanded a ship in Pedro Álvares Cabral’s fleet bound for India and died on 29 May 1500, when a storm sank four ships near the very cape he had first rounded twelve years earlier. Contemporary records of his voyage are scarce (many were lost in the 1755 Lisbon earthquake); much of what we know comes from later chroniclers such as João de Barros.
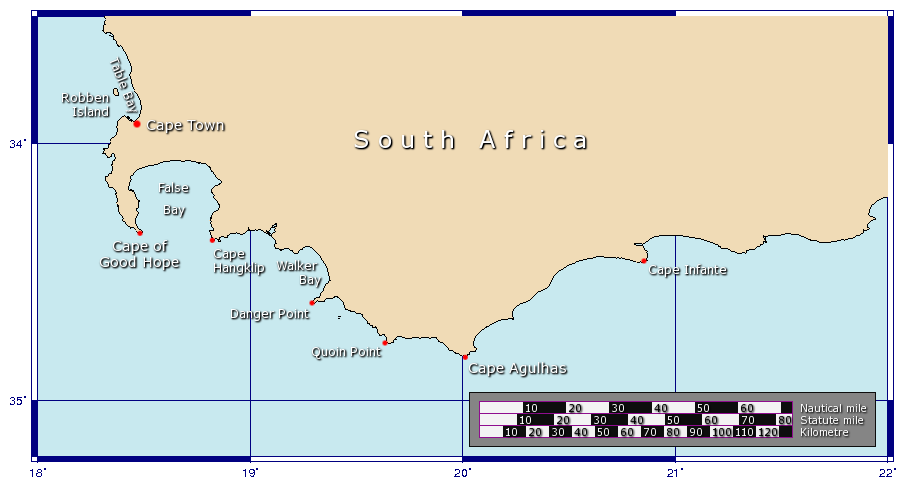
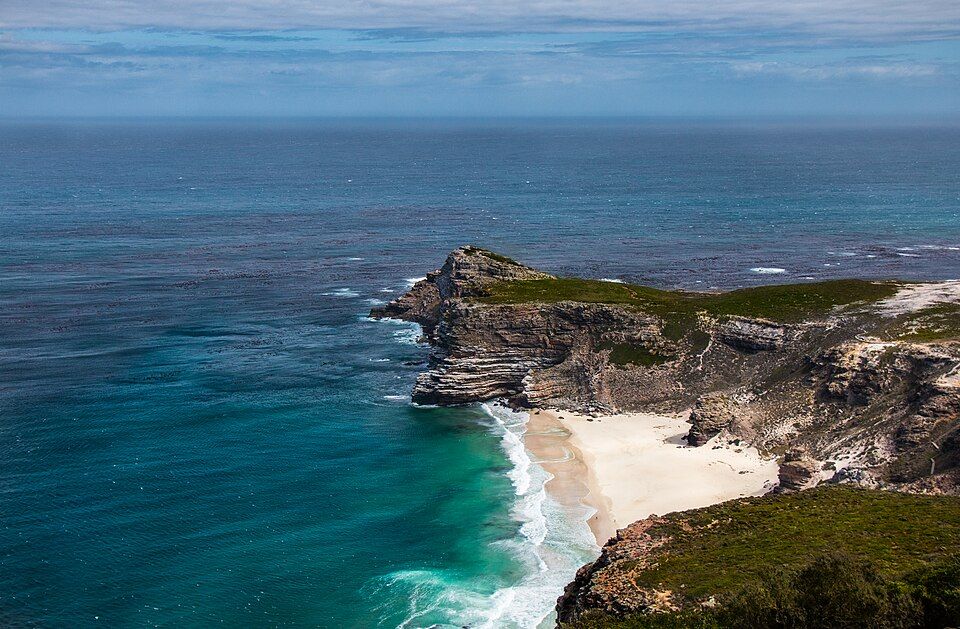
A nau like da Gama’s São Gabriel (1497); Dias superintended the building of da Gama’s ships (AI image by Grok)The Cape of Good Hope and the neighbouring capes (Cape Agulhas is the true southern tip of Africa). Map: Johantheghost, Wikimedia Commons, CC BY-SA 3.0.Cape of Good Hope, Cape Town, South Africa
A school project (and a family trip)
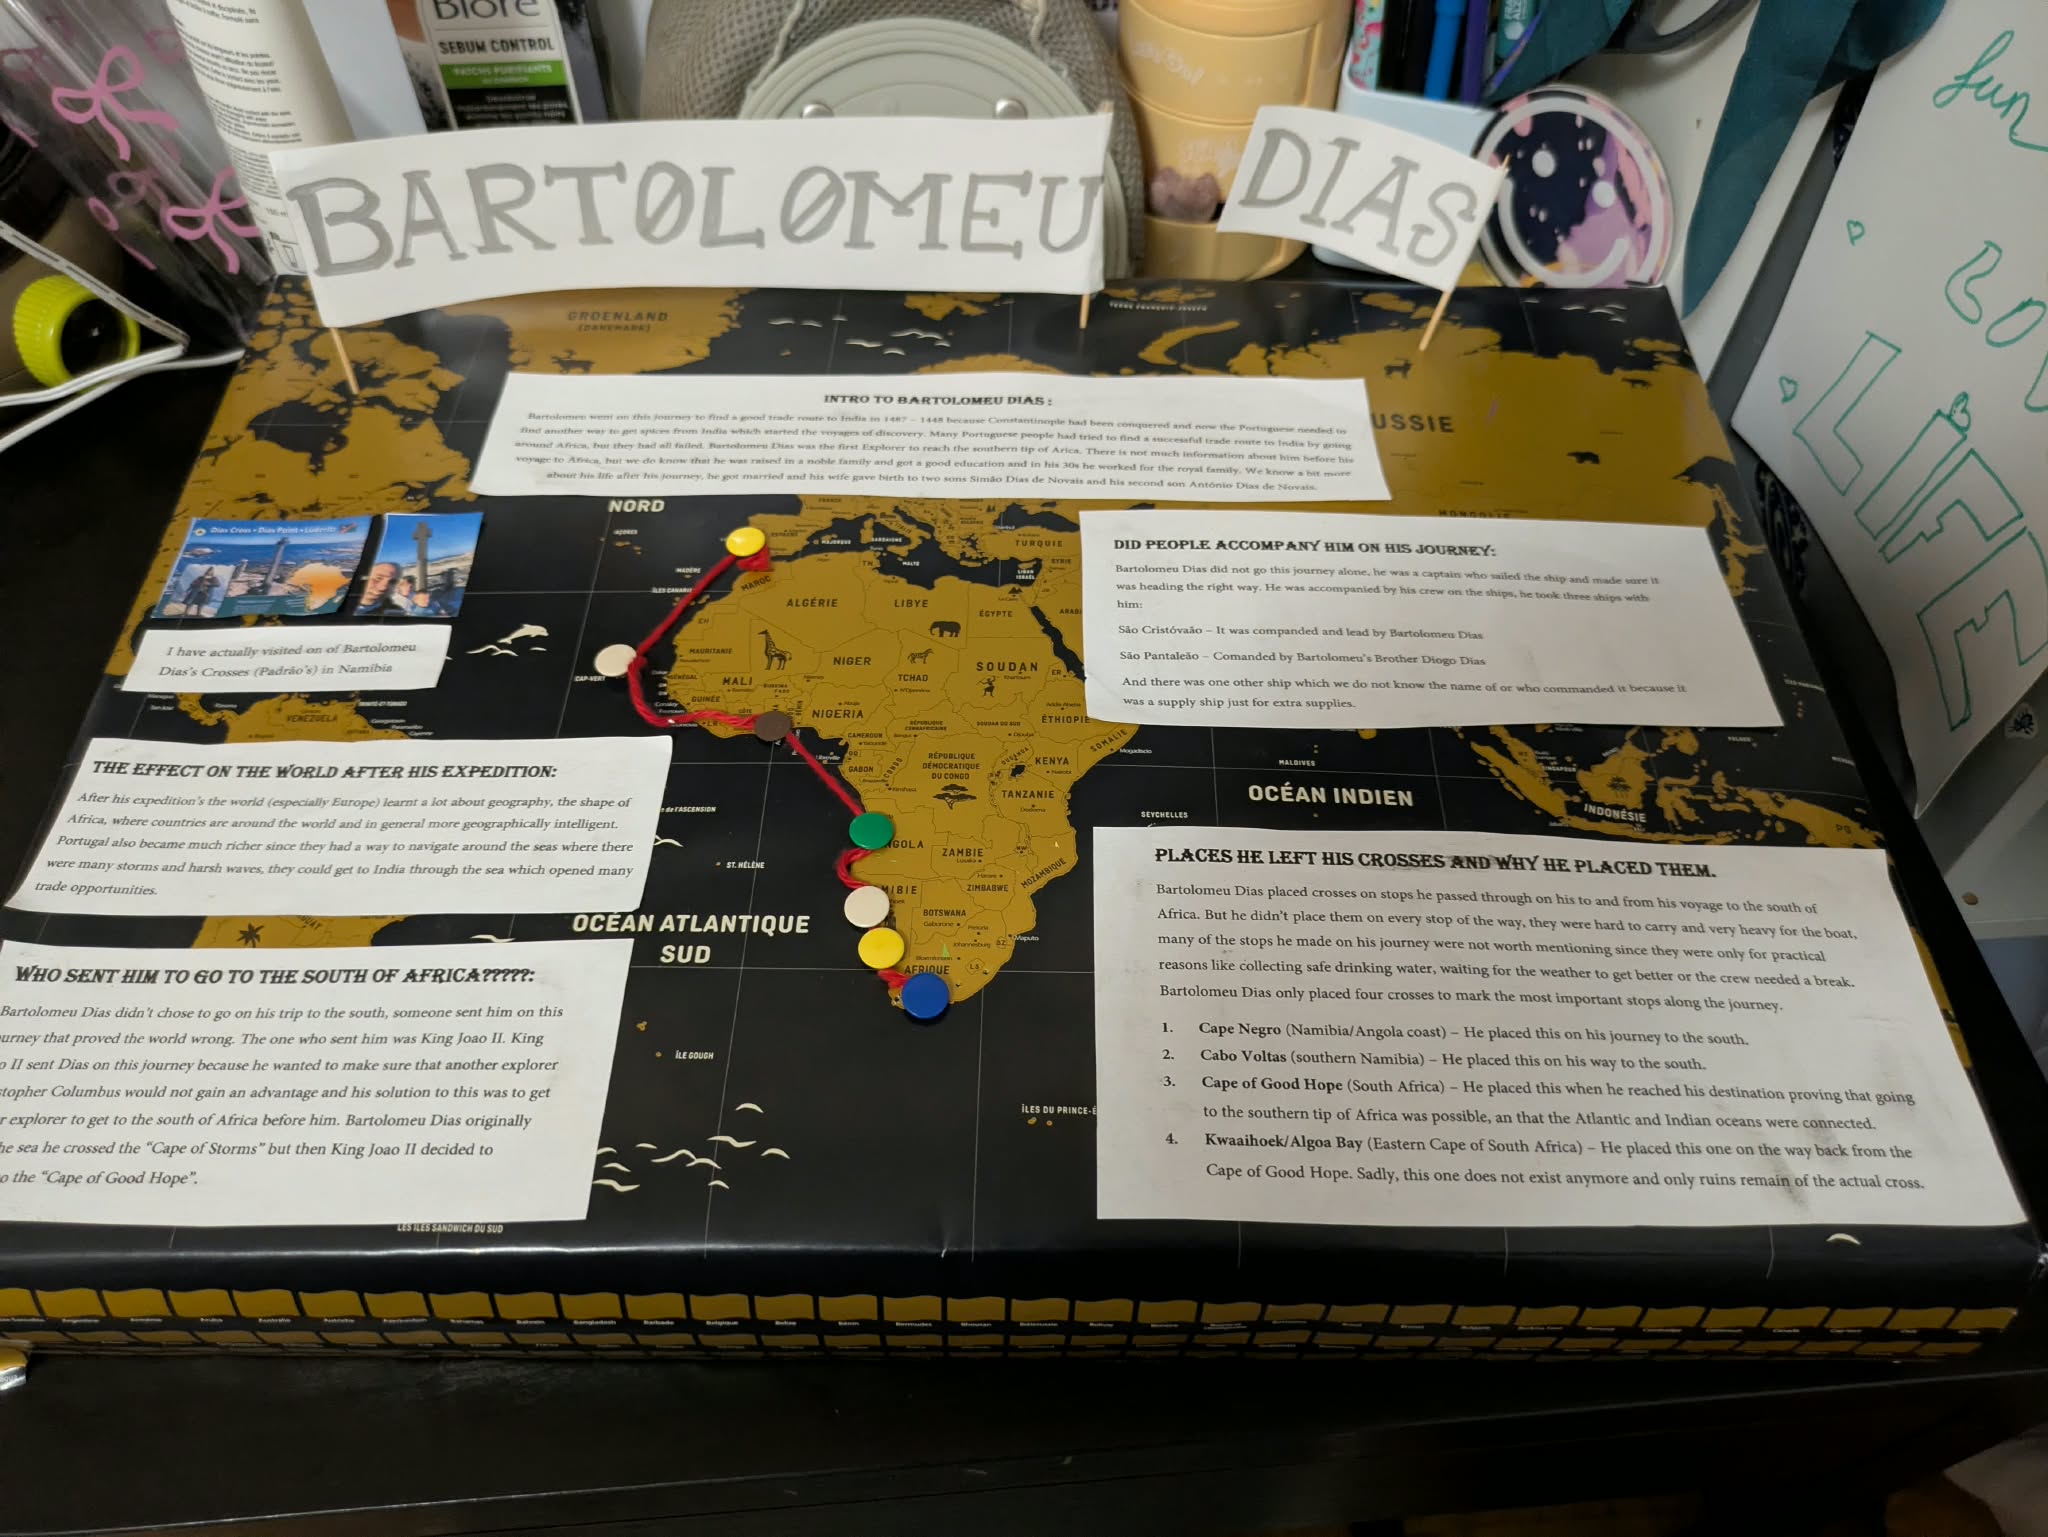
This is a subject we know well at home, as earlier this year when my daughter Andrea (then 12 years old and studying in grade 7) had to do a school project for History class, she chose to do it about Bartolomeu Dias, as they had been studying trade routes, the Silk road, etc.
My daughter’s school project on Bartolomeu Dias.
Her poster covers who sent him south (King John II), who accompanied him on the journey, the effect of the expedition on the world, and the four places where, according to her research, he left his crosses: Cape Negro, Cabo Voltas (both on the way south), the Cape of Good Hope, and Kwaaihoek / Algoa Bay on the way back. And she proudly notes: “I have actually visited one of Bartolomeu Dias’s Crosses (Padrão’s) in Namibia“.
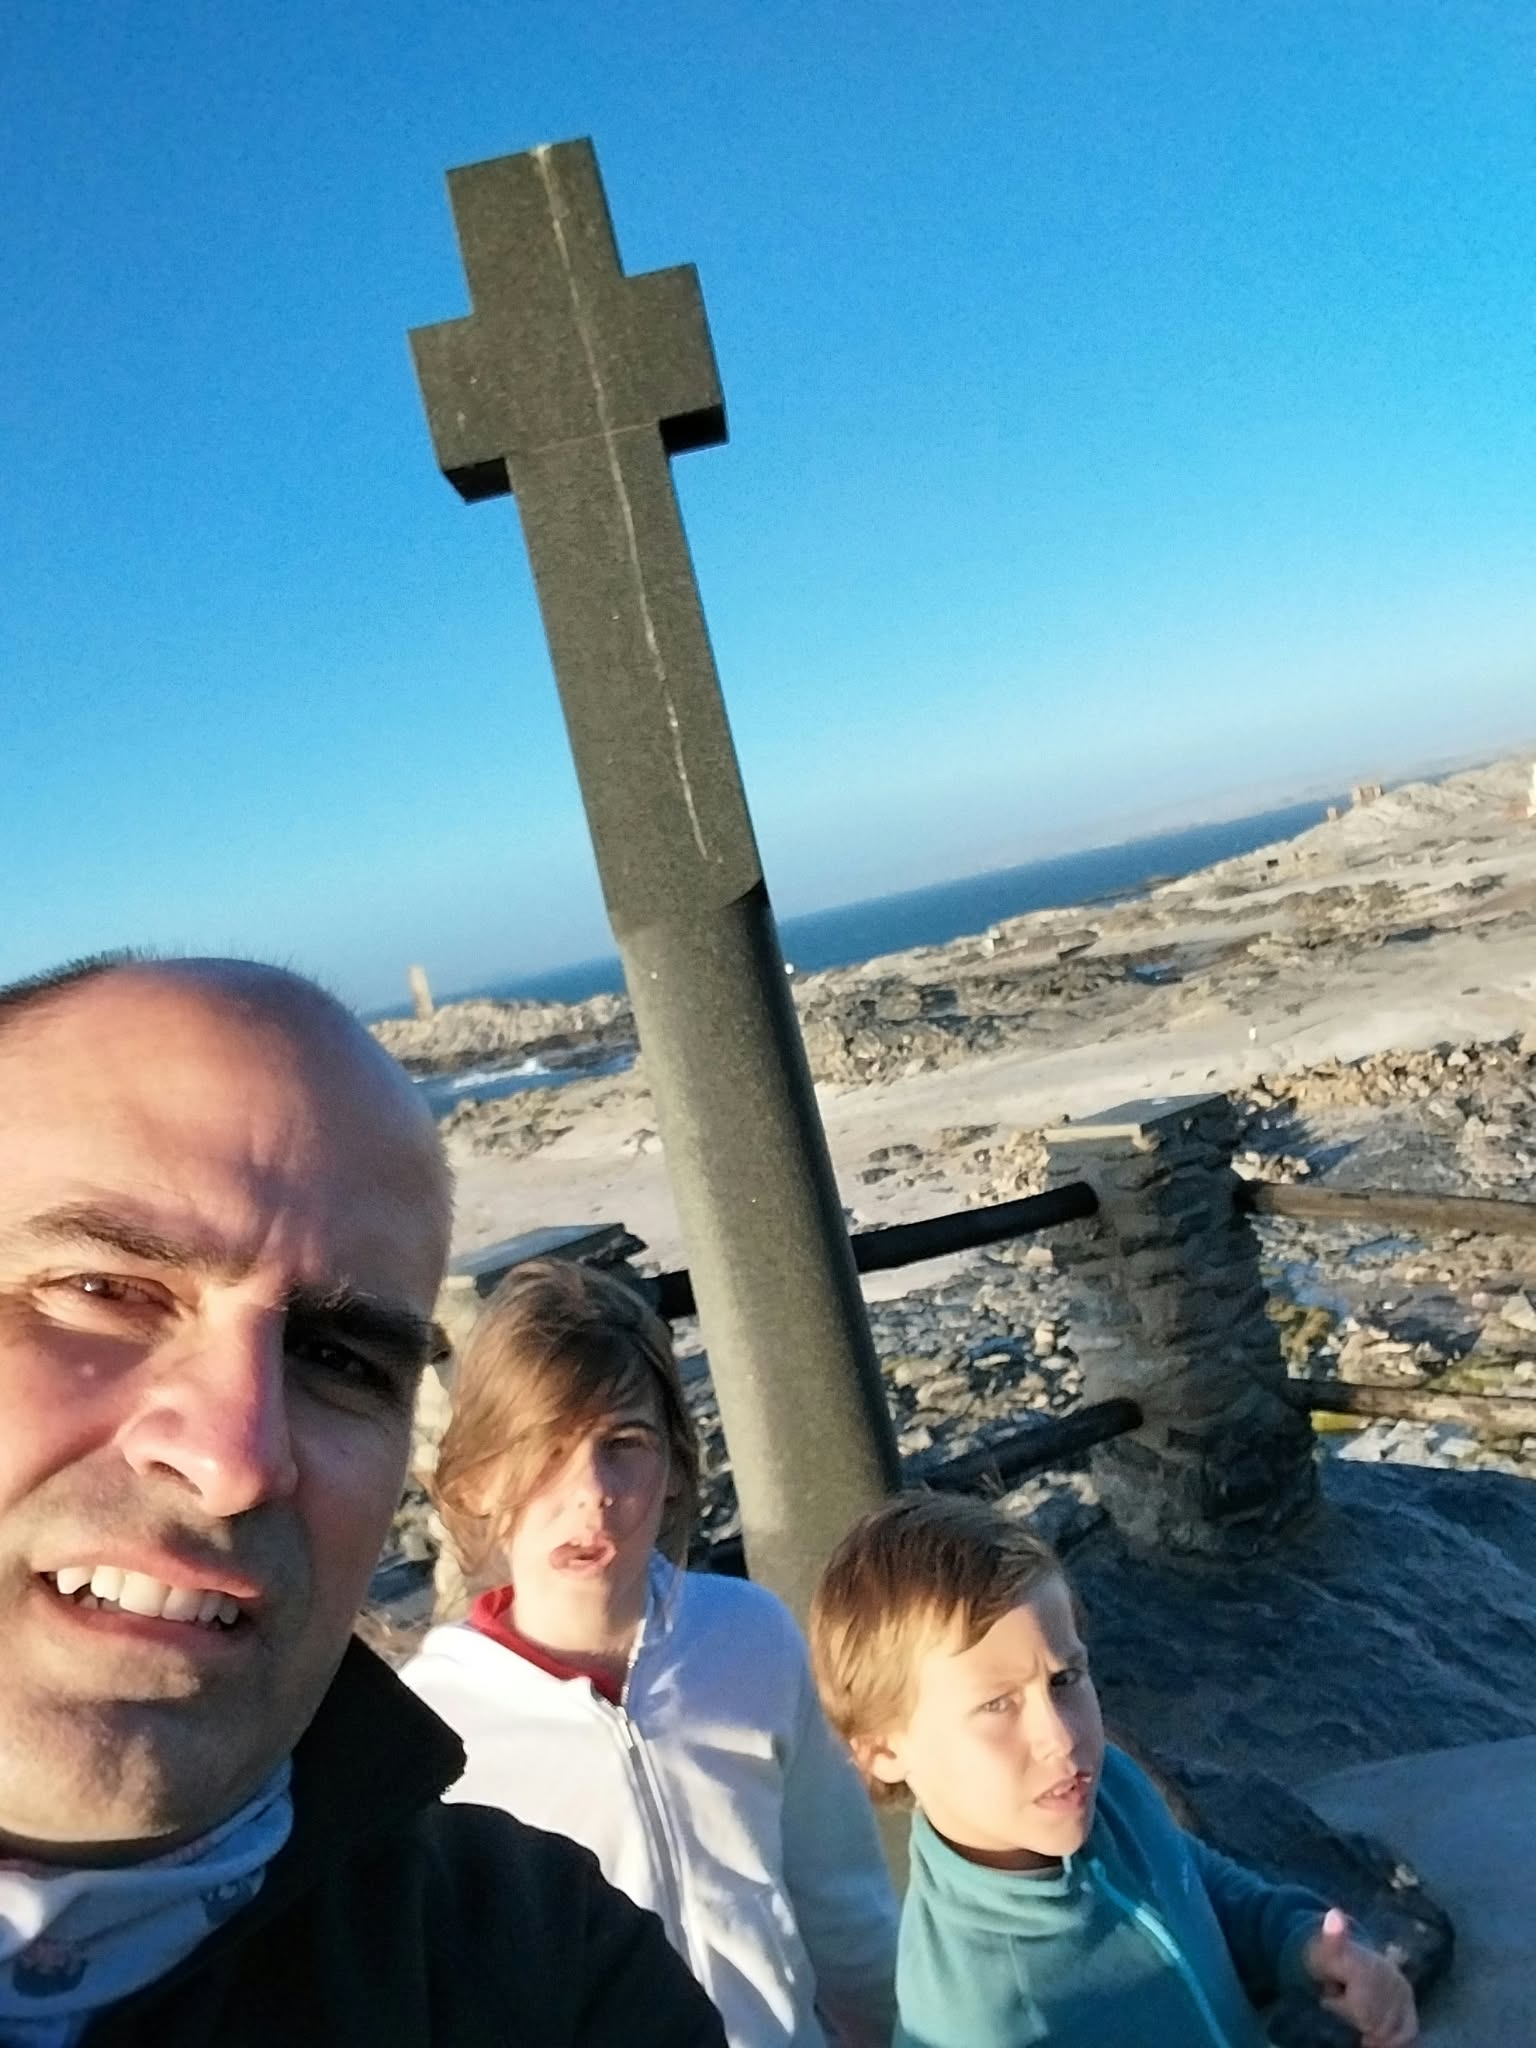
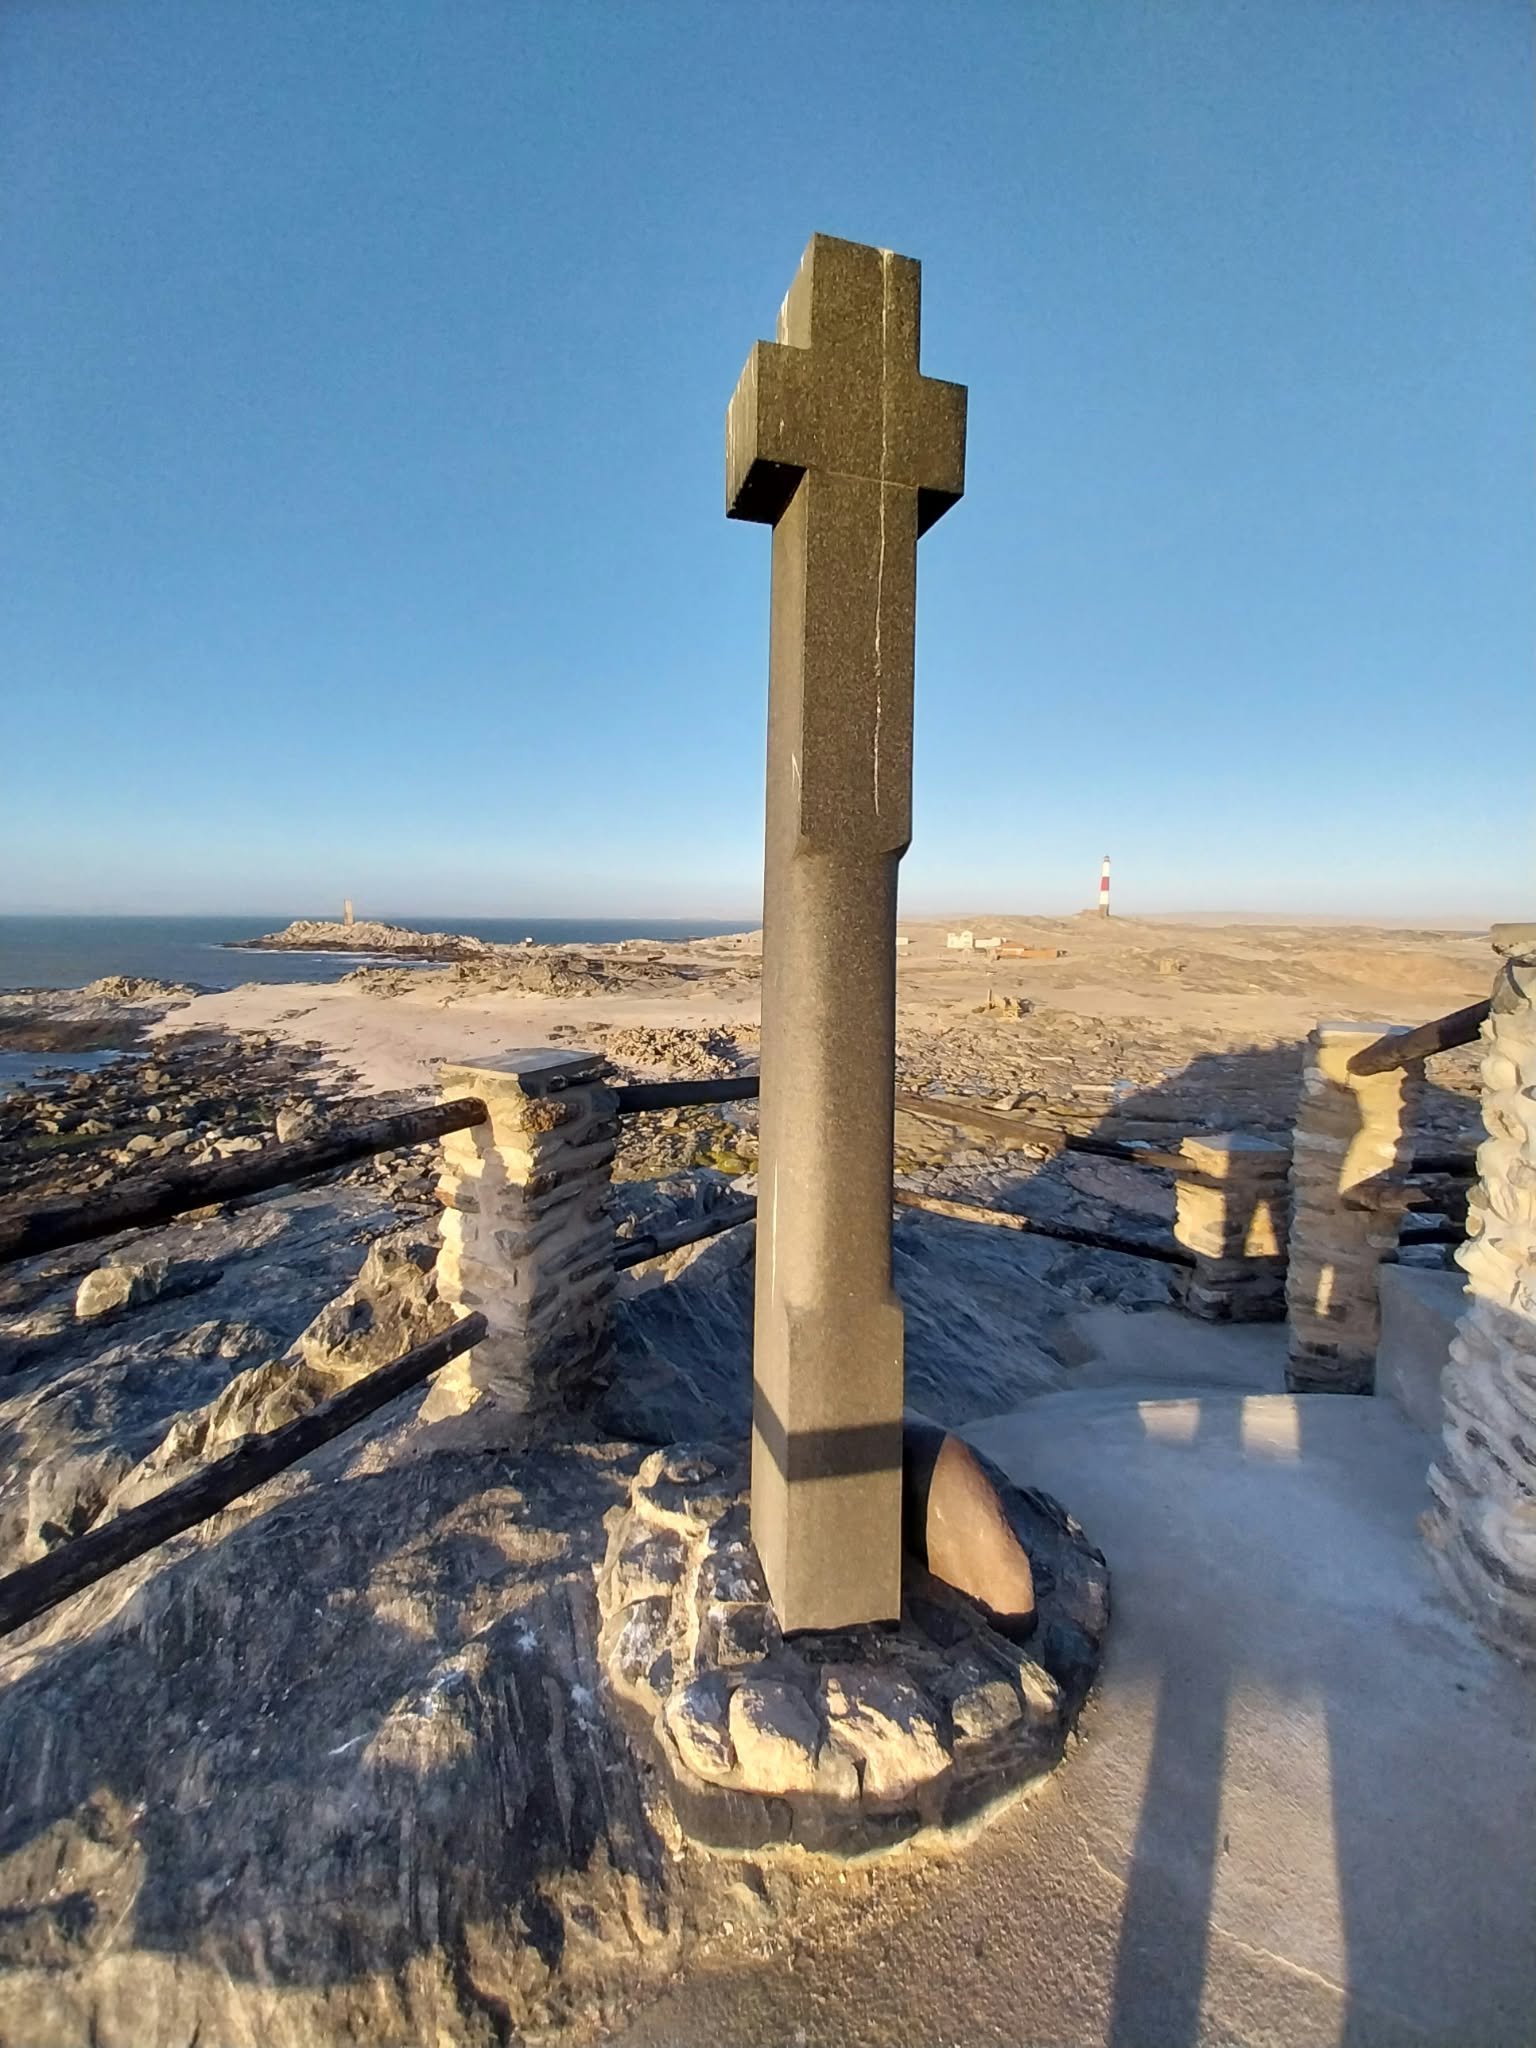
Indeed. On a family road trip around Namibia in 2024, we stopped at Dias Point, near Lüderitz, where a replica of that padrão still stands:
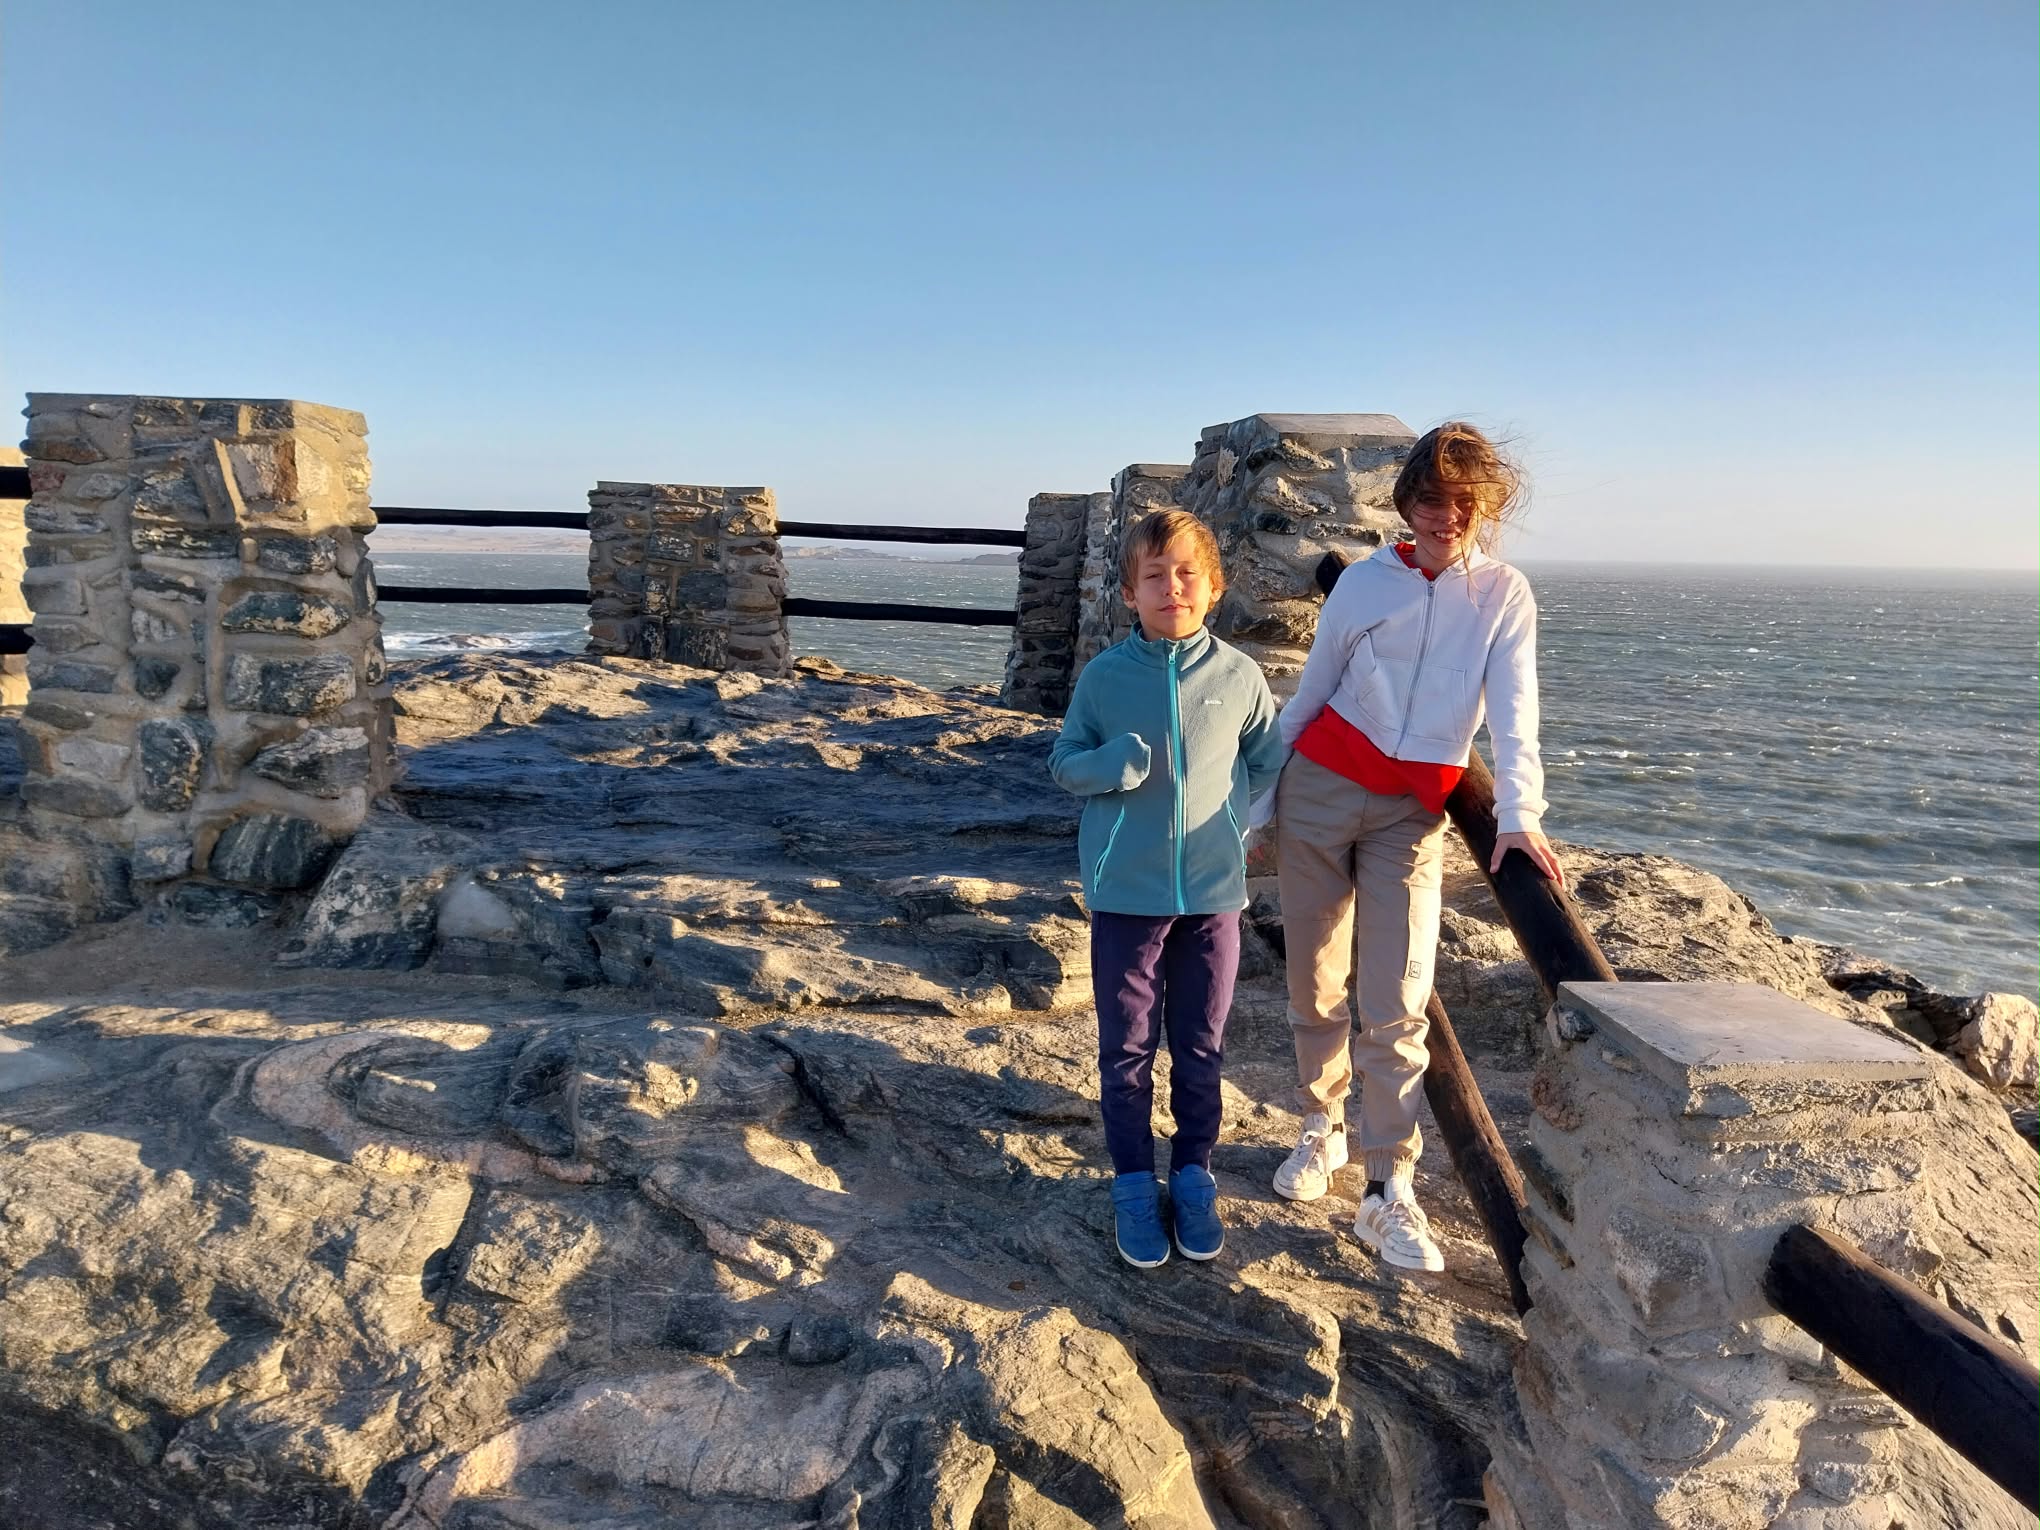
At the Dias cross, Dias Point (Namibia).The kids at Dias Point. The wind helps understand why Dias first named it Cape of Storms.
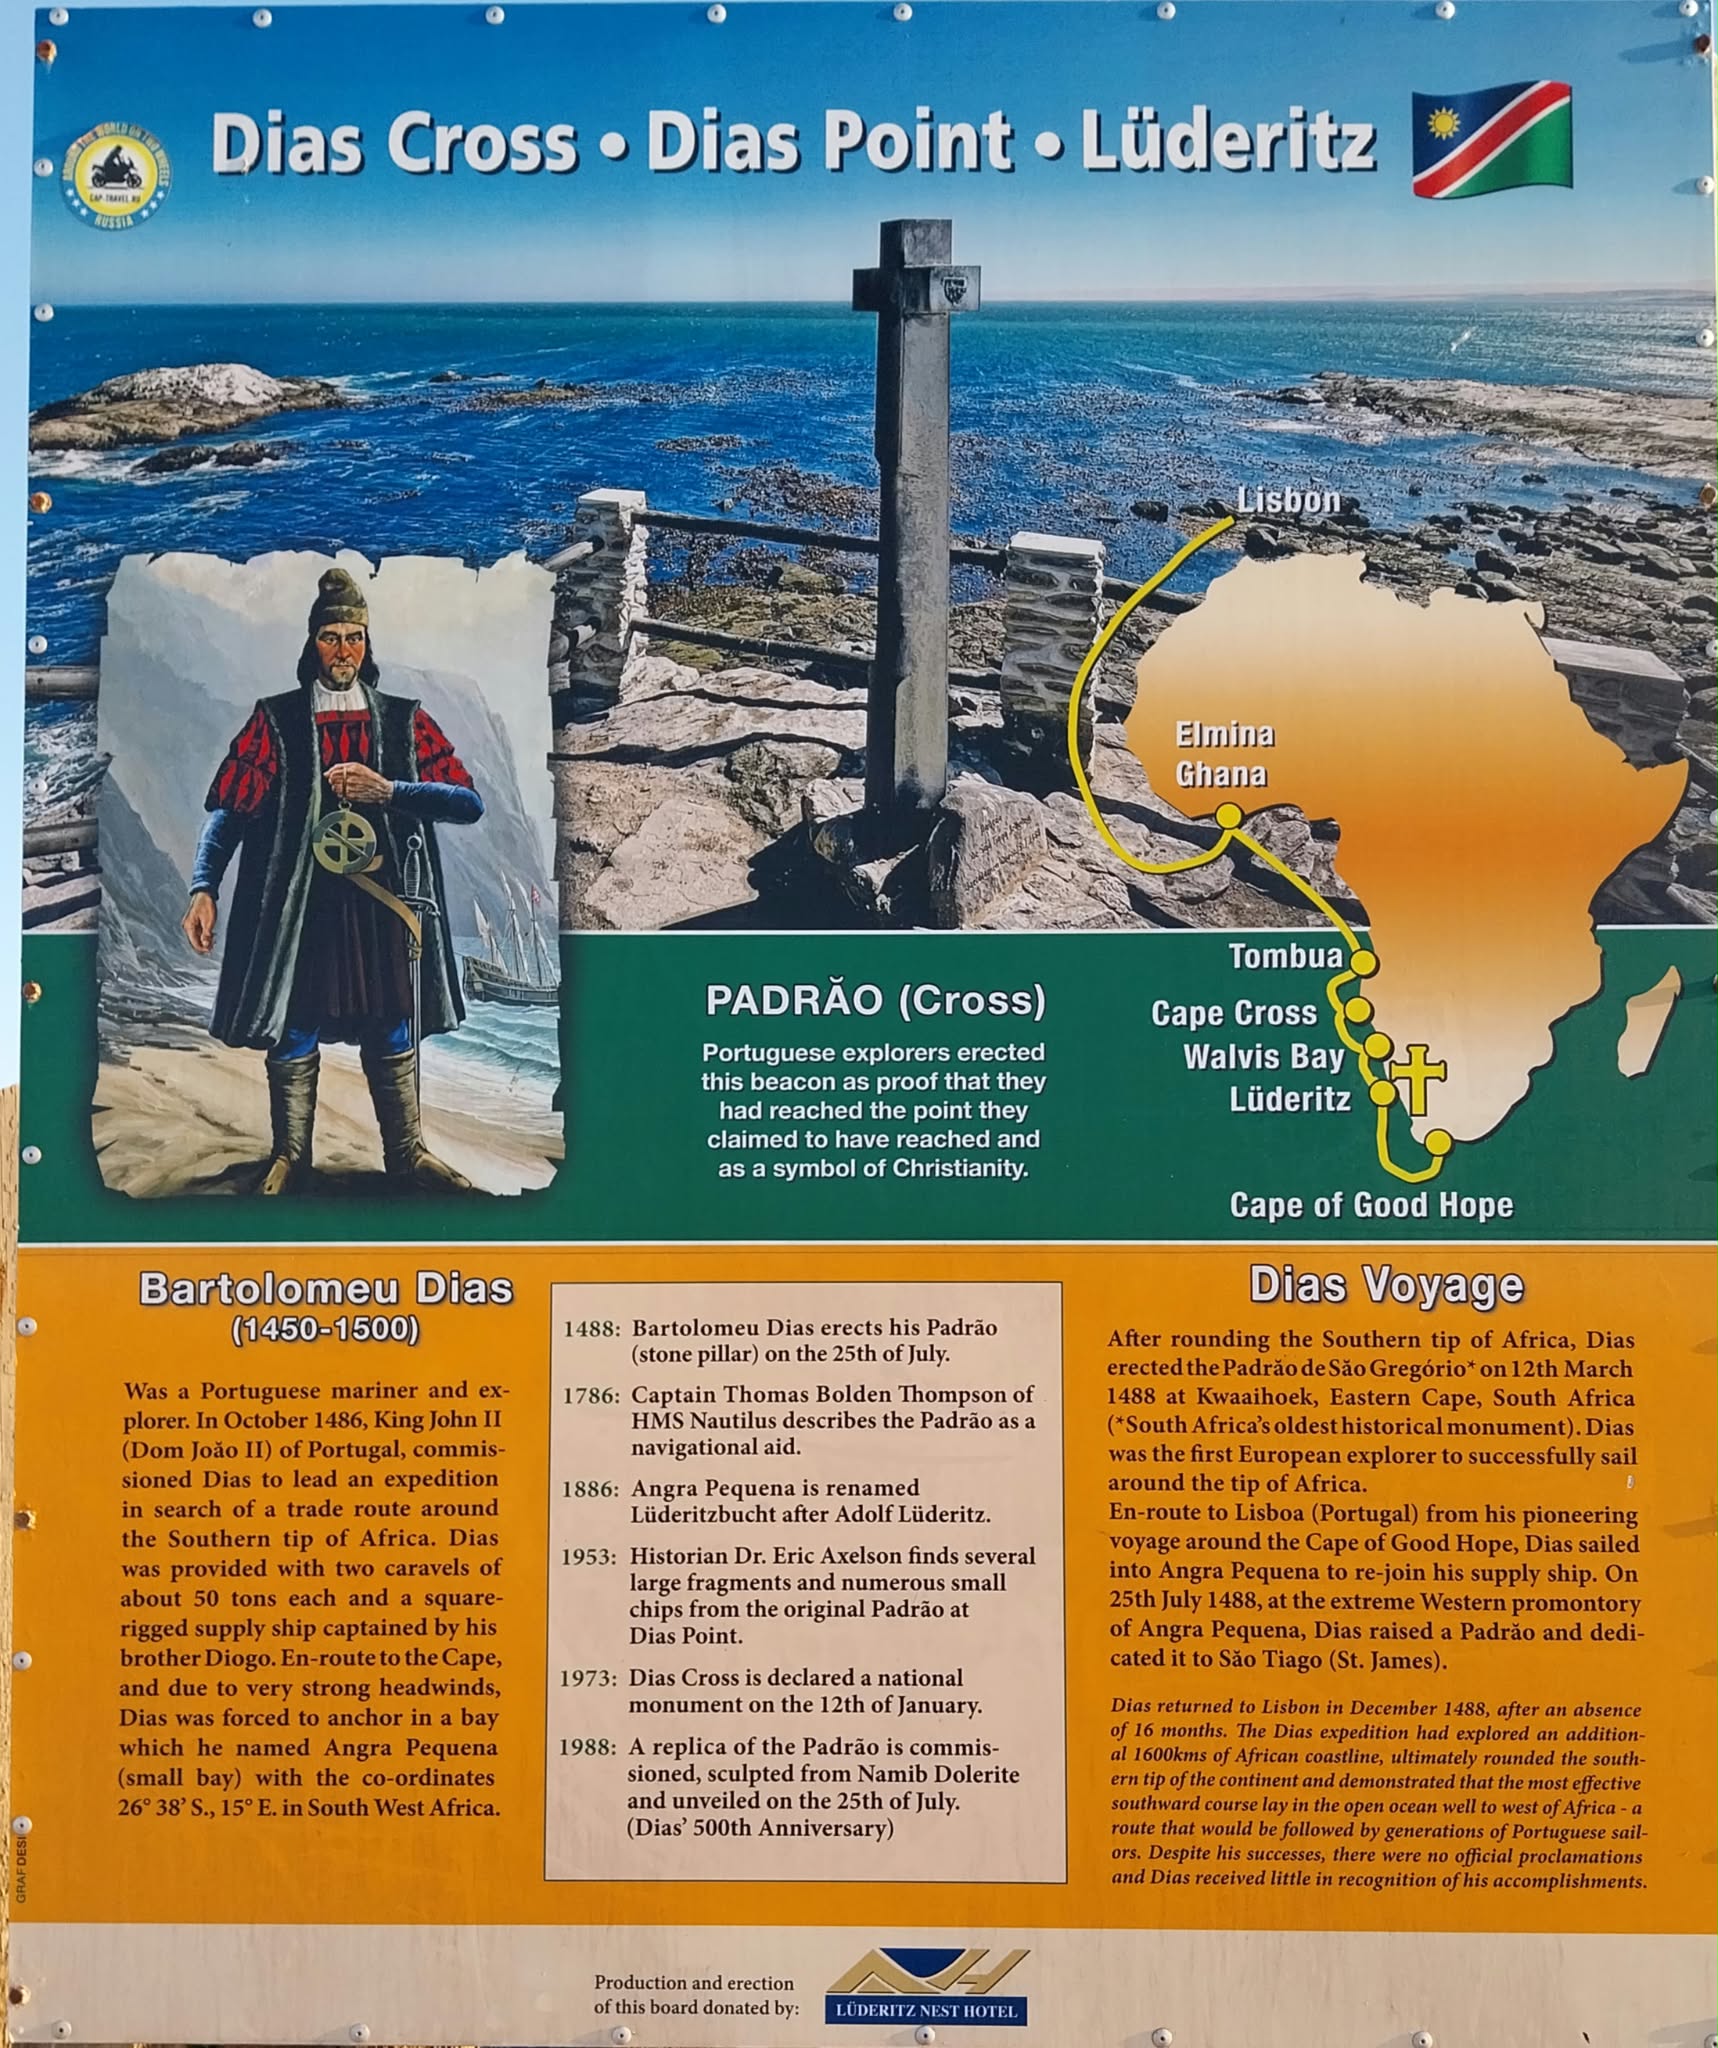
The information board at the site tells the story well: on 25 July 1488, on his way back to Lisbon, Dias was forced by strong headwinds to anchor in a bay he named Angra Pequena (26°38′ S, 15° E, today’s Lüderitz), where he raised a padrão dedicated to São Tiago (St. James). The original cross eroded away; in 1953 the historian Eric Axelson found fragments of it at Dias Point, and in 1988, for the 500th anniversary of the voyage, a replica sculpted from Namib dolerite was unveiled there.
Information board at Dias Cross, Dias Point, Lüderitz (Namibia).The padrão replica (1988) at Dias Point.
Was Smith right? The Cape route in today’s trade
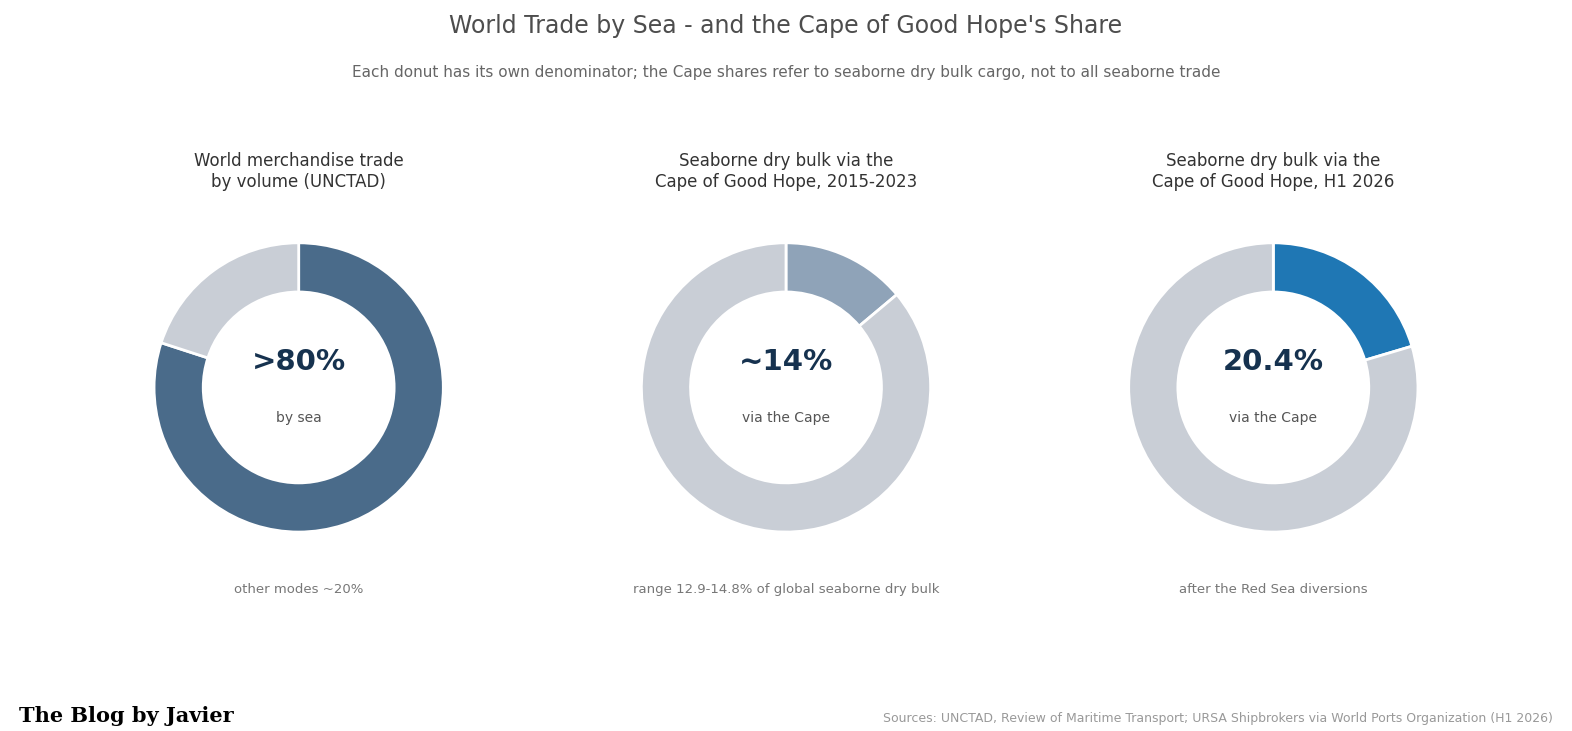
Let’s look at some data. Over 80% of world trade by volume moves by sea, according to UNCTAD. World merchandise exports were worth about $24.4 trillion in 2024 (WTO), against a world GDP of roughly $112 trillion in 2024 and some $118 trillion estimated for 2025 (IMF / World Bank). Air freight is marginal in volume, though significant in value.
And how much of that trade goes around the Cape of Good Hope?
Between 2015 and 2023, some 12.9%-14.8% of global dry bulk cargo (iron ore, coal, grains) rounded the Cape each year, according to URSA Shipbrokers data. The Suez Canal, the northern alternative, carries about 12% of global trade and some 30% of container traffic: over $1 trillion of goods a year on around 50 ships a day.
Since the Houthi attacks on Red Sea shipping started in late 2023, traffic diverted massively to the Cape: dry bulk cargo via the Cape rose to 19.1% of the global total in 2024 and 20.4% in the first half of 2026 (583.5 million tonnes out of about 2.86 billion).
Oil flows around the Cape rose nearly 50% with the diversions: from an average of 5.9 million barrels per day in 2023 to 8.7 million barrels per day in January-May 2024 (EIA) (that is 6 to 8% of world oil production, see this previous post I wrote on 2025 world oil picture).
Daily transits around the Cape averaged 42-56 ships per day in 2023 and 80-98 per day through 2025 and 2026 (86 in September 2026, the latest month available), on IMF PortWatch data: close to double the pre-crisis level.
For a typical Asia-Europe voyage, going around the Cape adds some 3,000-3,500 nautical miles and 7-10 days (World Bank); for a tanker from the Arabian Sea to Europe, the EIA puts the extra time at about 15 days.
Over 80% of world merchandise trade by volume moves by sea (UNCTAD); the Cape shares refer to seaborne dry bulk cargo only (URSA Shipbrokers via World Ports Organization).
In dollar terms: it is hard to give a precise bake for the Cape specifically. Pre-crisis Suez traffic was often estimated at over $1 trillion in goods value per year. The diverted portion of that, plus structural Cape bulk, represents a large absolute value, though bulk commodities have lower value density than containers. Extra costs from diversions (fuel, time, higher freight rates, insurance) have been substantial—tens of billions in aggregate higher logistics costs in the peak disruption years—but the underlying cargo value itself is in the hundreds of billions to low trillions annually depending on the exact mix and period. Even $1 trillion is only around 1% of a $112 trillion world economy. The comparison is just an order of magnitude: GDP measures value added produced in a year, while trade figures count gross cross-border sales, partly double-counted along supply chains. But the key point stands: the route Dias opened 538 years ago remains the flexible open-sea alternative (no locks, no canal tolls) that keeps world trade moving when the northern chokepoints fail.
Capesize: the ships named after the cape
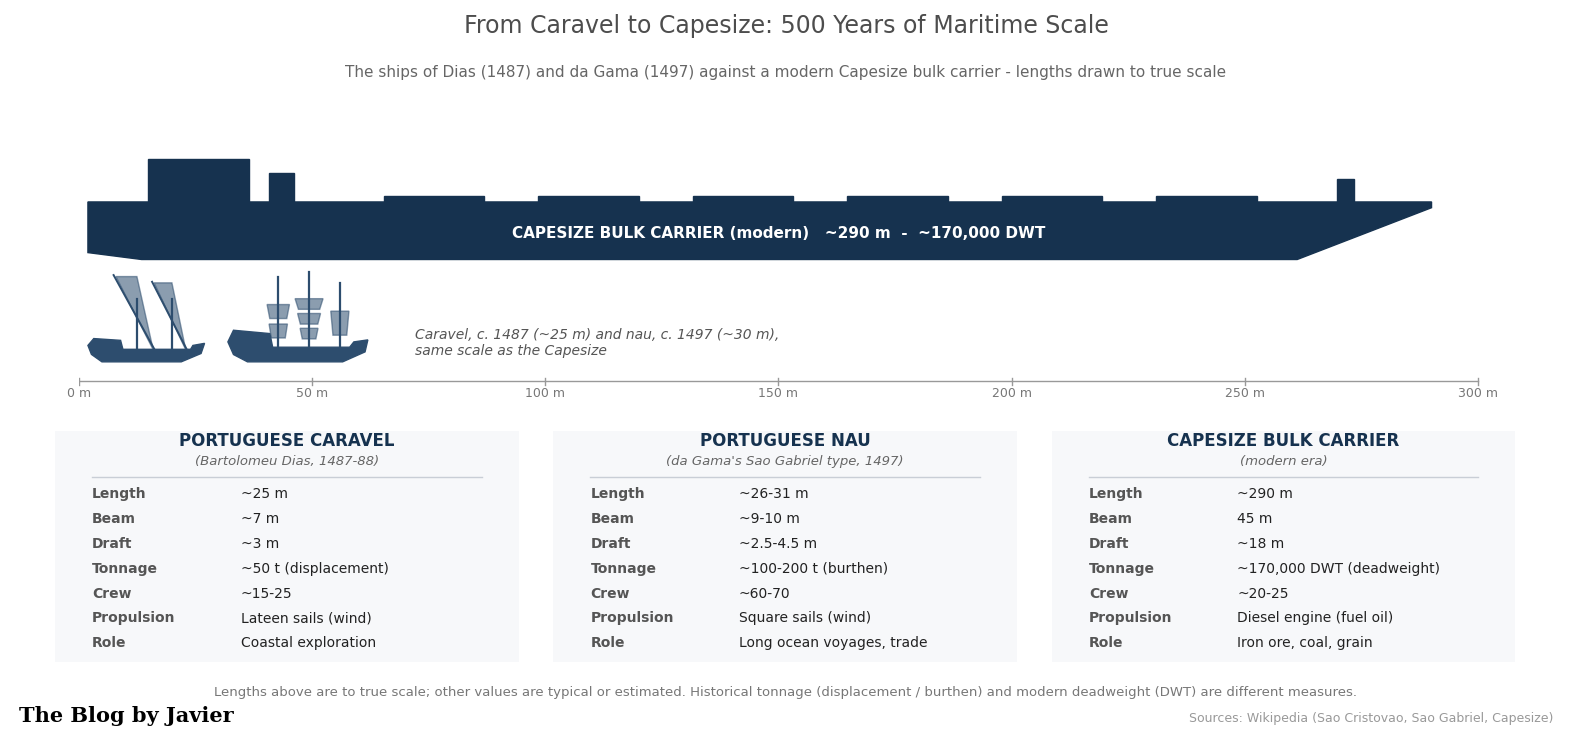
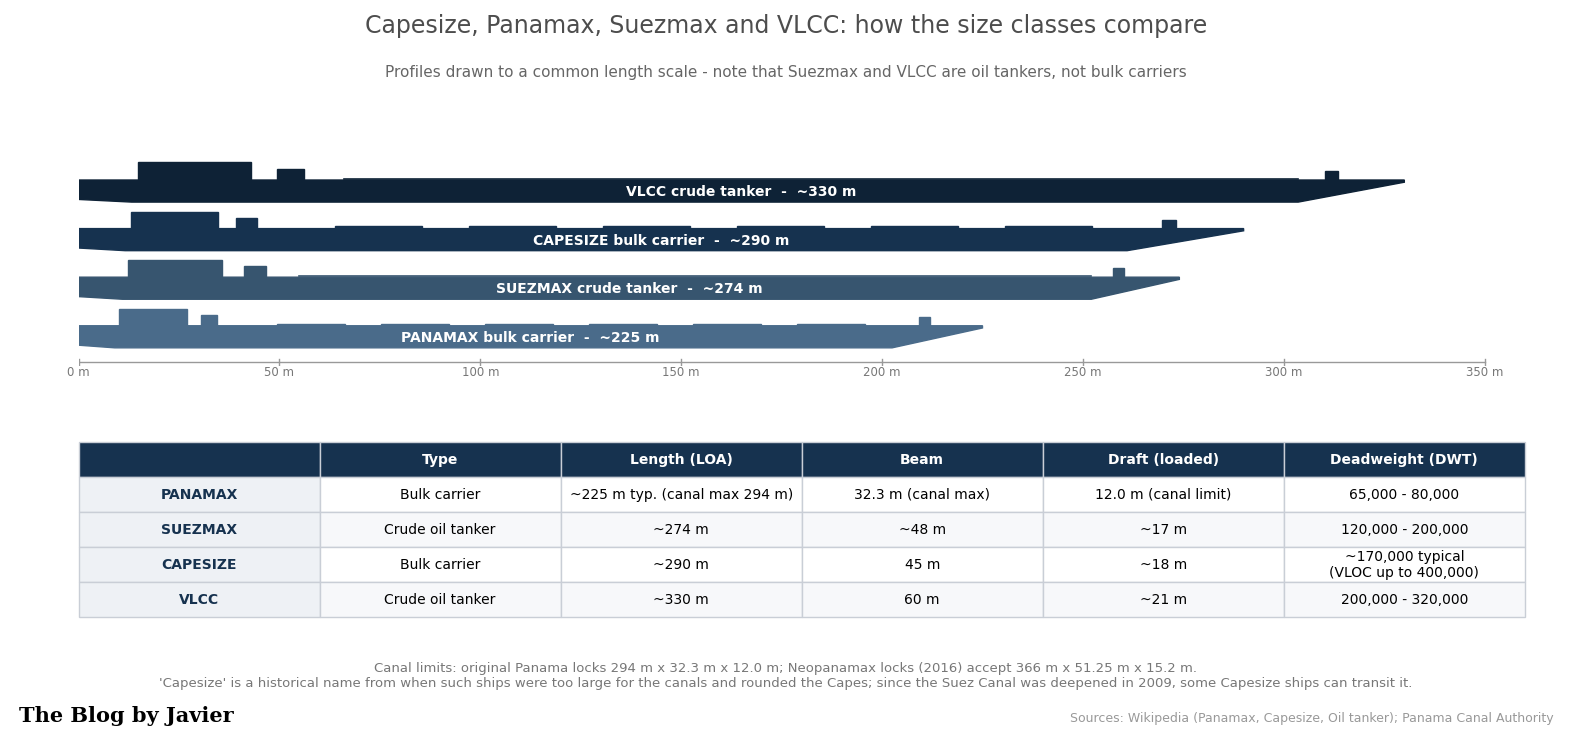
The Cape even gave its name to a whole class of ships. Capesize vessels are large dry bulk carriers of about 100,000-200,000+ deadweight tonnes (DWT), typically around 150,000-170,000: some 290 m long, 45 m of beam and 18 m of draft. They carry mostly coal, iron ore and other raw materials, and their size and deep draft mean that only the largest deep-water terminals can handle them. They were named for being too big for the canals: to move between oceans they had to go around the Cape of Good Hope (or Cape Horn). Since the Suez Canal was deepened in 2009, many Capesize ships can transit it, but the name stuck, and the Cape route remains their natural highway.
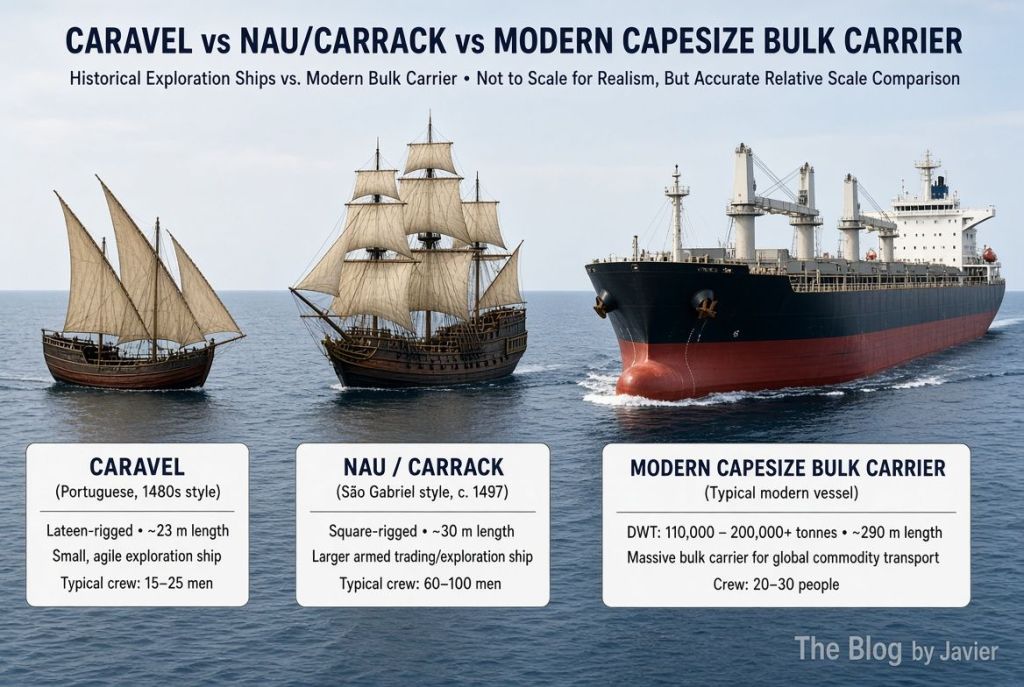
AI Grok comparison of a caravel as the one used by Bartolomeu Dias, a Nao as the one used by Vasco da Gama and a Capesize shipFrom Dias’s caravel (~25 m) and da Gama’s nau (~30 m) to a modern Capesize (~290 m): lengths drawn to true scale.
How do Capesize ships compare to other common ship classes?
Class
Typical DWT
Main type
Key constraint / route note
Panamax
~60-80k (up to ~120k Neopanamax)
Bulk / tanker
Sized to the Panama Canal locks
Suezmax
~120-200k (typical ~160k)
Tanker
Largest tanker class transiting Suez fully laden
Capesize
~100-200k+ (typical ~150-170k)
Dry bulk
Named for the Cape route; after the 2009 Suez deepening many can use the canal
Newcastlemax
~185-210k
Dry bulk
Upper end of Capesize; sized to the Port of Newcastle (50 m beam)
VLCC
~200-320k
Crude tanker
Very large crude carrier
Valemax / VLOC
~380-400k
Ore carrier
Largest bulk carriers built; deep-water ore terminals only
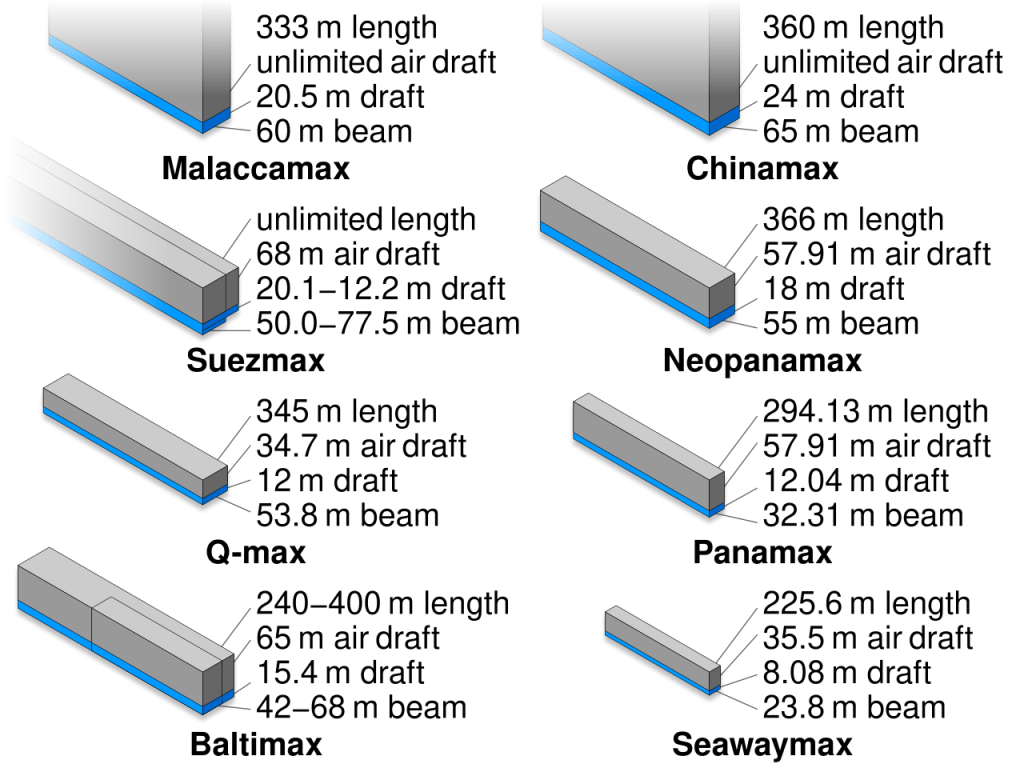
The main size classes at a common length scale; Suezmax and VLCC are oil tankers, not bulk carriers.Key dimensions of main classes of ships.
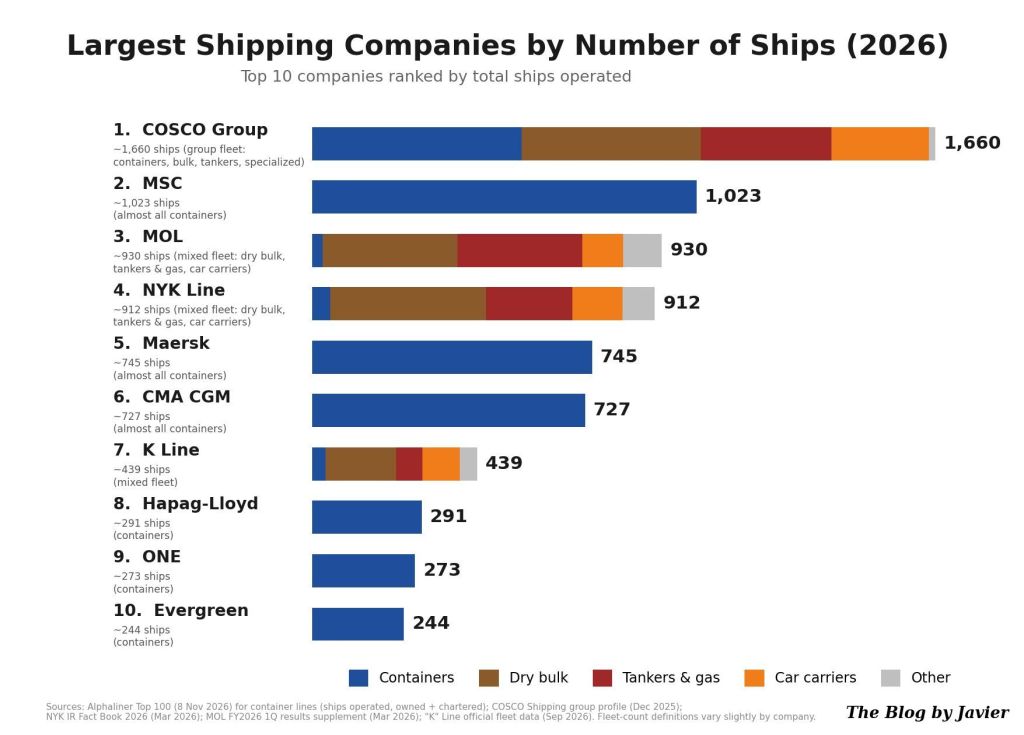
Which are the largest shipping companies in the world?
Infographic created by Instinct
The ports that receive them
Capesize ships can only call at the largest deep-water terminals, and they usually carry iron ore, coal and other raw materials, so this trade is highly concentrated between a relatively small number of specialized ports. A few characteristic examples:
On the loading (export) side:
Port Hedland (iron ore, Australia): one of the largest iron ore loading ports in the world and the largest in Australia. Newcastle (coal, Australia): the world’s largest coal export port, which gives its name to the Newcastlemax subclass.
On the discharge (import) side:
The deep-water iron ore terminals of China, which takes over 70% of world seaborne iron ore imports.
Back to Adam Smith
In the quote I shortened Smith’s sentence to “No human wisdom can foresee the benefits”. In the book, the full sentence reads: “What benefits or what misfortunes to mankind may hereafter result from those great events, no human wisdom can foresee”, and Smith himself stressed that for the natives of the East and West Indies the commercial benefits had been “sunk and lost in the dreadful misfortunes” those events occasioned.
Ten years after Dias, Vasco da Gama reached India using his route and his know-how. More than five centuries later, around ninety ships a day round the Cape of Good Hope keeping the world economy supplied, and whole classes of ships and port networks exist because of that passage. Dias received little recognition in his lifetime and died at sea next to the cape he had opened. Not a bad legacy for a “Cape of Storms”.
Infrastructure Australia (Port Hedland and Newcastle: world’s largest iron ore and coal export hubs) and Reuters (China buys over 70% of seaborne iron ore).
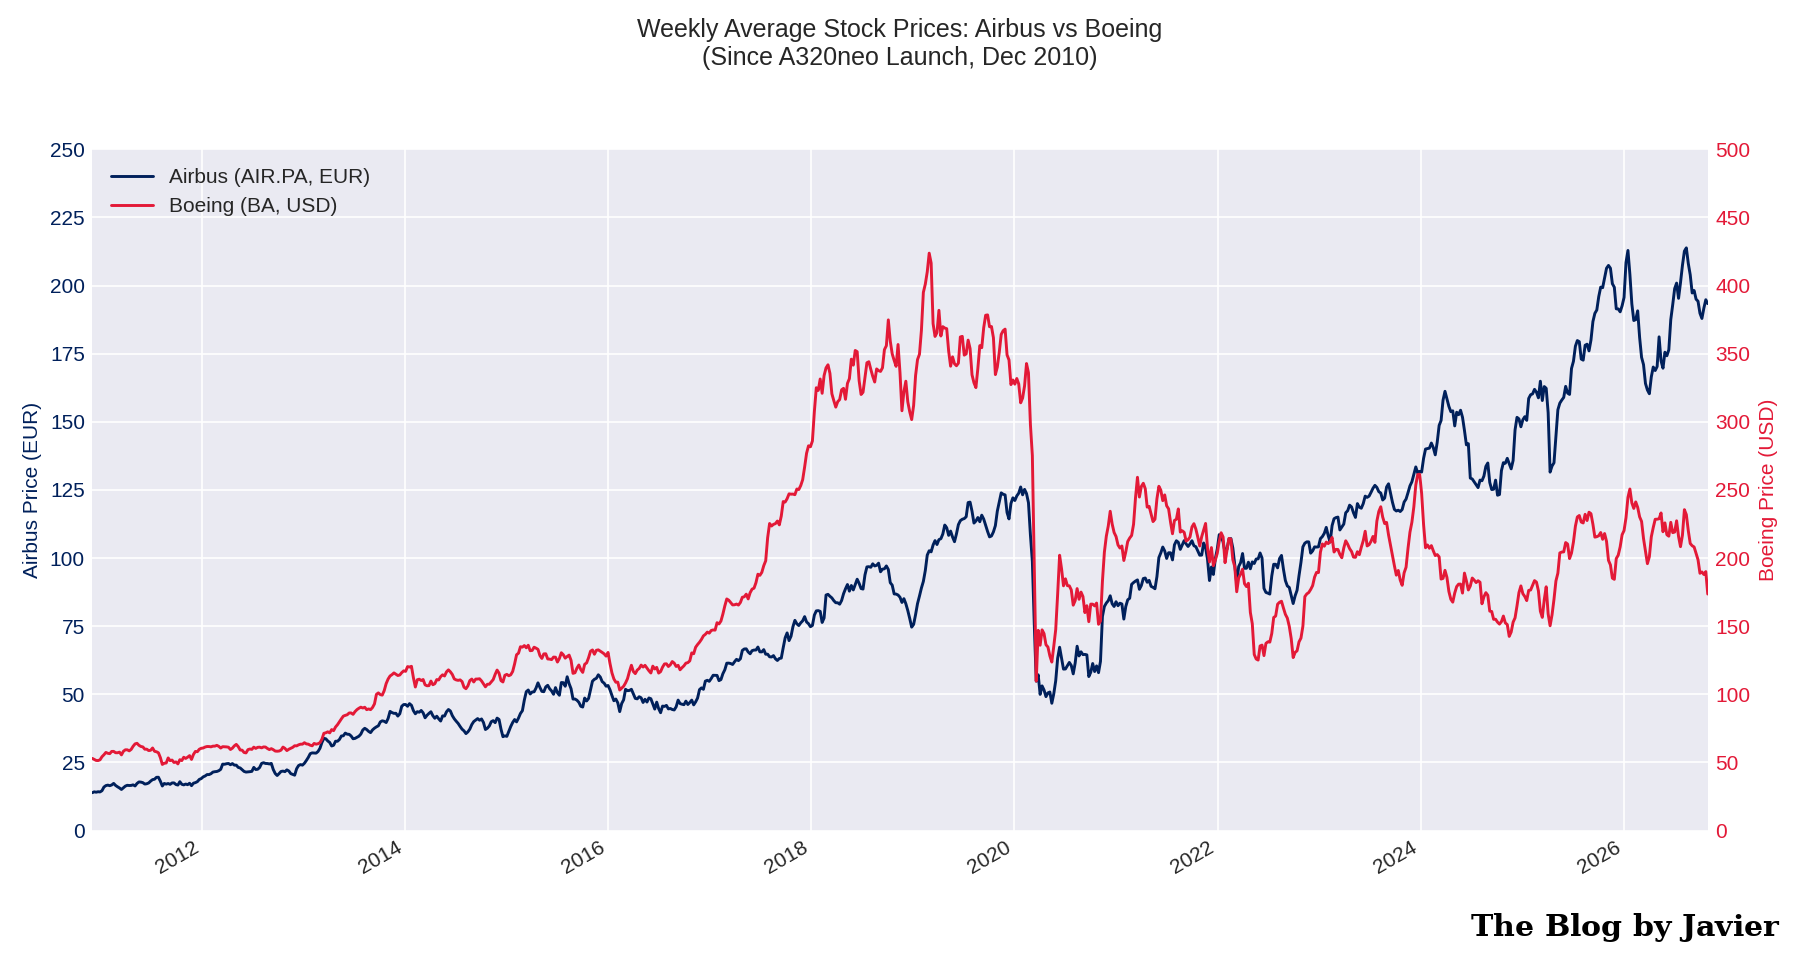
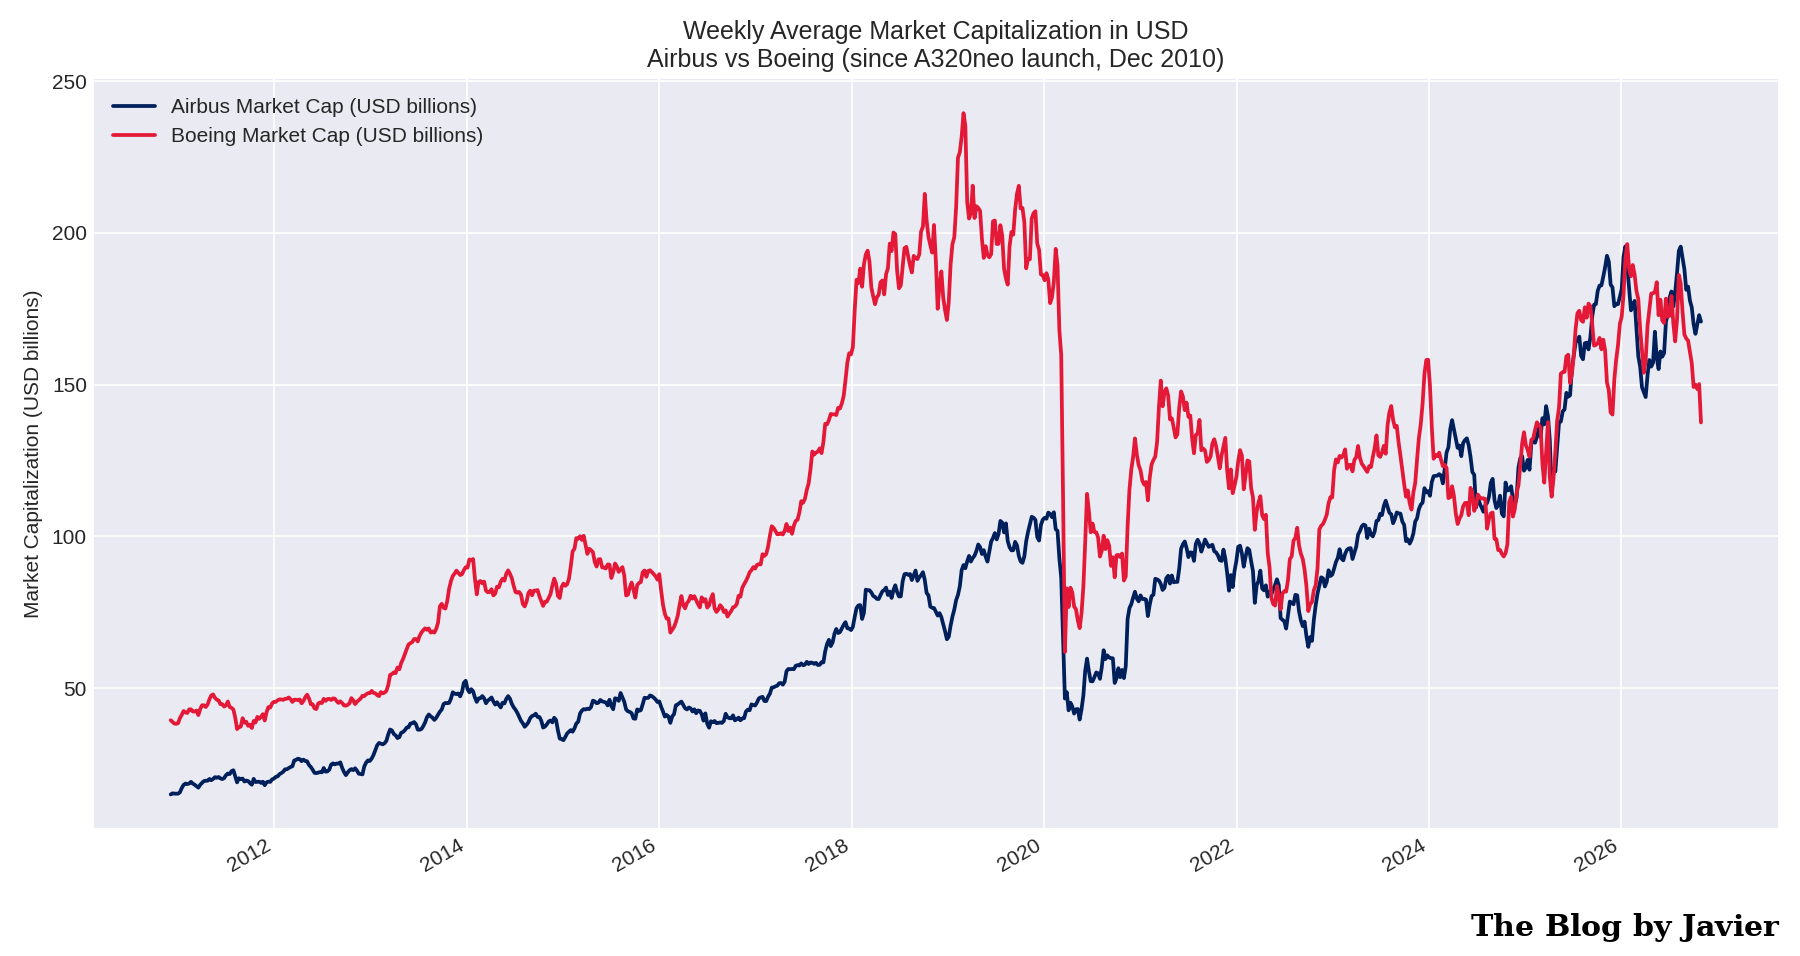
In March 2024 I wrote a quick post comparing the market capitalizations of Airbus and Boeing, when I realized that Airbus had overtaken Boeing. That post compared two snapshots in time: end of 2012 and March 2024. This post shows the figures for the complete period of time since the launch of the A320neo, on December 1st, 2010, until the end of October 2026: weekly stock prices, shares outstanding, the dollar-euro exchange rate, and the resulting market capitalizations in US dollars.
Methodology in short: weekly averages of daily closing prices (Friday-ending weeks), Airbus in euros at Euronext Paris (AIR.PA), Boeing in dollars at NYSE (BA), and the FRED DEXUSEU dollar-per-euro rate. Market capitalization each week is price times shares outstanding (times the exchange rate for Airbus). Shares outstanding are forward-filled from reported figures, so early years are approximate. Sources are listed at the end.
Stock prices
Airbus went from ~13.9€ in early December 2010 to ~193€ at the end of October 2026: multiplied by 14 (~18% compounded annual growth rate).
Boeing went from ~$53to ~$174: multiplied by 3.3 (~7.8% CAGR).
Boeing peaked above $400 in early 2019, just before the 737 MAX grounding, and has never recovered those levels. Airbus suffered a milder COVID dip and resumed climbing to record levels above 200€ in 2026.
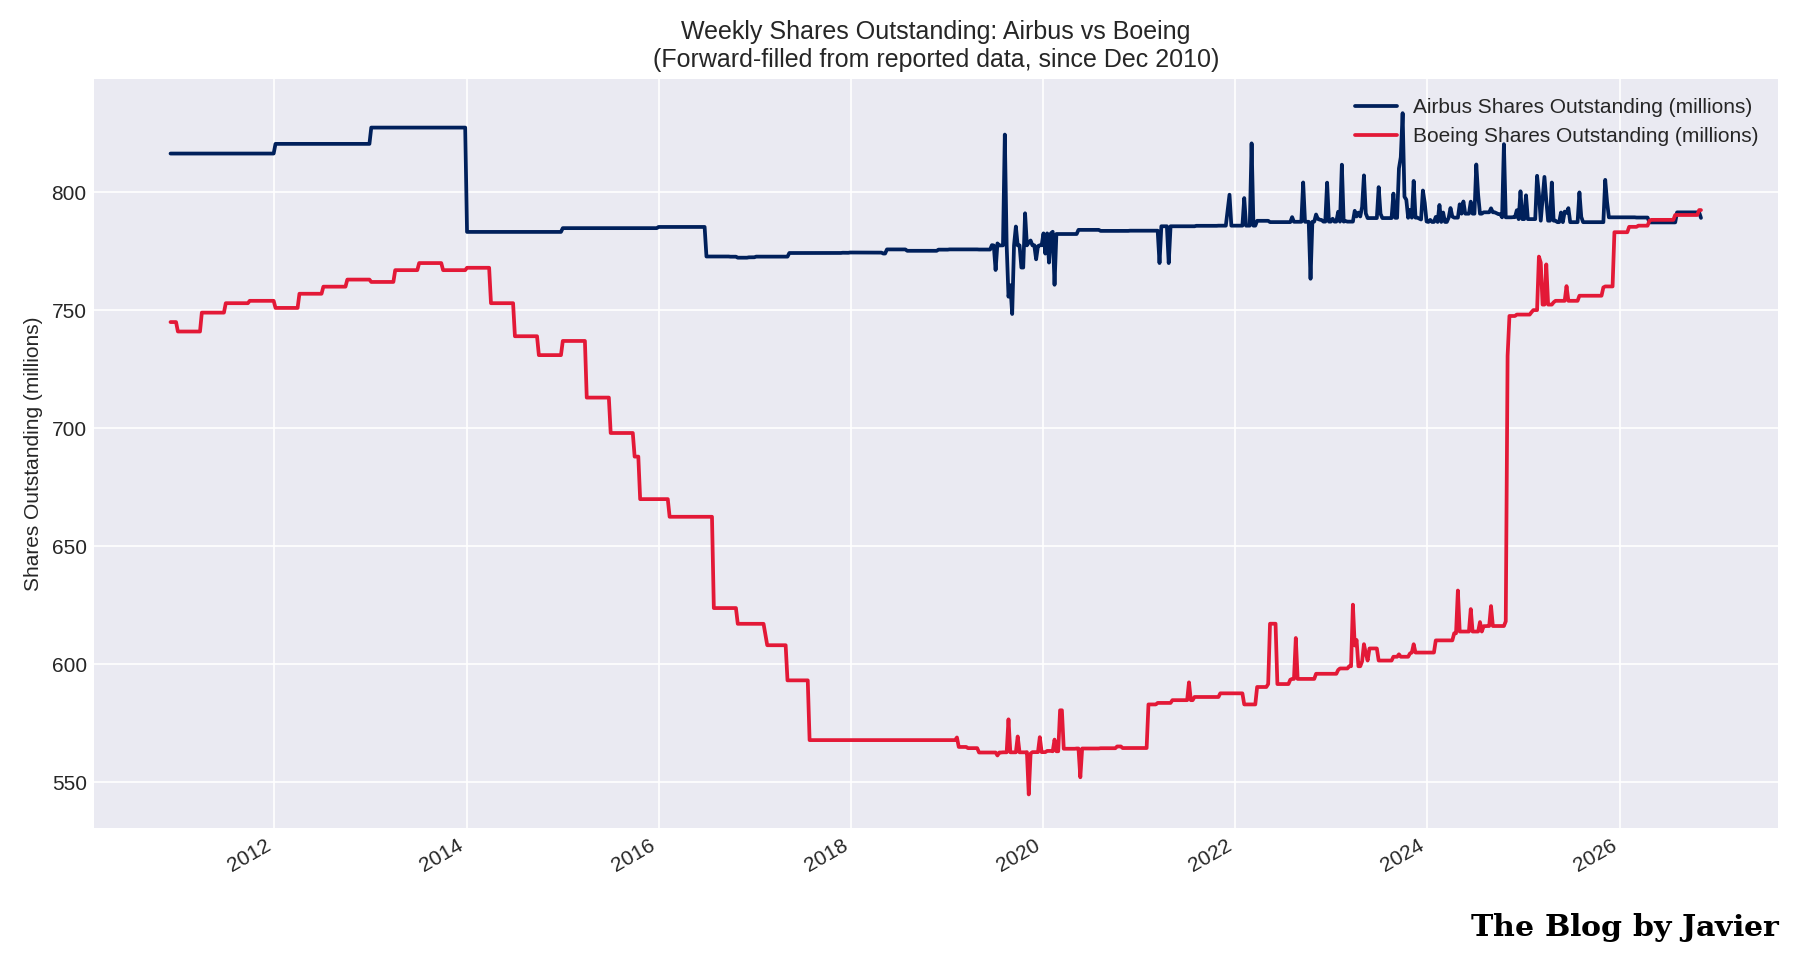
Shares outstanding
Two opposite stories.
Airbus kept its share count roughly flat: ~816 million in late 2010, ~791 million today.
Boeing went from ~745 million down to ~545 million by November 2019 through share buybacks, and then back up to ~792 million after the capital raises of the last years. Boeing has today more shares outstanding than when the period started. More on this below.
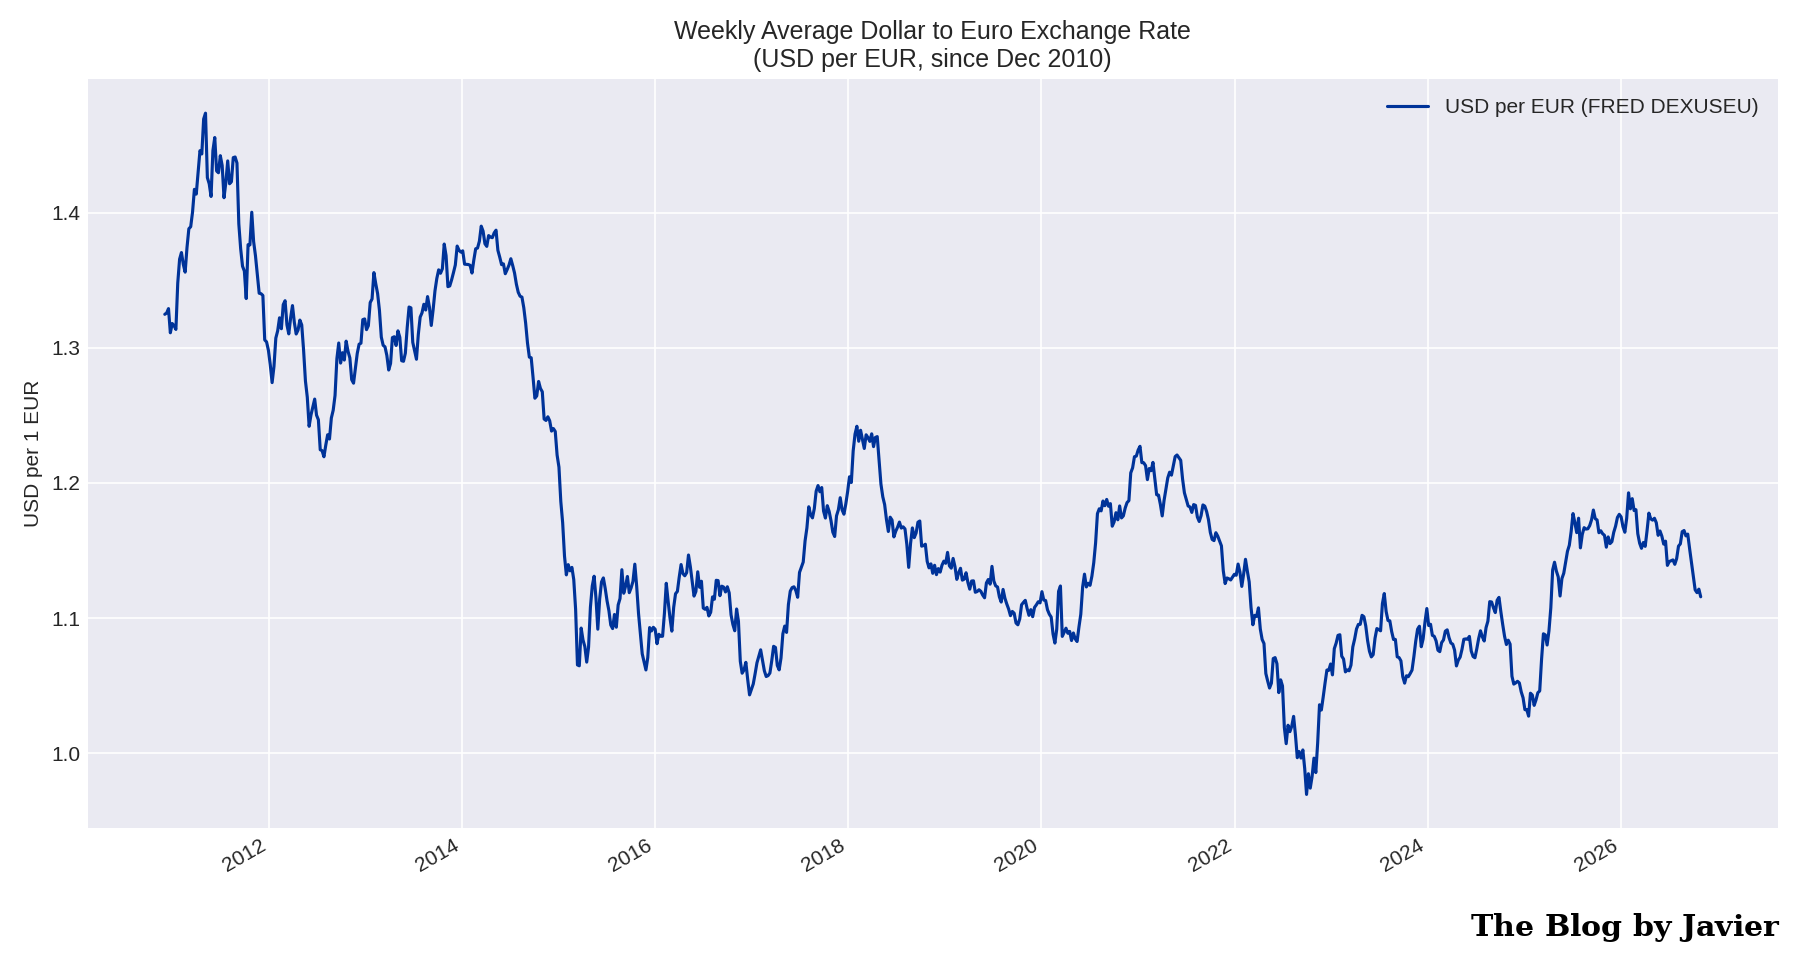
Dollar-euro exchange rate
The euro went from ~1.32 dollars in December 2010 to ~1.12 at the end of October 2026, with a dip below parity in 2022. As Airbus reports in euros, the weaker euro weighs on the comparison in dollars: at a constant 2010 exchange rate, Airbus’ market capitalization in dollars would be about 15% higher than shown.
Market capitalization in US dollars
This is the chart that puts it all together.
In early December 2010 Boeing’s market cap was ~$39bn versus ~$15bn for Airbus: Boeing was 2.6 times bigger.
Boeing peaked at ~$239bn in March 2019, weeks before the MAX grounding.
The first weekly close with Airbus above Boeing came in May 2022, and Airbus has been continuously ahead since late June 2026.
On 30 October 2026 Airbus stood at ~$171bn versus ~$138bn for Boeing, about 24% higher.
Averaged over the whole 16-year period Boeing was still the bigger company (~$113bn vs ~$75bn), which gives a sense of how large Boeing’s historical advantage was and how remarkable the reversal is.
Boeing share repurchases and dilution
As a final note of the 2024 post I left a link to a Leeham News and Analysis article with a contrarian view of Boeing’s stock buybacks. Its table of the 2013-2019 repurchase program is worth keeping here, now with the full historical context:
Year
Shares repurchased (millions)
Value ($bn)
2013
25.4
2.8
2014
46.6
6.0
2015
46.7
6.8
2016
55.1
7.0
2017
46.1
9.2
2018
26.1
9.0
2019
6.9
2.7
Total
252.9
43.5
The buybacks cut Boeing’s share count from ~745 million in 2010 to ~545 million by November 2019. Then came the 737 MAX grounding, the pandemic, the debt pile-up, and in October 2024, in the middle of a machinists’ strike, Boeing issued 129.4 million new shares at $143 (raising ~$18.2bn) plus $5bn of mandatory convertible preferred shares, as detailed in its SEC filings. The result: ~792 million shares outstanding today, more than before the buybacks began. The reduction that $43.5bn bought has been fully reversed, and then some.
Data sources
Stock prices: Yahoo Finance (AIR.PA and BA), daily closes averaged to Friday-ending weeks.
Shares outstanding: company-reported figures and yfinance, forward-filled to weekly frequency (approximate before ~2015).
Exchange rate: FRED DEXUSEU, US dollars to one euro, weekly average.
Last year I wrote an update of the all-time men’s marathon best times and the world record evolution (post here, following an older one from 2014, ahead of running that year’s Rotterdam marathon). This is a new update including 2026 best time as this has been an extraordinary year: the world record has been beaten and the two hours barrier has been broken in an official race for the first time in history. The 2026 version of the post includes all marathon times below 2h08′ up to and including today’s New York marathon.
As in the previous posts, I use the website “Track and Field all-time Performances” (maintained since years ago by Peter Larsson). As Larsson has not updated his marathon times list since mid August, this time I completed the dataset with World Athletics all-time toplists (which added 86 times from the races between late September and late October) and with today’s New York marathon results (from LetsRun, still provisional at the time of writing, as NYRR has not yet published the official ones).
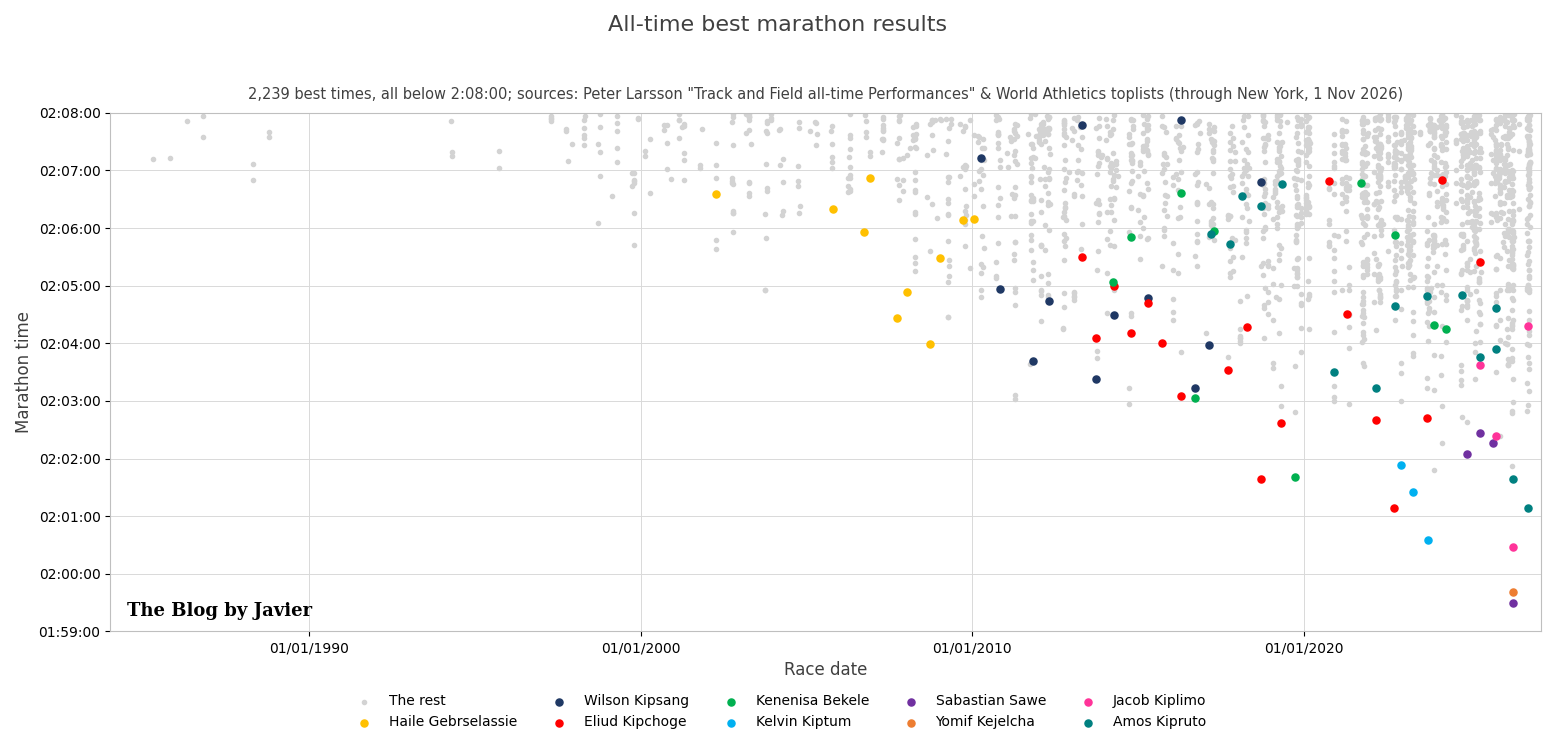
With the data of all-time best men’s marathon I plotted the chart below with the best 2,239 times, i.e., all those below 2h08′, and their dates, highlighting marathon times by Haile Gebrselassie, Wilson Kipsang, Eliud Kipchoge, Kenenisa Bekele, Kelvin Kiptum, Sabastian Sawe, Yomif Kejelcha, Jacob Kiplimo and Amos Kipruto.
Some stats in relation to those 2,239 times under 2h08′ (they were 1,903 when I reviewed them in September 2025; 249 of them have been achieved in 2026 alone, more than in any previous year!):
Countries of which athletes achieved most such times: Kenya 959 times or 42.8%, Ethiopia 666 times or 29.7%, Japan 138 (6.2%), Morocco 51 (2.3%), Eritrea 51 (2.3%), USA 34 (1.5%), Uganda 27 (1.2%), Spain 27 (1.2%), Israel 26 (1.2%). Those are the top 9 countries, there are another 35 from which athletes have run below 2h08′ (for a total of 44 countries).
There are 872 athletes that have run below 2h08′. The individuals who have done so more often: Eliud Kipchoge 18 times (he still runs marathons, he even won the Melbourne marathon 3 weeks ago in 2h09 at 41 years old!), Sisay Lemma 17, Tamirat Tola 16, Amos Kipruto 15, Tsegay Kebede 15, Benson Kipruto 14, Abel Kirui 13, Evans Chebet 12, Wilson Kipsang 12, Geoffrey Kamworor 12, Bernard Kiprop 12, Birhanu Legese 11, … Kenenisa Bekele 10, Haile Gebrselassie 10…
Now, if we raise the bar to see the times at or below 2h05′, we find 301 times (they were 231 a year ago):
Countries of which athletes achieved most such times: Kenya 135 times or 44.9%, Ethiopia 121 times or 40.2% (both combined 85.1%!), Uganda 7 (2.3%), Tanzania 7 (2.3%), Belgium 5 (1.7%), Germany 5 (1.7%). Those are the top 6 countries, there are another 15 from which athletes have run at or below 2h05′ (for a total of 21 countries, 5 more than last year).
There are 154 athletes that have run at or below 2h05′ (30 more than last year). The individuals who have done so more often: Eliud Kipchoge 14 times, Amos Kipruto 10, Tamirat Tola 10, Wilson Kipsang 8, Sisay Lemma 7, Birhanu Legese 6, Gabriel Geay 5, Alexander Mutiso 5, Leul Gebrselassie 5, Sabastian Sawe 4, Kenenisa Bekele 4, and several other athletes with 4, and with 3 times including Kelvin Kiptum, Dennis Kimetto, Geoffrey Mutai and Haile Gebrselassie.
Which are the fastest marathons? The cities where most of those 301 times at or below 2h05′ have been achieved are: Berlin 41, Valencia 39, London 33, Amsterdam 28, Dubai 27, Chicago 24, Rotterdam 22, Tokyo 21. Those are the top 8 cities (accounting for 78% of those 301 times), there are other 17 cities where such fast times have been achieved.
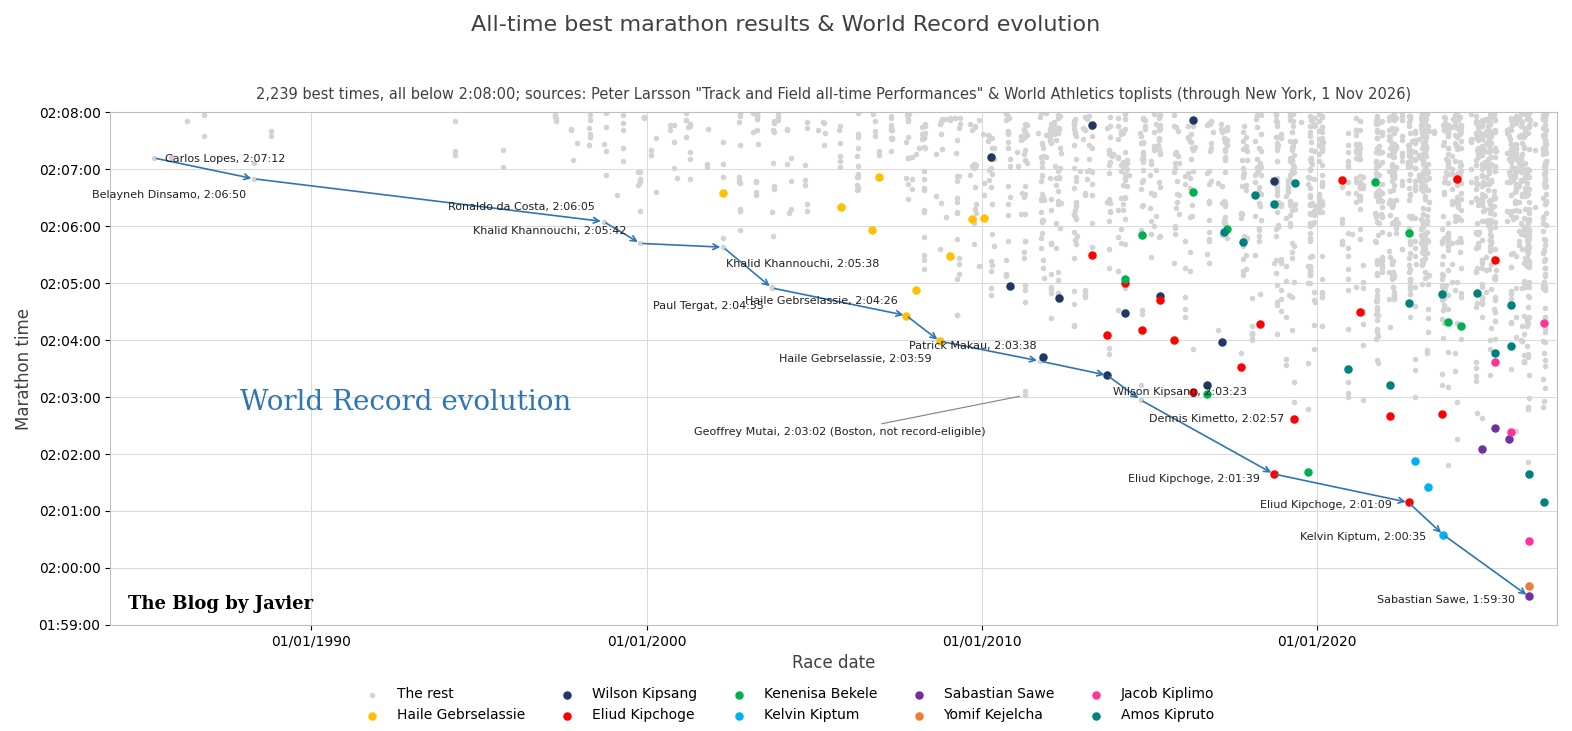
Now let’s look at the evolution of the World Record since 1985 in this other chart:
Some comments to the chart:
In the last 41 years, the record has been beaten 14 times.
The current world record was set by Sabastian Sawe in London on 26 April 2026 with 1h59’30”, at the age of 31. It is the first official time below 2 hours and it was ratified by World Athletics in July (Eliud Kipchoge had run 1:59:41 in Vienna in 2019, but that exhibition, with rotating pacemakers, was not record-eligible).
That London race was historic beyond the record: Yomif Kejelcha (1h59’41”) and Jacob Kiplimo (2h00’28”) also finished under the previous world record, with Amos Kipruto 4th in 2h01’39”, Tamirat Tola 5th in 2h02’59” and Deresa Geleta 6th in 2h03’23”.
Sawe took 1’05” off Kiptum’s record, which had lasted two years and a half. The biggest improvement of the record was still made by Eliud Kipchoge, who took 1’18” off Dennis Kimetto’s previous record in 2018.
The record that lasted the most was Dinsamo’s 2:06:50 in 1988, which took just over 10 years to be beaten by Ronaldo da Costa in 1998.
3 athletes have set the world record twice: Khalid Khannouchi, Haile Gebrselassie and Eliud Kipchoge.
Geoffrey Mutai ran in 2h03’02” in Boston 2011 and this year John Kipkosgei won Boston in 2h01’52”; as Boston is a downhill point-to-point course, those times do not count for the record.
In the same day in London, Tigst Assefa set a women-only world record of 2h15’41” (improving her own mark from 2025), with Hellen Obiri (2h15’53”) and Joyciline Jepkosgei (2h15’55”) completing the first race ever with 3 women below 2h16′ (see World Athletics report and London Marathon).
Other remarkable marathon facts from 2026:
Amos Kipruto won Chicago in 2h01’09”, equalling to the second the world record that Kipchoge had set in Berlin 2022.
Guye Adola won Berlin in 2h02’50”, and Tamirat Tola won Beijing in 2h03’10”.
Eliud Kipchoge, close to turning 42, ran won Melbourne two weeks ago.
Today in New York, Andreas Almgren (the reigning world half marathon champion) won in his marathon debut with 2h06’01”; 13 men ran below 2h08′.
What is the best age to run marathons?
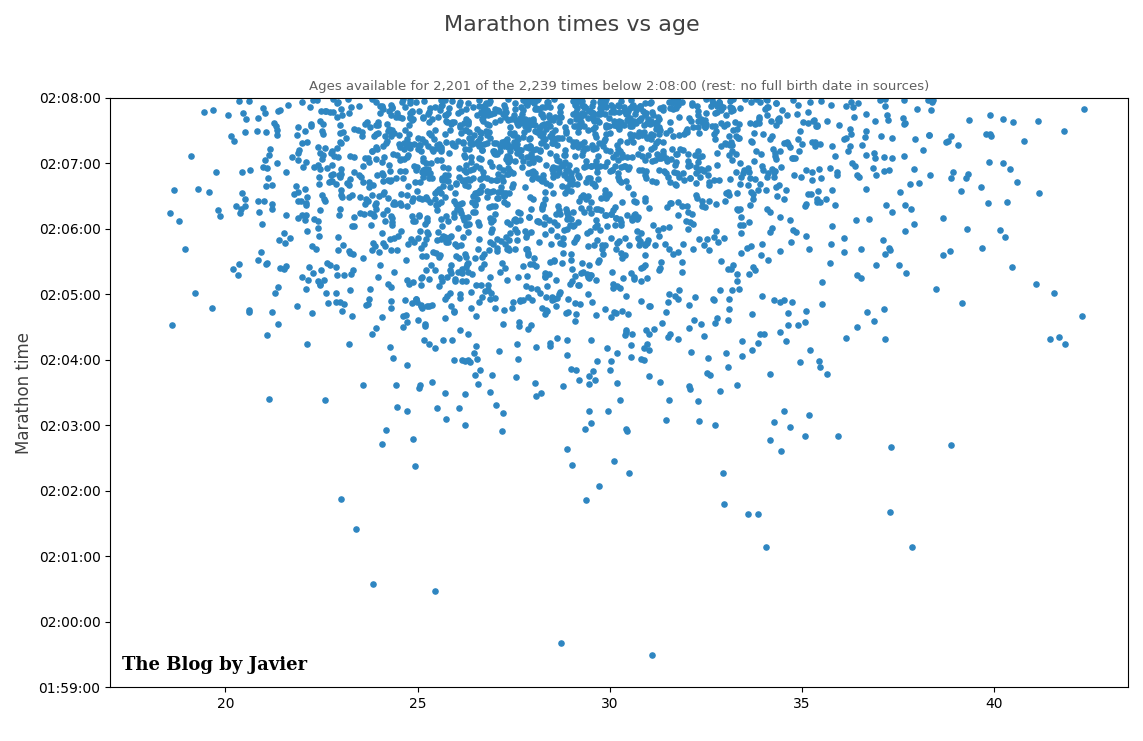
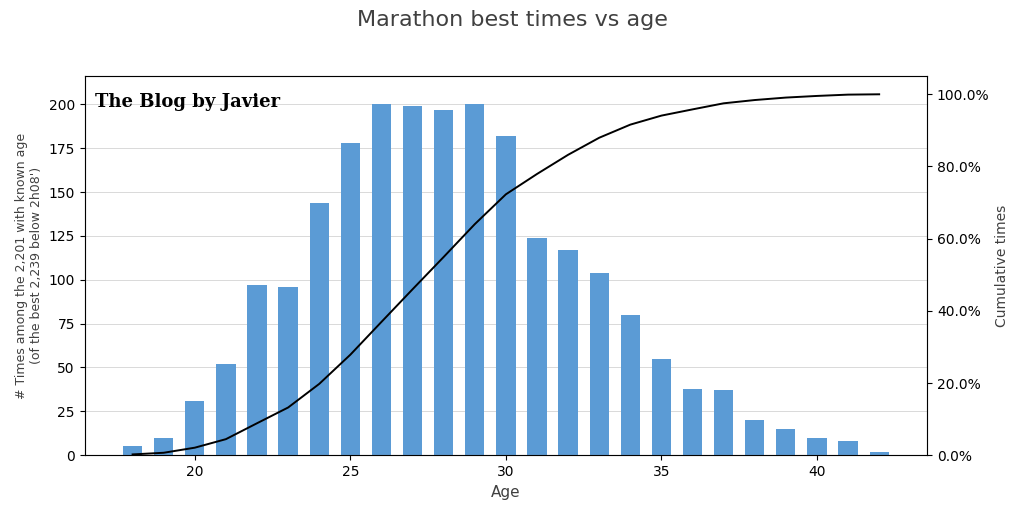
I plotted this other chart looking at the best 2,239 marathon times vs the age the runners had at the time of completing each of those races (for the 2,201 of them for which the sources include the full birth date).
Most of the times below 2h08′ are achieved between 23 and 33 years old, and the very best ones are spread between 25 and 37, with the exceptions of the 3 marathons ran by Kelvin Kiptum, including his former world record at 23.9, Tadese Takele (2h03’24” at 21.1) and the 2h00’28” by Jacob Kiplimo at 25.4. Sawe’s world record, on the contrary, was set at 31.1. The youngest ever to run such a fast marathon was Tsegaye Mekonnen: 2h04’32” in Dubai 2014 at 18.6.
Another interesting chart to relate best times and age is the histogram below. In that one we can see that effectively most of the times below 2h08′ are achieved between 24 and 30 years old, and between 23 and 33 (both included) 79% of those times are achieved.
Let’s see what Valencia brings in December with Yomif Kejelcha and John Korir on the roster.
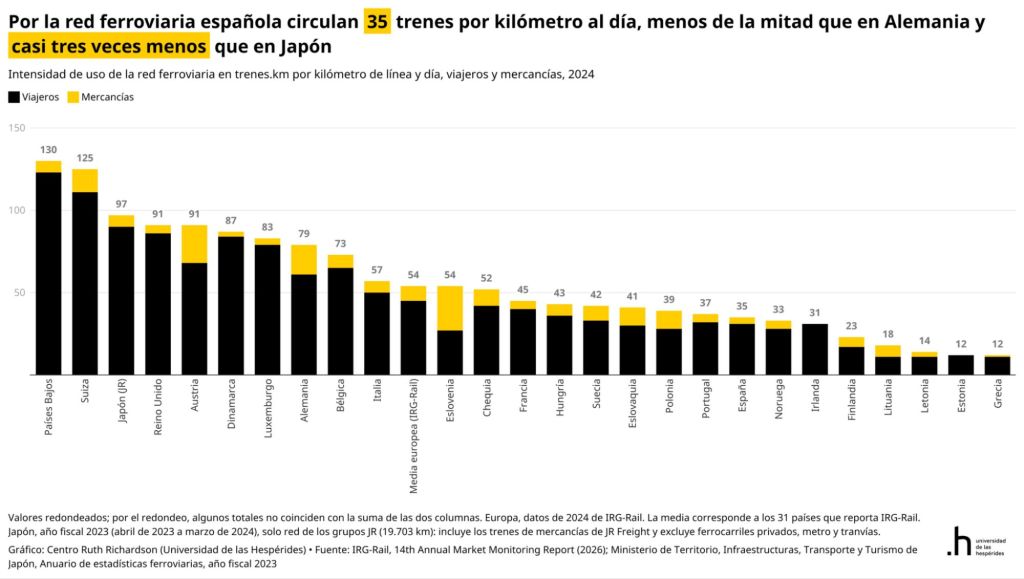
En estos días siguientes al terrible siniestro entre dos trenes de alta velocidad en Urda, varios opinadores señalaron a la liberalización del ferrocarril como una de las causas originarias debido al mayor uso de las vías, que haría más complicado su mantenimiento. Para rebatir esa línea argumental, en la red social X / Twitter, el profesor de la Universidad de las Hespérides Santiago Calvo publicó esta gráfica que muestra el todavía discreto uso de las vías de ferrocarril en España:
Pero esa discusión pública y otros comentarios, me sugirieron las siguientes preguntas: ¿Cómo de liberalizado está el sector del ferrocarril? ¿Cómo se compara con la aviación? ¿Cuánto dinero del contribuyente reciben unos y otros? ¿Qué incentivos hay?
Con la ayuda de los agentes de inteligencia artificial Grok e Instinct he preparado este post para ver algunos números que den respuesta a esas preguntas.
¿Cuánto dinero público reciben las grandes empresas públicas del transporte en España?Adif, Adif Alta Velocidad, Renfe, ENAIRE y Aena, de dónde vienen sus ingresos, cuáles ganan dinero y cuáles lo pierden. La respuesta, una vez vistos los datos de 2025, resulta incómoda para los defensores de la gestión pública: el ferrocarril se sostiene con miles de millones de euros de los contribuyentes cada año, mientras el sector aéreo se autofinancia por completo e incluso devuelve beneficios y dividendos al Estado. Lo público frente al mercado.
Quién es quién: propiedad y estructura
Las cinco empresas son públicas o de mayoría pública, pero con modelos muy distintos. Adif y Adif AV (Alta Velocidad) son entidades públicas empresariales del Ministerio de Transportes; Renfe y ENAIRE, sociedades mercantiles estatales; y Aena cotiza en Bolsa desde 2015, aunque el Estado conserva el 51 % a través de ENAIRE:
Del 49 % de Aena que está en manos privadas, los principales accionistas declarados hoy son el fondo activista TCI (The Children’s Investment Fund), con en torno al 6 % del capital total y BlackRock, que superó el 4 % en julio de 2025; el resto es free float repartido entre inversores institucionales y minoristas sin participaciones significativas declaradas. Los porcentajes son sobre el capital total (no sobre el 49 %) y corresponden a las últimas declaraciones de participaciones significativas a la CNMV recogidas en prensa en 2025.
Empresa
Actividad
Propiedad
Resultado 2025
Adif
Red ferroviaria convencional
100 % Estatal
Pérdidas: 83 M€
Adif Alta Velocidad
Red de alta velocidad
100 % Estatal
Pérdidas: 193 M€
Renfe
Trenes de viajeros y mercancías
100 % Estatal
Beneficio: 60 M€
ENAIRE
Navegación aérea
100 % Estatal
Beneficio: 888 M€
Aena
Aeropuertos
51 % Estado (ENAIRE); 49 % en Bolsa (TCI ~6 % y BlackRock >4 % del capital; resto, free float)
Beneficio: 2.137 M€
¿E Iberia? La aerolínea de bandera dejó de ser pública hace 25 años: la privatización se decidió en 1997, en 1999 entraron socios industriales (British Airways entre ellos) y en abril de 2001 salió a Bolsa a 1,19 euros por acción. En 2011 se fusionó con British Airways para crear el grupo IAG (International Airlines Group) cuyo mayor accionista es hoy Qatar Airways, con un 25,1 %. Curiosamente, para preservar la nacionalidad española de Iberia (y sus derechos de tráfico), el 50,1 % de los derechos de voto de la aerolínea está en manos de Garanair, sociedad vinculada a El Corte Inglés. Iberia da beneficios y recibe regularmente premios por su puntualidad.
El ferrocarril: sostenido con miles de millones del presupuesto
El grueso de los ingresos del ferrocarril tienen como origen el bolsillo del contribuyente, por dos vías:
1. Los convenios con Adif y Adif AV. En julio de 2021 el Ministerio de Transportes firmó sendos convenios de sostenibilidad por los que ambas entidades percibirían 12.764 millones de euros entre 2021 y 2025: 8.747 millones para Adif (de ellos 2.539 de fondos europeos Next Generation) y 4.017 millones para Adif AV (2.154 de Next Generation). En la práctica, y según los datos de las cuentas anuales de 2025 depositadas en el Registro de la Intervención General de la Administración del Estado (cifras aún pendientes de contraste con las cuentas oficiales definitivas), solo en 2025 Adif recibió 2.468 millones de euros de dinero público (259 de subvenciones de explotación y el resto de capital para inversiones y aportaciones del accionista) frente a 633 millones que ingresó por su actividad; Adif AV recibió 1.257 millones frente a 789 millones de ingresos por cánones. Ambas pierden dinero: Adif cerró 2025 con 83 millones de pérdidas (el beneficio de 384 millones de 2024 vino de la venta de los terrenos de Madrid Nuevo Norte) y Adif AV con 193 millones, casi el doble que el año anterior, lastrada por una deuda de unos 18.300 millones que, tarde o temprano, pagarán entre todos los contribuyentes. Ninguna empresa privada podría operar así durante años sin que nadie responda por ello; en el sector público, en cambio, el agujero se cubre con el siguiente convenio.
2. Las compensaciones a Renfe por el servicio público.Cercanías, Media Distancia y Avant no se cubren con la venta de billetes: en 2025 esos servicios vendieron títulos por 532 millones y el déficit se paga con compensaciones de las administraciones. En total, Renfe contabilizó en 2025 1.851 millones de euros en subvenciones de explotación, que incluyen las compensaciones por las Obligaciones de Servicio Público del Estado y de la Generalitat de Cataluña y las bonificaciones de los abonos gratuitos. Gracias a ello, el grupo volvió a beneficios en 2025 por primera vez desde 2019: ganó 60,2 millones con unos ingresos totales de 4.480 millones, gracias sobre todo a los servicios comerciales de alta velocidad y larga distancia. El contrato-programa con el Estado sigue vigente hasta 2027, con compensaciones máximas de unos 916 millones al año.
El avión: un modelo que se autofinancia
La aviación funciona justo al revés: no vive del presupuesto, sino que aporta dinero al Estado. Y esto es porque hay una mayor liberalización, con multitud de empresas en competencia, lo que cambia por completo los incentivos: cuando una empresa (incluidas las públicas) se financia con lo que pagan sus usuarios, gestiona bien; cuando se financia con lo que paga el contribuyente, no tiene por qué hacerlo.
Aena se financia con las tasas aeroportuarias que pagan las aerolíneas y con sus ingresos comerciales (tiendas, restauración, aparcamientos). En 2025 ingresó 6.379 millones de euros y ganó 2.137 millones, un 10,5 % más que en 2024, con un EBITDA de 3.785 millones. Sus grandes inversiones (el plan DORA) salen del propio sistema aeroportuario, no de los Presupuestos Generales del Estado. Además, como el Estado conserva el 51 % a través de ENAIRE, la mayor parte de sus crecientes dividendos vuelven al Tesoro. No es casualidad que la gran empresa pública de transporte que funciona sea justo la que tiene un 49 % de capital privado en Bolsa que vigila sus cuentas cada trimestre. Sus subvenciones de explotación de 2025 fueron de 0,5 millones de euros; eso sí, conserva en balance 241,8 millones netos de subvenciones de capital concedidas históricamente, de las que imputa a resultados unos 25 millones al año.
ENAIRE, el gestor de navegación aérea, cobra tasas de ruta a las aerolíneas que cruzan el espacio aéreo español: 1.015 millones de euros en 2025, en torno al 85 % de sus ingresos. Es rentable: ganó 887,5 millones en 2025, de los que 737 vienen del dividendo de Aena, que acaba así en las cuentas públicas. Y apenas recibe dinero del Estado: 13 millones de subvenciones cobradas en 2025 (33,3 en 2024), principalmente fondos europeos MRR para modernización.
Las aerolíneas: el mercado que sí tiene competencia
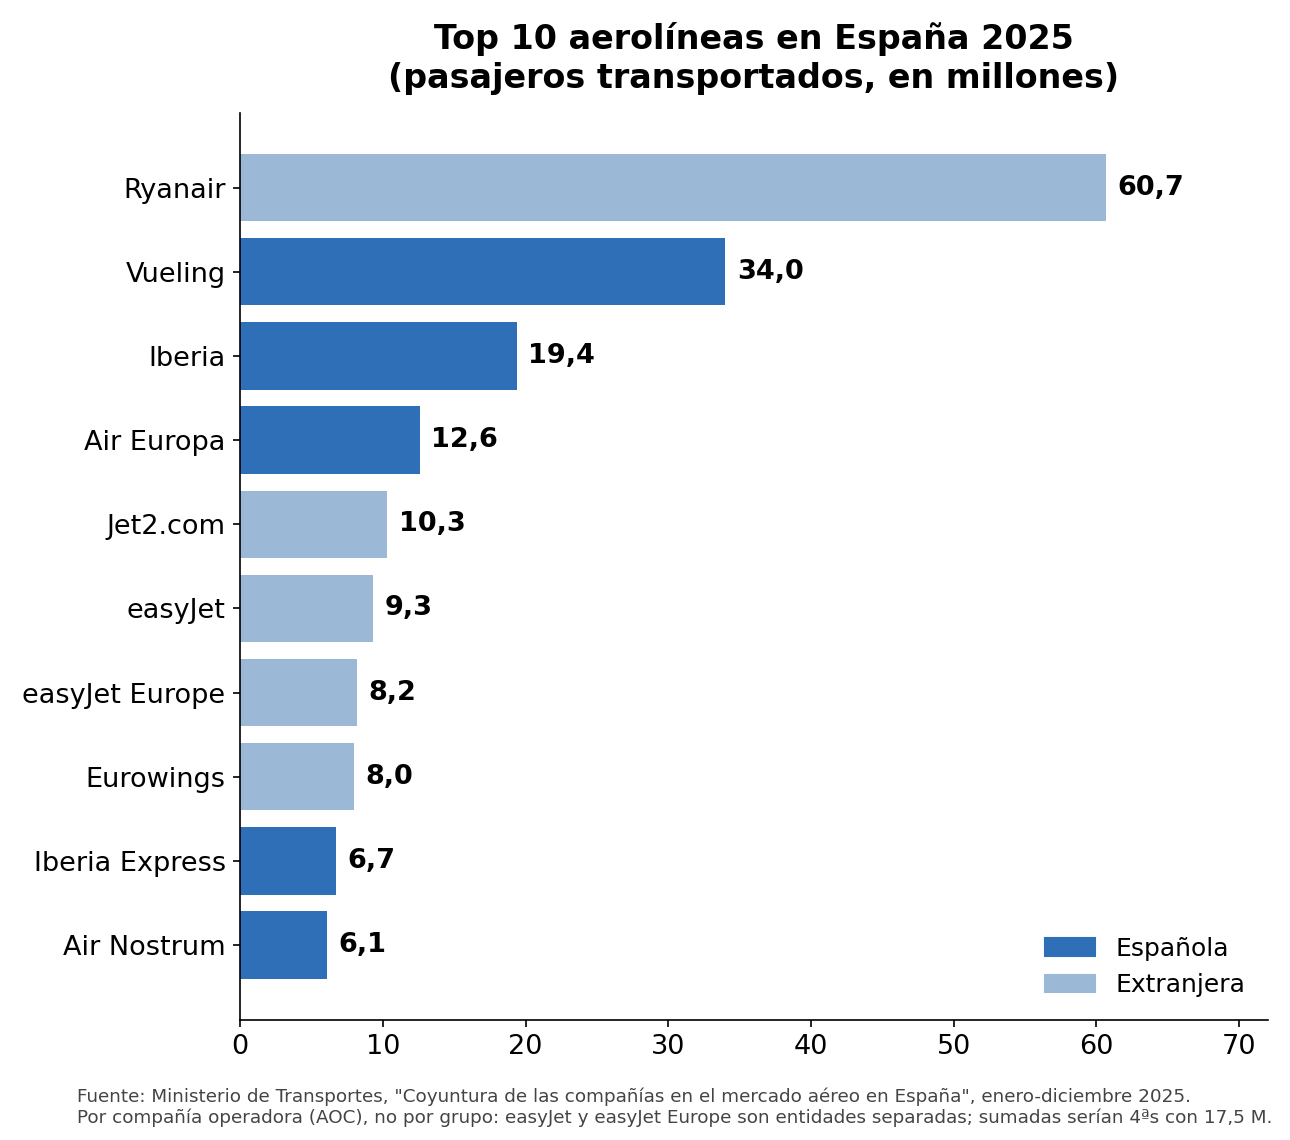
Si el tren de alta velocidad tiene tres operadores (con sólo dos privados no pertenecientes al Estado español, Iryo (51% estado italiano, 25% Air Nostrum) y Ouigo (100% perteneciente a SNCF, ferrocarril estatal francés)), el cielo español es justo lo contrario: 180 aerolíneas operaron en el mercado español entre enero y diciembre de 2025, según la coyuntura del Ministerio de Transportes, y movieron 272 millones de pasajeros en vuelos comerciales (regulares y chárter; se cuentan las compañías con más de 1.000 pasajeros al año). Sólo 17 eran españolas, y transportaron 90,9 millones (el 33 % del total, un punto menos que en 2024); las 73 extranjeras comunitarias movieron 130 millones (el 48 %) y las 90 extracomunitarias, 51 millones (el 19 %).
Las diez aerolíneas con más pasajeros en el mercado español en 2025, por compañía operadora (no por grupo). Fuente: Ministerio de Transportes.
Las cinco primeras concentran la mitad del mercado: Ryanair lidera con 60,7 millones de pasajeros (+5,9 %), seguida de Vueling (34,0), Iberia (19,4), Air Europa (12,6) y Jet2.com (10,3). El ranking va por compañía operadora, no por grupo: easyJet y easyJet Europe aparecen por separado (sumadas serían cuartas, con 17,5 millones), igual que Iberia, Iberia Express y Air Nostrum forman parte del mismo grupo, IAG. La mitad de la tabla es española —Vueling, Iberia, Air Europa, Iberia Express y Air Nostrum— pero el líder destacado es irlandés. Es lo que tiene un mercado abierto y competitivo: precios bajos, récord de viajeros y empresas que se financian con lo que pagan sus clientes, no con el presupuesto.
Las ayudas del COVID: ¿se han devuelto?
Alguno podría argumentar “las aerolíneas también recibieron dinero durante la crisis del COVID” (cuando fueron impactadas por las prohibiciones y restricciones al transporte aéreo).
Durante la pandemia el Estado creó el fondo FASEE (Fondo de Apoyo a la Solvencia de Empresas Estratégicas, gestionado por la SEPI), que prestó 2.681 millones a empresas estratégicas, sobre todo aerolíneas privadas. Eran préstamos, no subvenciones, y se están devolviendo: Air Europa acaba de amortizar sus 475 millones (casi 500 con intereses) un año antes de lo previsto, y en total el fondo ya ha recuperado 1.425 millones, el 53 % de lo prestado.
Iberia y Vueling ni siquiera recibieron fondos del Estado, sino que suscribieron una serie de préstamos con distintos bancos privados (Santander, CaixaBank, Bankia, Bankinter, BBVA…) por valor de 1,010 millones de euros con aval del ICO (Instituto de Crédito Oficial). Esos préstamos se podían ir devolviendo hasta 2026, pero fueron amortizados en 2023, tres años antes de lo previsto.
Distinto es el caso de los fondos europeos Next Generation: son subvenciones a fondo perdido para inversiones, no hay nada que devolver, y sus principales receptores en el sector son precisamente Adif y Adif AV, con unos 4.700 millones previstos dentro de sus convenios.
La diferencia de fondo es elocuente: a las aerolíneas privadas se les prestó dinero que deben devolver, y lo están devolviendo; al ferrocarril público se le transfiere a fondo perdido, año tras año, sin fecha de caducidad ni obligación de rendir cuentas comparables. (La Fiscalía Europea investiga los fondos Next Gen)
Ferrocarril vs aviación, en tres métricas
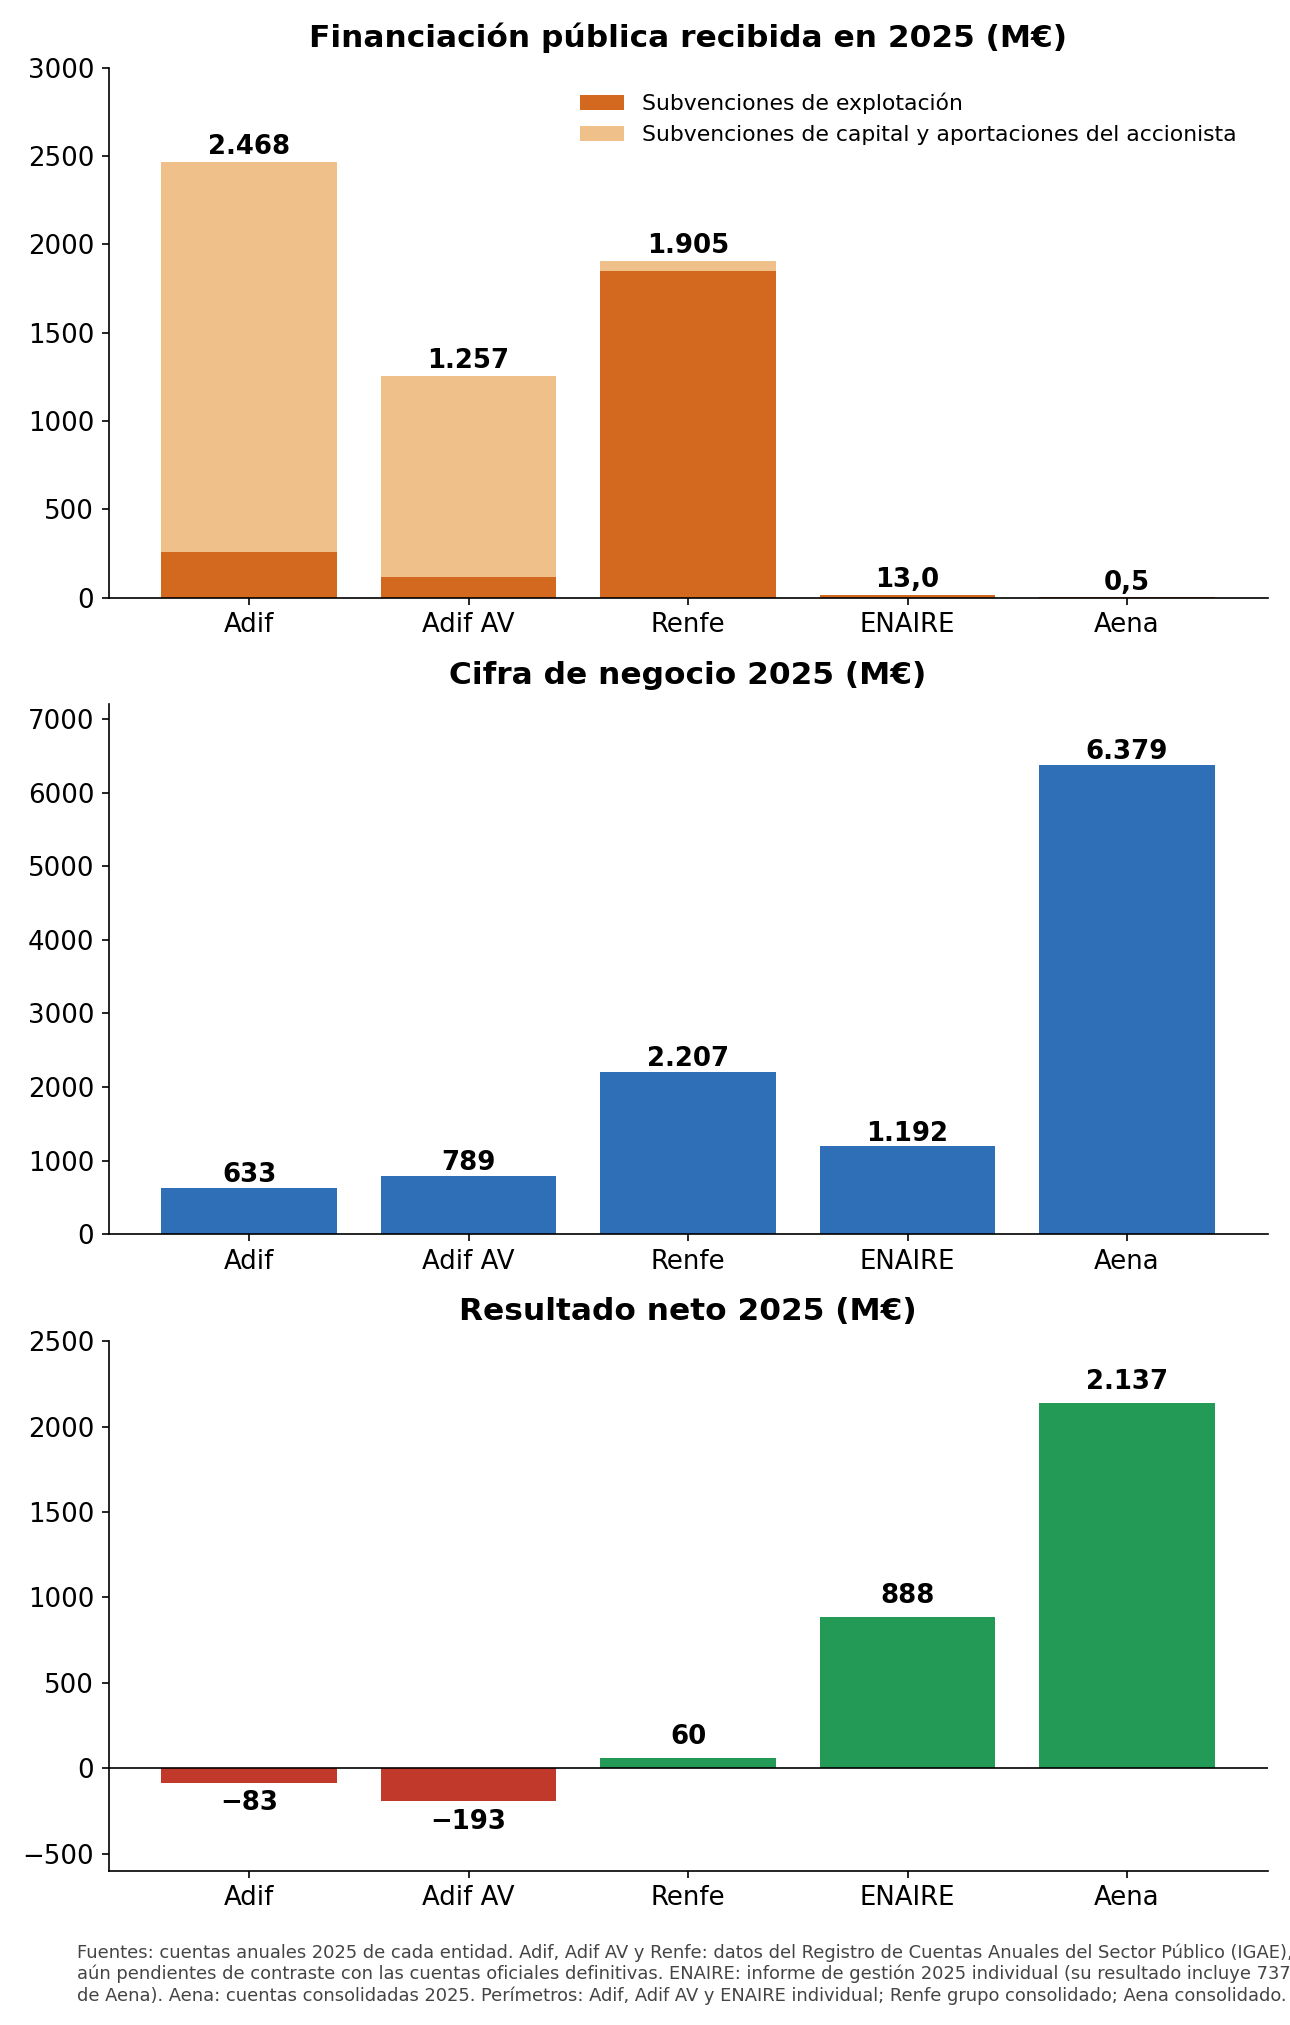
Pedí a Instinct elaborar una gráfica con la proporción de ingresos “públicos” y “privados” de cada empresa, pero ese desglose no existe de forma comparable en sus cuentas: Adif no separa qué parte de sus cánones paga Renfe (pública) u Ouigo o iryo (privadas), Aena no distingue clientes públicos de privados, e “ingreso propio” no equivale a “ingreso privado” (las tasas de Aena y ENAIRE son cargas reguladas que fija la Administración, no precios de mercado puros). Lo que las cinco sí publican con criterios razonablemente parecidos (aunque no idénticos: unas son cuentas individuales y otras consolidadas, como indica el pie) es cuánto dinero público reciben al año, cuánto venden y cuánto ganan o pierden:
Financiación pública, ventas y resultado en 2025, en millones de euros. Las cifras ferroviarias del registro IGAE están pendientes de contraste oficial. Fuentes y perímetros en el pie de la imagen y en la sección de fuentes.
Tres lecturas:
Primera: la financiación pública se concentra en el ferrocarril; Adif, Adif AV y Renfe recibieron juntas unos 5.600 millones en 2025 (suma de tres transferencias estatales distintas, según los datos del registro aún pendientes de contraste oficial), mientras Aena y ENAIRE apenas registran subvenciones.
Segunda: la cifra de negocio aéreo supera con mucho a la del ferroviario.
Tercera: los resultados cierran el círculo; Aena y ENAIRE ganan dinero mientras Adif y Adif AV pierden 83 y 193 millones respectivamente.
En Adif y Adif AV la mayor parte del dinero público son subvenciones de capital que financian obras de la red, no gasto corriente; en AENA las obras en infraestructuras las paga el propio negocio. El tren es deficitario porque el legislador decidió que Cercanías y Media Distancia se presten como servicio público a precios que no cubren sus costes, igual que decidió que aeropuertos y navegación aérea se paguen con tasas a los usuarios. Las cifras exactas, con su documento y perímetro, están en las fuentes.
Ahora bien, mi lectura es la contraria a la conclusión de algunos opinadores: si hubiera más liberalización y no menos, las empresas (incluidas las públicas) del sector estarían mejor gestionadas y el sector florecería. Que el Estado decida financiar el ferrocarril es una mala idea pero legítima; lo que no lo es es que lo haga sin exigirle ni la disciplina ni la transparencia que el mercado impone al aéreo. Aena rinde cuentas cada trimestre ante accionistas privados y gana 2.137 millones; Adif AV acumula 18.300 millones de deuda sin que nadie responda por ella. Donde el AVE tiene competencia (Ouigo, iryo), el viajero ha ganado opciones y Renfe ha tenido que espabilar (y aún así compárese con la competencia del sector aéreo, incluido cómo compañías como Wizz y Ryanair acuden al rescate para conectar Madrid con Andalucía cuando se interrumpe el servicio ferroviario); donde no la hay, el contribuyente paga y calla. La pregunta que deberíamos hacernos no es cuánto más dinero público necesita el tren, sino por qué seguimos pagándolo sin exigirle las mismas reglas del juego que hacen viable al avión.
Cuentas anuales 2025 de Adif y Adif AV: datos del Registro de Cuentas Anuales del Sector Público (IGAE), recopilados con sus ficheros XBRL por carreterasyhospitales.com (cifras provisionales, pendientes de contraste con las cuentas oficiales definitivas) (Adif, Adif AV); portales oficiales de transparencia de Adif y Adif AV
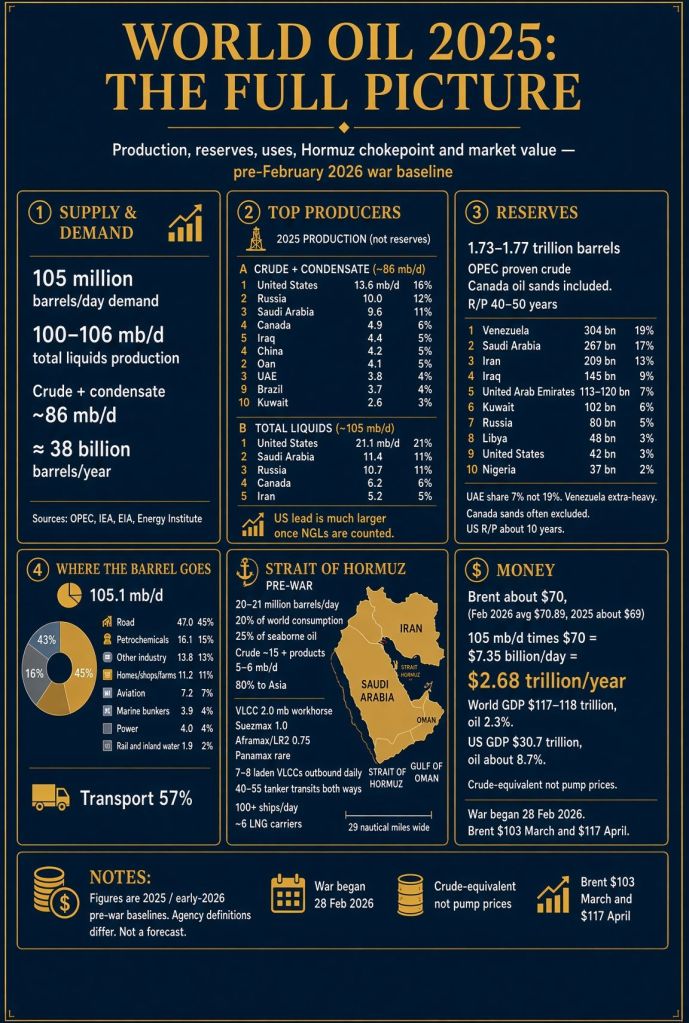
This is a quick post to share this infographic summarizing some data of the oil industry.
A bit of context. A few months ago I listened to a podcast on the Hormuz strait and the oil crisis by the Spanish journalist Fernando Díaz Villanueva in which he shared some figures of the industry that I found interesting. However, weeks later I could only remember some of those figures. I used Grok (Twitter/X artificial intelligence assistance) to refresh my memory through a series of questions and then asked Grok to prepare an infographic summarizing some data of the oil industry so I could have it as a reference for the future.
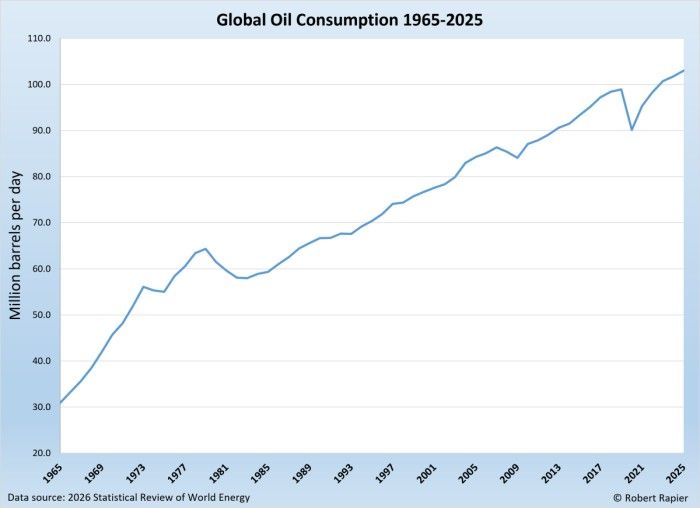
Global oil supply and demand in 2025 sat near 103–106 million barrels per day (mb/d), depending on definition. Agencies differ on whether they count only crude plus condensate, or a broader “total liquids” basket that includes natural gas liquids (NGLs), some other petroleum liquids, and sometimes biofuels and refinery processing gains. (source)
Top producers in 2025. Two common rankings are used. Crude + condensate is the narrow “oil well” measure. Total liquids adds NGLs (especially large in the U.S. shale system) and is closer to what many “oil production” headlines use.
Crude oil + lease condensate (global total ≈ 85.8 mb/d).
Total liquids (global total ≈ 100.4–100.6 mb/d in Energy Institute / Eni-style series; higher in IEA/EIA “petroleum and other liquids”).
The U.S. lead is much larger on total liquids because of NGL output from gas and shale. In that definition the U.S. produced nearly twice as much as Saudi Arabia.
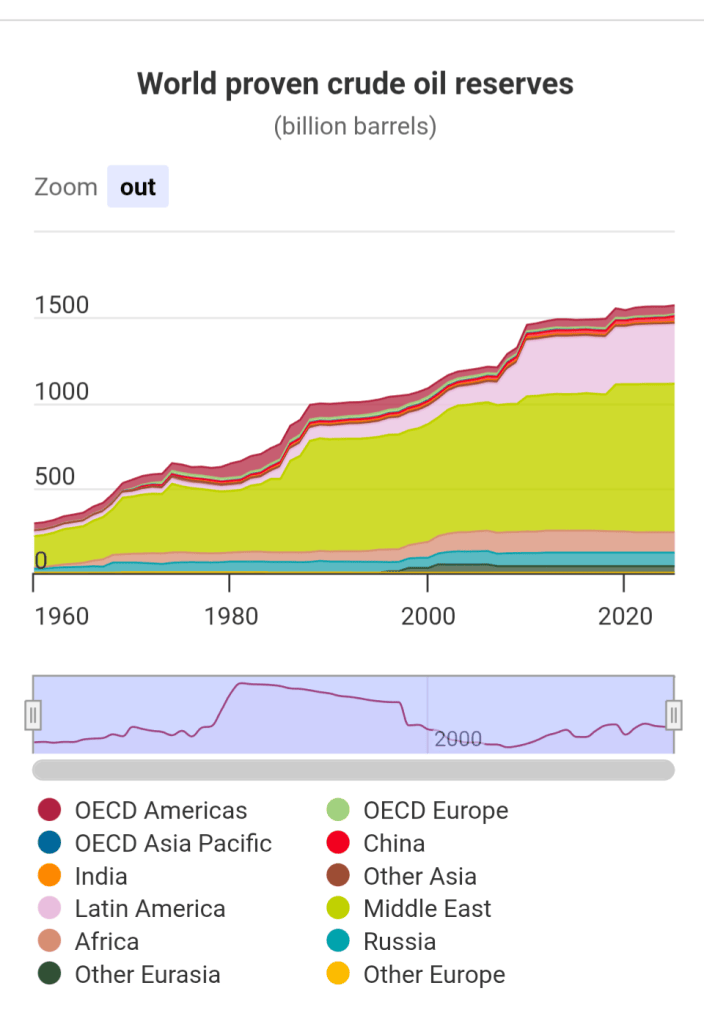
Proven oil reserves are about 1.57–1.77 trillion barrels, depending on whether Canadian oil sands and some NGLs/condensate are counted. That is roughly 40–50 years of current production, or about 45–47 years of current consumption — but those “years left” numbers are only a simple reserve-to-production (R/P) ratio, not a forecast.
OPEC members hold about 1,243 billion barrels, or ~79% of OPEC’s world crude-reserve total. The Middle East alone is about 55–56% of that OPEC world total. (source)
“Proven” means commercially recoverable under today’s prices and technology, not all oil in the ground.
Venezuela + Saudi Arabia + Iran already hold about half of OPEC’s booked world crude reserves. (source)
Looking at the consumption road transportation takes a clear lead with 45%, followed by the petro chemical industry, other industries, homes. Aviation consumes about 7% of the annual output. (source)
Before the February 2026 war, about 20–21 million barrels per day of oil moved through the Strait of Hormuz — roughly 20% of world oil consumption and about a quarter of all seaborne oil trade. (source)
How was that transported? Long-haul Gulf crude to Asia is a VLCC (Very Large Crude Carrier) trade. Suezmax and especially Panamax are secondary.
How many ships went through the strait per day?
Pre-war snapshots:
S&P Global: ~135 vessels/day through the strait in February 2026, of which ~54 oil, chemical and LPG tankers and ~6 LNG carriers.
Oxford Institute / Kpler: ~50 liquid-cargo crossings a day (both ways) just before 28 February 2026.
A simple cargo check matches the VLCC-heavy picture:
15 mb/d of crude ÷ ~2 mb per VLCC ≈ 7–8 laden VLCCs leaving the Gulf each day
Roughly the same number coming back empty → ~15 VLCC transits/day
5–6 mb/d of products on Suezmax / Aframax / LR / MR ships (0.3–1.0 mb each) → on the order of 8–15 product-tanker sailings outbound, plus ballast returns
Plus a handful of Suezmax crude cargoes that are not VLCC-sized
Daily and annual dollar value of the oil barrel. Using 105 million barrels/day of consumption (OPEC 2025) and a $70 pre-war Brent marker — close to February 2026 and a fair “eve of war” price, gives about $7.0–7.5 billion a day, ~$2.7 trillion per year or ~2.3% of world GDP (that is the value of the commodity flow, not oil’s share of value added).
Time to look back and reflect on how the year which is about to end developed. Brief recap of my 2025. (*)
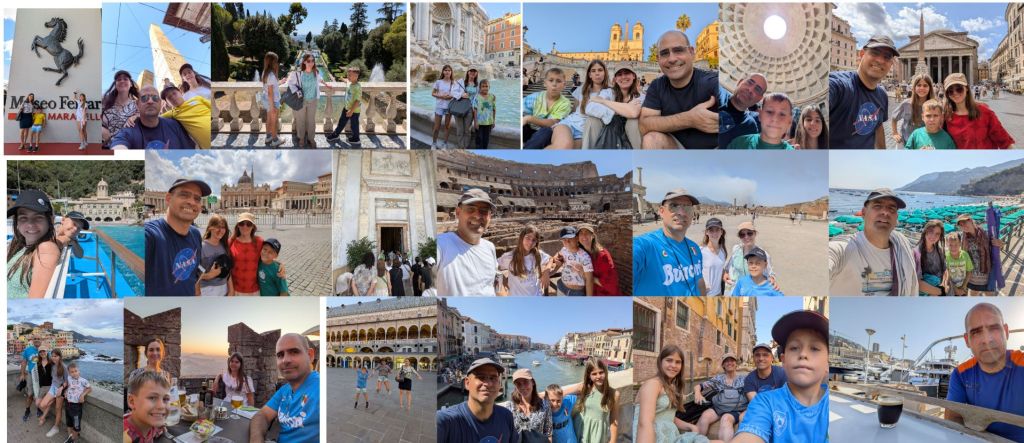
The main experience that we enjoyed together in this 2025 was the road trip we did to Italy during the summer holidays. We spent three weeks driving along the Cote d’Azur, Modena, Bologna, Roma, Orvieto, Assissi, Napoli, Pompei, Sorrento, Aquila, Attri, Loreto, Urbino, San Marino, Ravenna, Venezia, Padova, Verona, Milano… It was a trip full of museums, churches, cathedrals and basilicas (the 2025 jubilee in the Catholic Church and the Jubilee of Youth during our visit brought many young people with their chants and dances, it also enabled us to learn many things), beautiful landscapes, architecture, Roman ruins, bathing in different beaches (including an excursion and sleeping at a boat in the Port Hercule of Monaco), delicious food, lots of sun, a bit of running, and having fun with the kids.
Traveling in Italy.
Family. Andrea is now 12 years old and David, 9.
Andrea did very well in grade 6 and has also started grade 7 well, with very good marks. She especially enjoys Science, Maths and researching for her History assignments. She continues to take Spanish lessons, to play piano and volleyball in the village team. A highlight of her school year was the musical they put together in the school, Peter Pan.
Andrea in 2025
David now loves most of all football, playing it in the school, with the village team or in video games. He is also a very good student in his grade 4, where he enjoys Math and French. He is very helpful at home and he is now in his third year of Spanish lessons. They both spent several weeks alone with my parents in Madrid during school holidays, which they loved.
David in 2025
Running: My objectives for 2025 were to avoid injuries and to complete at least another marathon, and I managed to achieve both. I kept a good habit of running without pushing too much to avoid injuries, including adapting the marathon training plan I followed in the Autumn. I ran over 1,200km in 2025, not as much as I would have liked but at the level of 2024. Finally, on November 30th I completed my 25th marathon in Alicante.
Following a mantra I try keep to the letter (when in good health), “the running shoes, always in the suitcase”, the year 2025 caught me running in: Torrelodones, Galapagar, La Grau-du-Roi, Cannes, Tuscany, Marcelli, San Marino, Padova, Monaco, Tournefeuille, Châteauroux, Péronne, Wijchen, Beijing, Shanghai, Shenzhen, Alicante, Elche and San Sebastián, plus the tens of times I trained in my village, in Blagnac and Toulouse.
Running in places.
Skiing. In 2025 we went again with the family for a week to our favourite resort at Vars, in the Southern Alps. This year again we could enjoy much time skiing with the kids out of their skiing lessons. They are more daring and at ease especially skiing off tracks, and sometimes it’s difficult to keep pace with them. This year Andrea got her 3ème étoile medal and David his 2ème one (levels from the French ESF).
Flying. This year I managed to fly more than in 2024. I did some training flights and some others with the kids, including a nice flight excursion we did along the Lot and Dordogne valleys. In October I also had to renew my French language radio competence (FCL 055) and in November I renewed the licence by experience after flying with the instructor (SEP (single-engine piston) qualification).
In all, this year I have flown 13 flight hours, 12 flights and 30 landings. This takes my total experience to 228 flight hours and 369 landings since I started taking lessons back in 2011. Hopefully in 2026 we can take part in some excursions abroad.
Flying in 2025
Travelling. Apart from the unforgettable trip to Italy, in this 2025 either alone or with the family we continued to visit some new and old places: Aix-en-Provence, Vars, Saint-Rémy-de-Provence, Arles, Nîmes, Burgos, Bourges, Fontainebleau, Montargis, Paris, Amboise, Brugge, Dunkerque, Pierrefonds, Beijing, Shanghai, Guangzhou, Shenzhen, Chengdu, Elche, Alicante, Wijchen, Rijswijk, Saint-Quentin, La Rochelle, Bordeaux, San Sebastián…
Reading. In this 2025, I managed to read a bit more than last year, in all 17 books, mostly in Spanish with the rest split in English and French (2 books in each language). I’m also happy to have read other 5 books of the Great Books curriculum for the bachelor in arts of Saint John’s College, a list I have been using as a reference for years. For the detailed list of books, see the post I wrote about my 2025 reading list with a brief description of each one.
Other cultural activities:
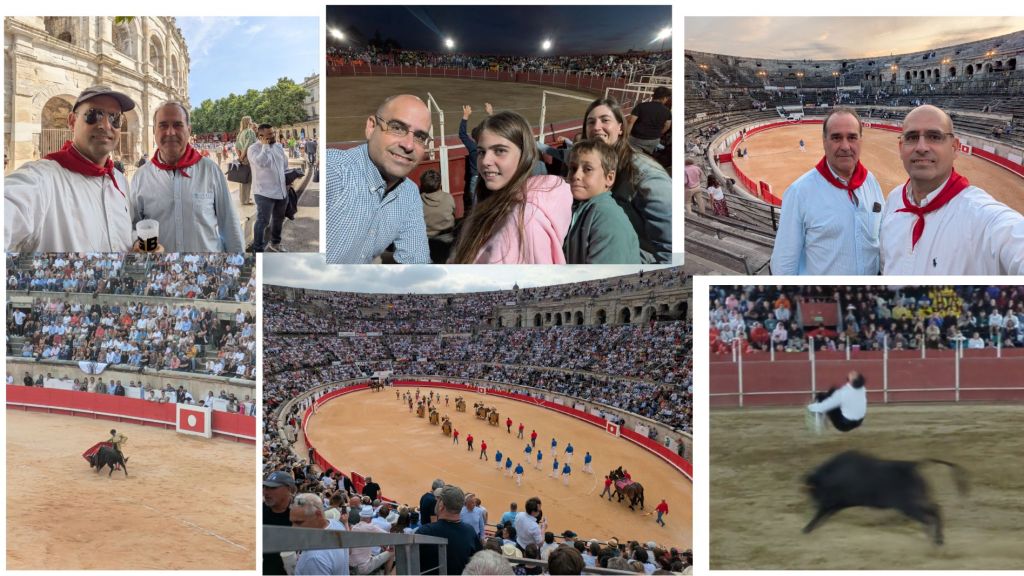
Bullfighting. This year again, together with Luismi, we went to Nîmes to attend its Feria de Pentecôte, in particular a corrida (same wording in French) with the following bullfighters: Morante de La Puebla (who had an incredible 2025 and retired in October; in Nîmes he did a good job but wasn’t lucky with the bulls), Talavante and the young Marco Pérez, the latter two were awarded 2 ears and exited through the puerta grande.
Later, in July we went with the family to a concurso de recortadores at Las Navas del Marqués (Ávila), a contest in which 12 men went into the arena one by one to dodge the bull when running towards them in impressive ways, including jumping over it. The winner was Paquito Murillo, who had been Spanish champion of that variety in the past.
I also renewed my membership to the foundation Toro de Lidia to keep supporting the art.
Theatre. We started the year with a great musical in Madrid, Grease (thanks to a wonderful invitation from my sister Beatriz!) and the Pantomime show in Pibrac where they played Rapunzel (which was hilarious). At the end of the school year we also attended the great show put up by the kids of the school with Peter Pan.
Other shows: we went with the family a few times to the cinema, with Formula 1 being the movie we liked the most. We also went to a concert of the string quartet Mascarade. We also went a couple of times to see matches from the Toulouse FC at the stadium, against Montpelier and Metz. Those were great fun especially for the kids. What we want to do in 2026 is to rather see the rugby team with the family and possibly more music concerts.
Museums. This year again we took benefit of every trip to visit as many museums and castles as we could (some of them were visited for a second or third time): Arles theater and amphitheater, Saint Remy Provence St Paul Mausole (where Van Gogh was interned), Palais Jacques Coeur and Cathédrale in Bourges, Château Fontainebleau, Panthéon, Notre Dame, Musée du Louvre and Les Invalides in Paris, Sainte-Marie-Majeure in Marseille, Abbazia di San Fruttuoso, Museo Enzo Ferrari Modena, Museo Ferrari Maranello, Basilica di San Petronio and Basilica di San Domenico in Bologna, Archiginnasio di Bologna, Lamborghini Museo in Sant’Agata Bolognese, Casa Museo Luciano Pavarotti, Basilica di San Francesco in Assisi, Abbazia di San Pietro in Perugia, Duomo di Orvieto, Villa d’Este in Tivoli, Pantheon, Chiesa di Sant’Ignazio di Loyola, Santa Maria sopra Minerva, Chiesa di Sant’Agnese in Agone, Musei Vaticani, St. Peter’s Basilica, Basilica di San Giovanni in Laterano and Scala Santa, Basilica di San Clemente al Laterano, Terme di Caracalla, Colosseum, Roman Forum and Palatine Hill, Basilica di Santa Maria Maggiore, Basilica di San Paolo fuori le mura, Catacombe di San Callisto, Napoli Sotterranea, Duomo di Napoli, Pompeii, Abbazia di Montecassino, Basilica di Santa Maria di Collemaggio in L’Aquila, Duomo di Atri, Santuario della Santa Casa in Loreto, Palazzo Ducale in Urbino, the towers Cesta and Guaita in San Marino, the Basilica de San Vitale, Galla Placidia, the Orthodox Baptistery, Sant’Apollinare Nuovo and the Basilica de St Francesco in Ravenna, the Basilica di San Marco, Correr Museum and the Palazzo Ducale in Venice, Château du Clos Lucé in Amboise (where Da Vinci lived his last years), Stadhuis and the Basilica of the Holy Blood in Brugge, Aviodrome museum, Museum Dunkerque 1940 Operation Dynamo, Château de Pierrefonds, Great Wall of China in Mutianyu, the Palacio de Altamira and Torre de la Basílica de Santa Maria in Elche, Aachen Rathaus, Netherlands ice sculptures Festival, Wonder van Empel, Château de Compiègne, Basilique Saint-Martin de Tours, Cathédrale Saint-André de Bordeaux.
Blogging. This is the 16th year since I started the blog in February 2010. This year I wrote just 9 blog posts, in line with the past years since 2020. It helps me to structure some ideas in some posts, to dig into some topics other times, and as a personal repository to which I come back every now and then. The blog received just over 20,800 visits, a bit more than in 2024 (in line with the past few years) and over 533,000 views since 2010.
Work. No changes in the scope of the work this year (A330neo product marketing since January 2023), neither in the team, so it was a stable year in that front.
Since 2023 the markets keep being quite active, and in 2025 we had a good year for the A330neo in terms of aircraft orders.
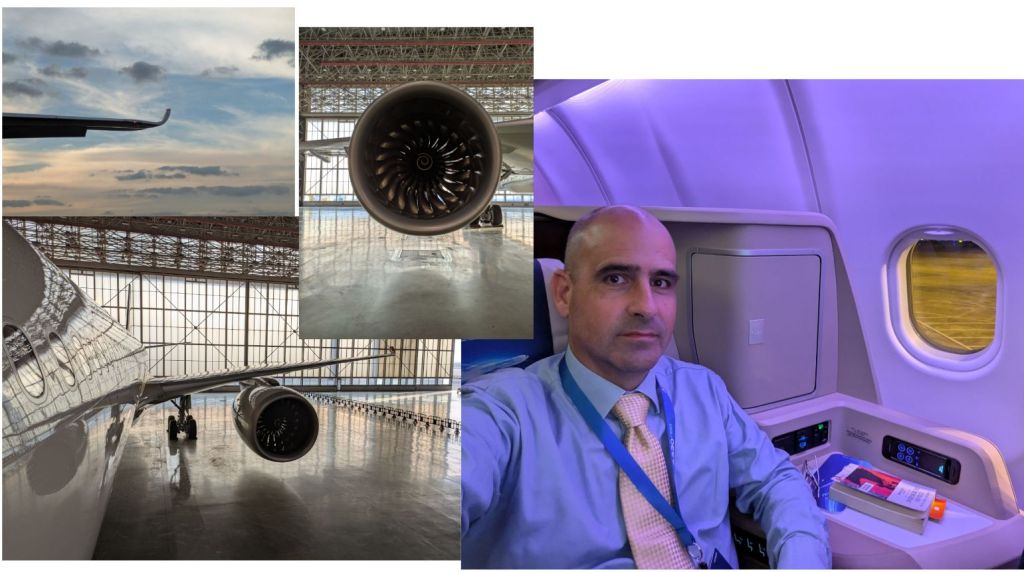
This year I had the opportunity to join a great demo tour where we rented the aircraft from an airline and we visited different pages to showcase the A330neo with colleagues from Airbus and Rolls-Royce to varied groups of customers or institutional representatives. That was a very intense week but full of new experiences. These included the first time I flew an airline’s A330neo! (I had only flown before the Airbus A330neo flight test aircraft).
Working on the A330neo.
Now it’s time to rest, celebrate with the family and hope for the best in 2026. For the moment we have just a few days in Madrid to enjoy with family and friends and a planned skiing week in Vars; hopefully that will be just the beginning of another memorable year.
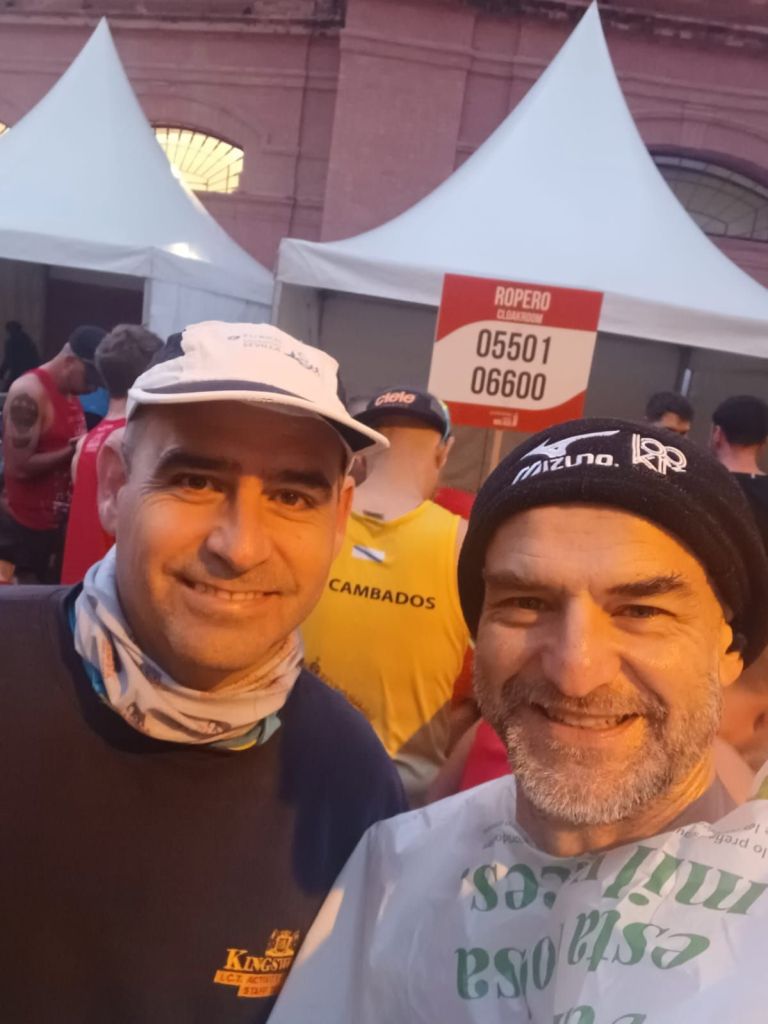
Last Sunday, December 15th, together with my friend Manuel we traveled to Malaga to take part in its marathon, with around 6000 runners registered in the distance.
We picked Malaga following our series of marathons abroad (to combine tourism with long distance running) that has taken some of us to run together in Paris, Berlin, Roma, Athens, Rotterdam, New York, Sevilla (x3), Madrid, Millau, Dublin (x2), Lisboa, Vienna, Krakow, Porto, Bucharest and now Malaga (in bold those run with Manuel).
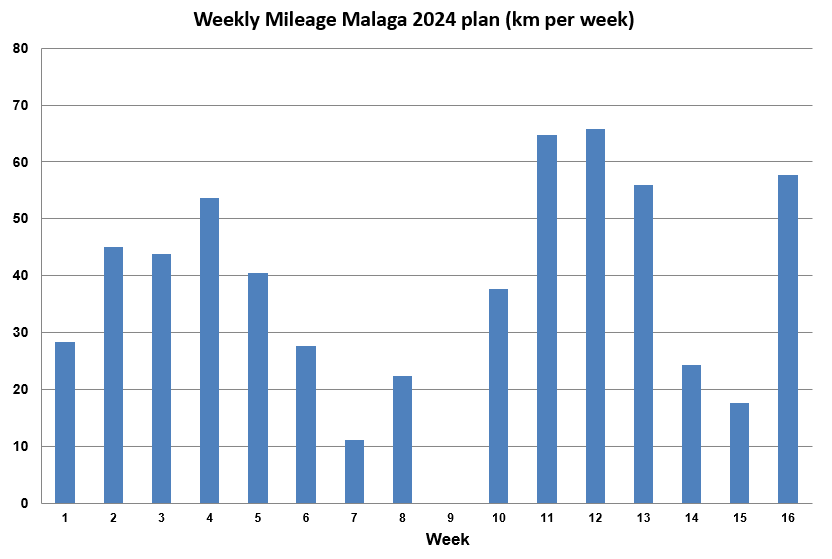
To prepare for this marathon I followed the same 16-week training plan I had used in the past. Just before those 16 weeks of the plan, thanks to a running challenge we followed in the company, I cumulated +200km in 4 weeks between mid May and June. Then at the end of August I started with the plan. In the end I arrived to Malaga with 554km in the legs in those 16 weeks, a bit less than I would have liked. I trained quite well in September, doing most of the series sessions and all long runs, but in early October I had a calf contracture that slowed me for a couple of weeks. At the end of October I resumed the plan but discarded the series sessions while maintaining the long runs… until two weeks before the race when I had another injury in the other calf. I stopped for a few days and resumed with some short runs before the race day. In those 16 weeks I averaged 37km per week, completed 8 long runs (including 4 above 20km; 22km, 30km, 30km and 26km – with positive feelings especially in this last one) and 11 sessions of series, though not enough of them to get a bit faster. Provided that I didn’t get injured again, I was confident in being able to complete the marathon in a time between 4h05′ and 4h15′ even if the final mark was uncertain.
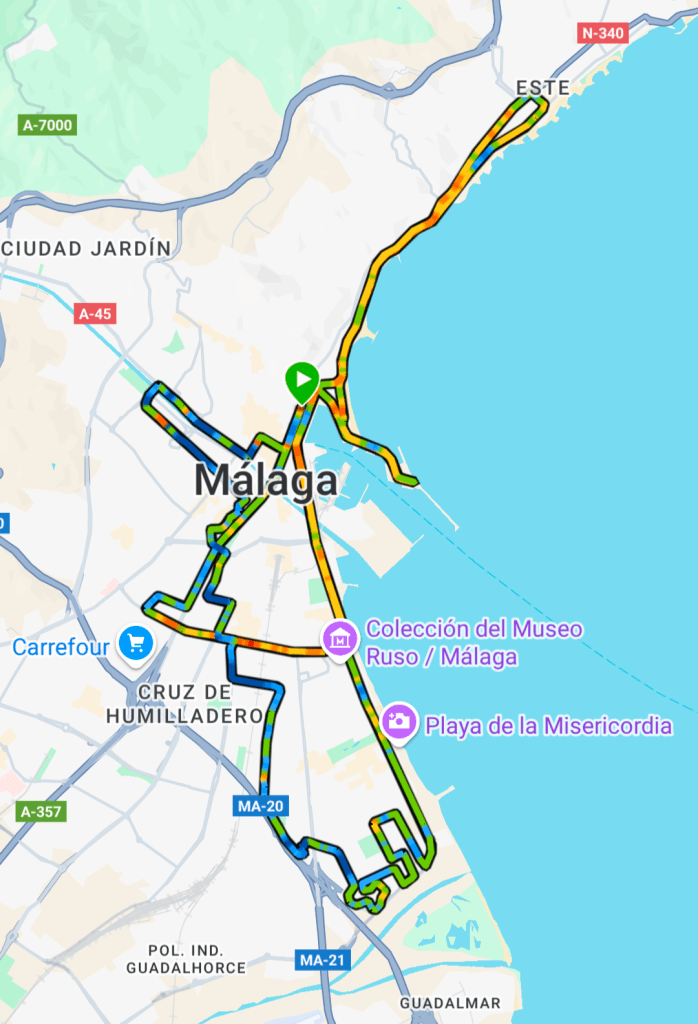
The profile in Malaga is rather flat. The organization prepared a circuit mainly composed of long avenues, mostly by the seaside, which allowed to run at constant pace. The race started and finished in the Paseo del Parque, in front of the iconic Banco de España building, and I stayed for an extended weekend at an apartment at walking distance from the place.
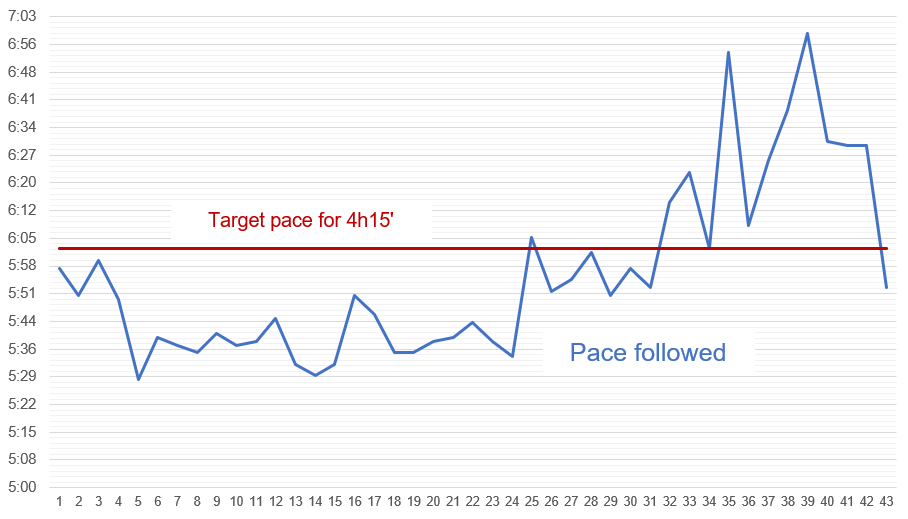
The temperature was a bit cold in the morning (~6°C), the sky was clear and it would be a bit warmer towards the end of the race, though the temperature did not exceed 16°C. My strategy was to start at a pace just below 6min per km, and then, if I felt well, accelerate the pace at mid-race so that I could target a time below 4h15′. There were pacers for times aiming at every 15-minute mark and in the end, I didn’t quite followed that strategy but ran just after the 4-hour pacers at a short distance until the km 23.
The race started at 8:30am and Manu departed from a different box, hence we wished luck to each other and ran separately. We ran with the participants in the half marathon, that made the first half of the race a bit more crowded.
I ran at a comfortable pace until the first half, but I started to feel the same pain in the calf that made me stop a couple of weeks before since km ~16. At km 23 or so the pain became stronger and I softened the pace, fearing that I would have to do some walking later on. Luckily I saw a volunteer with Reflex spray at km 25 and got a good dose of it. A few minutes later the pain mostly disappeared and I could continue running even if at a slower pace. At km 32 I got the calf sprayed again with Reflex and even if I had some difficulties in the last ~6km I could manage the timing to be below the target of 4h15′.
The last 2 km of the race were superb. The race goes through the city centre including Plaza de la Constitucion and calle Marques de Larios with the crowd surrounding and cheering the runners. I kept my pace in the last few hundred metres as by then I had muscle pain in both lower legs so I could not give it a last sprint.
In the end, I clocked a net time of 4h11’39”, a time about what I expected given the weight with which I arrived to the race (93kg) and the injuries I went through during the training weeks, but slower than the last two marathons I ran in 2022 (Sevilla and Bucharest). This has been my 24th marathon completed, easy to say today but not so on April 30th 2000 when I started in the distance in Madrid.
Pace during Malaga 2024 marathon (minutes per km)
With those 4h11’39”, I was again above the 4-hour mark and finished in the 4279th place out of 5733 finishers (25% percentile). That time makes it my 5th worst marathon, though with a positive feeling of having completed another marathon 2 years later and following a 2023 marked by injuries as well. I am now looking for the next one.
The organization of the race was great. The circuit showed a beautiful city. They included plenty of water supply (with bottles) posts, isotonic drinks and food (bananas and oranges), I just missed gels (though I carried myself enough of those). The finish line was great, the wardrobe service was close to the start and finish line (by the bullfighting arena). It was a great experience.