Few days ago, Boeing released 2014 results [PDF, 838KB]. The company reported revenues of over 90.7bn$ (59.99bn$ for the Commercial Airplanes unit), 723 commercial deliveries and 1,432 net orders for its commercial aircraft. All these were widely reported by the media and mean a great year 2014 for Boeing (with increases in these metrics from 6 to 12%).
Last years, I wrote in some posts (1) what was my estimate of Boeing discounts: the relation between what is announced by the press, what appears in its list prices and sometimes as backlogs and what it is indeed computed into the profit and loss account. In this post I wanted to update, if necessary, the figure I calculated for the average discount of Boeing.
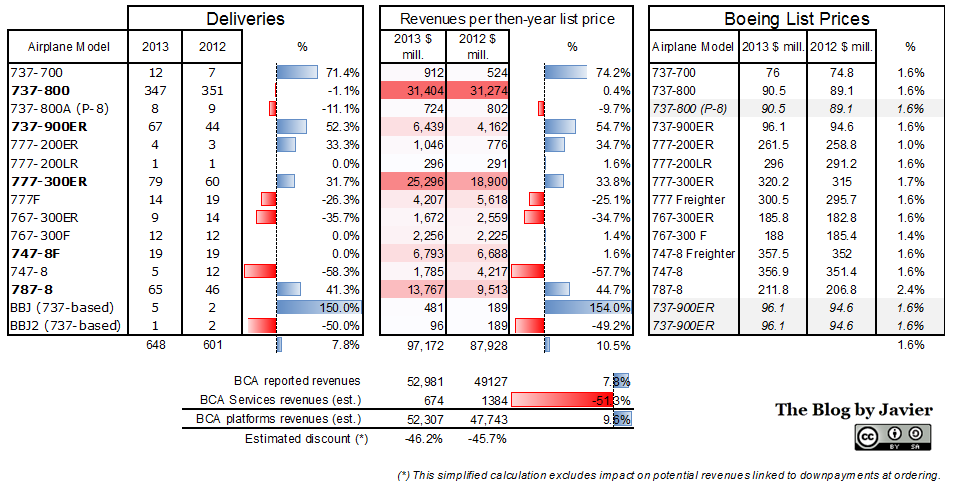
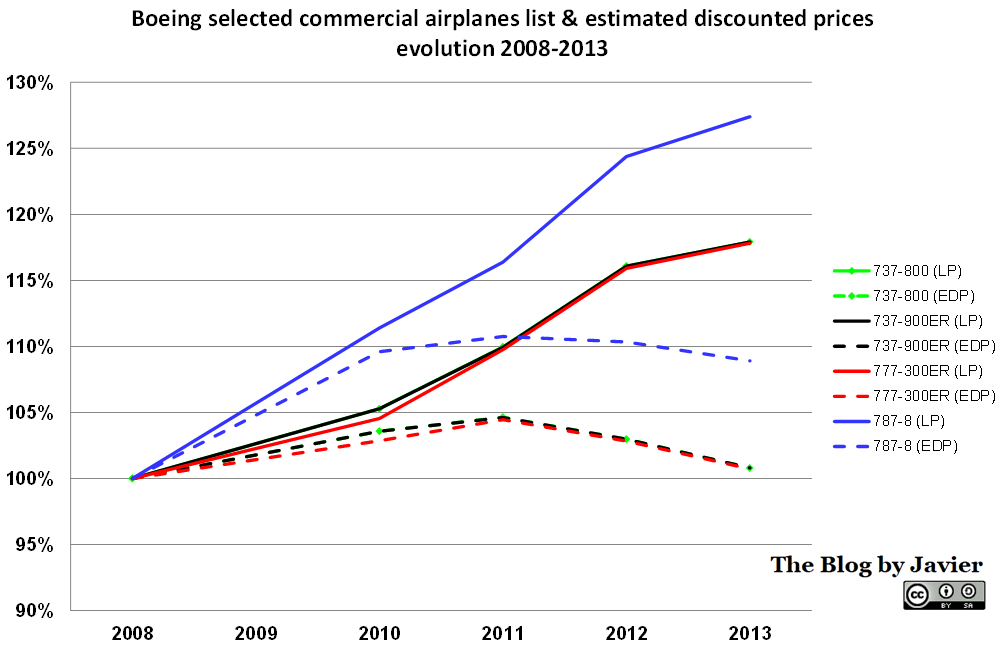
Most of the necessary information can be found in its website. Boeing list prices can be found here.
The number of gross and net orders (after cancellations) year by year can be found here.
Last year deliveries can be found in the report of financial results (or here). From there we can also deduce the figure of Boeing Commercial’s sales of services. That is not directly reported but can be deduced (all Boeing services-related sales are reported as well as Boeing Capital Corporation division and Boeing Defense’s “Global Services & Support” unit)
As in the previous years’ post:
- I needed to make one assumption: new orders come with a 3% down payment in the year of the booking, while the remaining cost I assumed that was paid on the year of delivery (for simplicity I didn’t consider more intermediate revenue recognition milestones linked to payments, the 3% figure was taken from the AIAA paper “A Hierarchical Aircraft Life Cycle Cost Analysis Model” by William J. Marx et al.). (2)
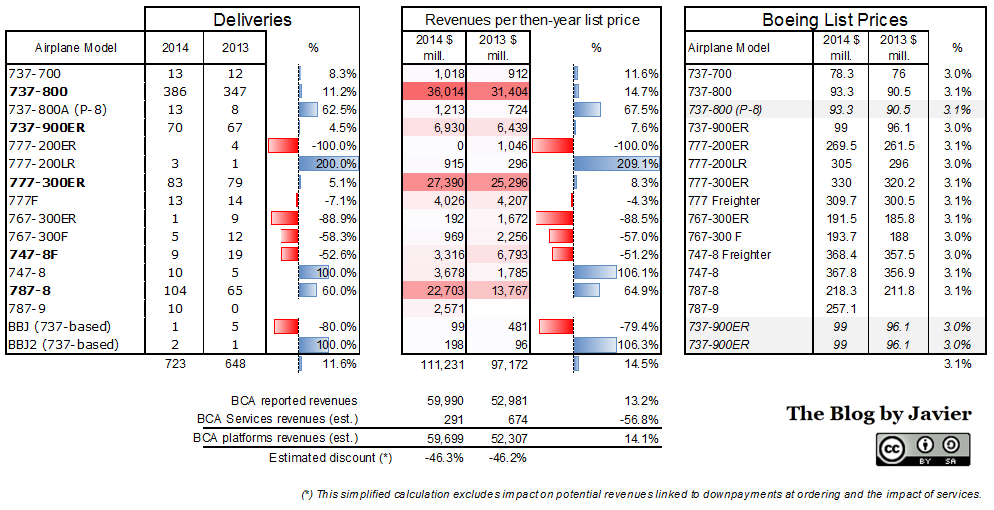
Having put all the figures together, the calculation is immediate. Boeing Commercial Aircraft revenues in 2014 (59.99bn$) are the sum of:
- the discounted prices times the delivered aircraft in the year (including possible penalties from delays),
- less the down payment of the current year delivered aircraft, as the down payment was included in previous years results,
- plus the down payment of current year net orders (this year’s calculation includes 737 MAX and 777X orders),
- plus services revenues (about 0.7bn$ from the commercial aircraft unit – calculated, not reported).
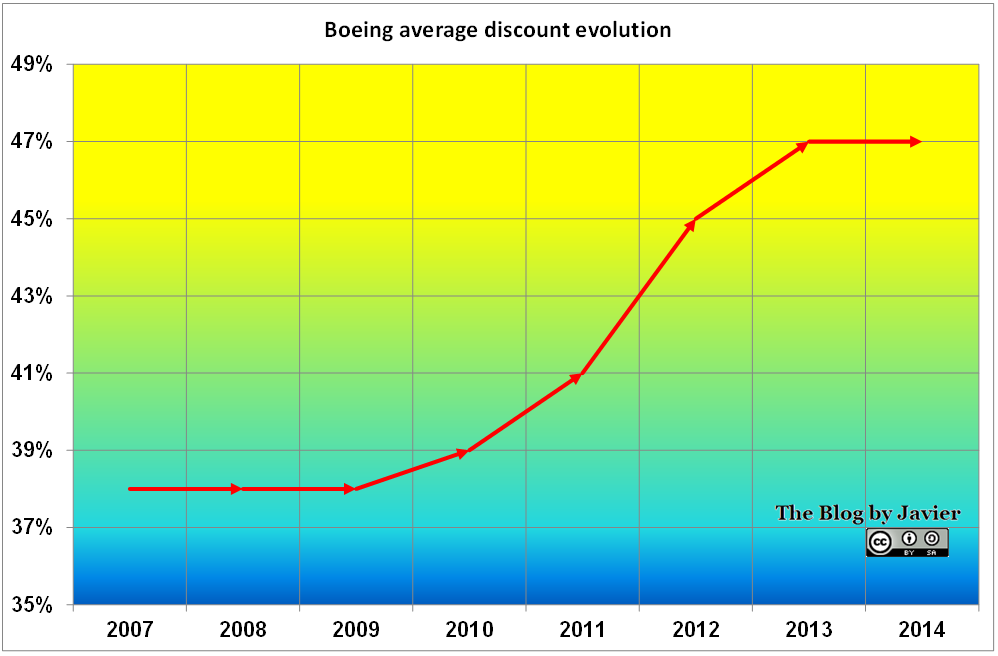
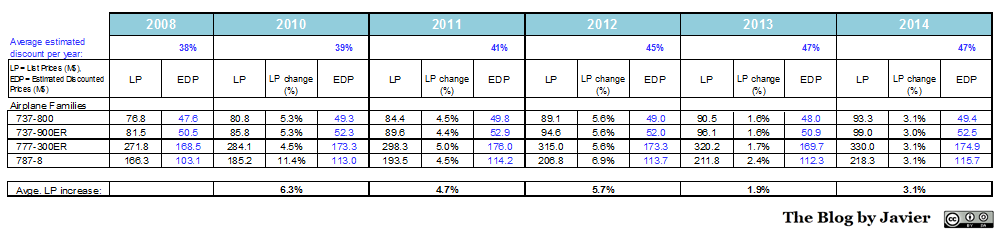
The discount figure that minimized errors last year was 47%. Using this figure, the error obtained this year in relation to Boeing Commercial Aircraft reported revenues is -0.2%. The best estimate for last years average discounts were: 47% for 2013, 45% for 2012, 41% for 2011, 39% for 2010 and 38% for 2009.
The updated figure (which minimize errors for 2014 down to -0.2%) for the discount for Boeing commercial aircraft is 47% (3).

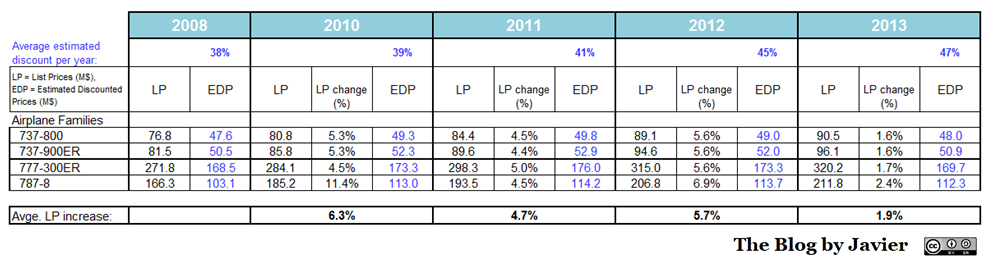
Boeing Average Discount Evolution, through 2014.
The discounts seem to be stabilized around 45-47%.
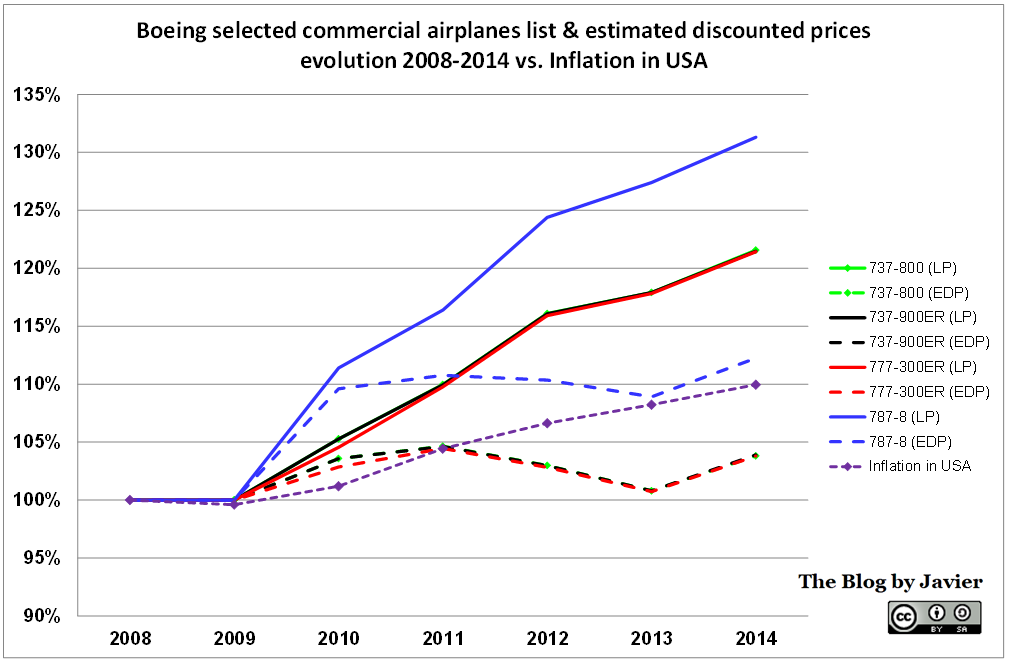
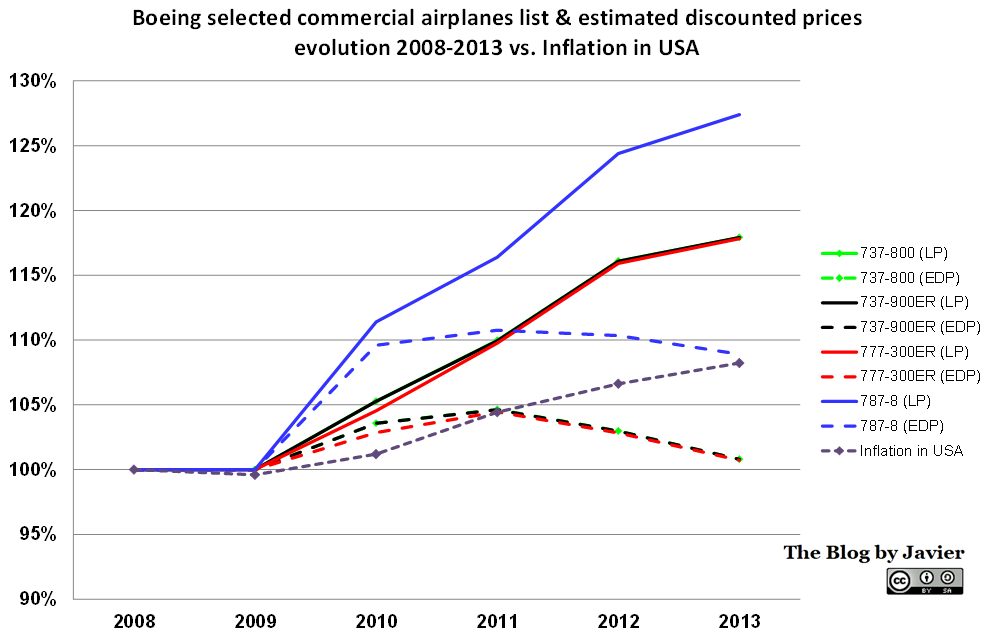
This discount figures and their evolution reflect that Boeing’s list prices and their continuous increases cannot be enforced in the contracts nor in escalation formulas.
Final note: I received a comment suggesting to review whether the discounts are in effect on Boeing side or in the engine manufacturers side. Unless we had the information of actual contracts, there is no way to calculate that from published information. Nevertheless, whether Boeing or engine manufacturers, the fact is that there is discrepancy of up to 47% between what Boeing announces as their list prices for commercial aircraft and backlog figures (in volume) and what it actually receives as income (revenue).
—
(1) Find here what is becoming a “body of knowledge” on Boeing discounts: estimates calculated for 2013, 2012, 2011, 2010 and 2009; a review of the French portal Challenges.fr of aircraft discounts prior to Le Bourget airshow of 2013; a Bombardier’s CEO statement on what is known in the market as the Boeing discount; Boeing Commercial Airplanes president Ray Conner speaking about the more aggressive pricing they are being forced to offer.
(2) Three years ago, I received a comment from the analyst Scott Hamilton on the level of downpayments. He mentioned they could reach up to 30%. I tried this time to compute the calculation using that input, though the figures of discounts to be applied each year to minimize errors would have to be even higher, close to 60% (!), thus I stayed with the 3% used in the above-mentioned published paper to stay on the conservative side. On the contrary, if we assume that downpayments have no influence in the revenue recognition (as another comment indicated last year), but only in the cash flow, the discount figure would slightly decrease (about 1%). The issue is not so much the size of the downpayments, whereas how much of those, if any, are recognised as revenues.
(3) I find this trend of continuous increases in Boeing discounts in line with bothChallenges.fr report and Ray Conner’s mentions of aggressive pricing last year, both referred to in note (1).