Tag Archives: deliveries

Boeing 737 vs Airbus A320 family deliveries, 1967 – 2018

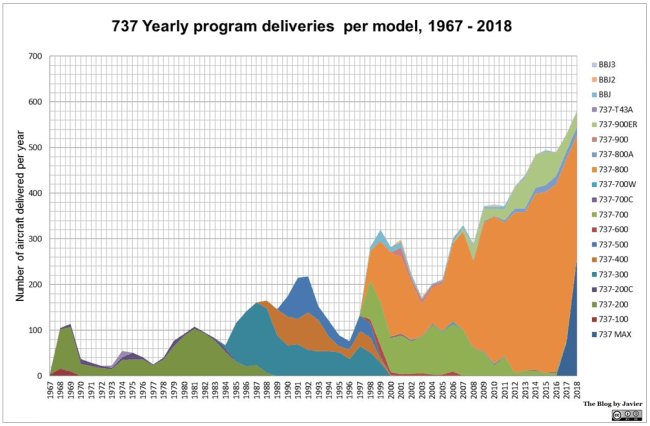
In the previous post I shared a graphic with the Boeing 737 deliveries per year per model since 1967 till 2018. In this post, I want to share a few graphics comparing the evolution of deliveries of the Boeing 737 family with the Airbus A320 family of aircraft.

737_vs_a320_family_deliveries_per_model_1967-2018

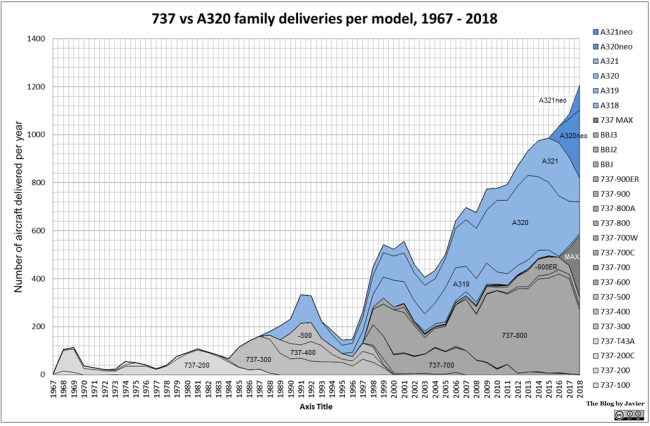
In the graphic you can see the tremendous growth in the past years. From the valley in 1995 (with 145 combined deliveries) till 2018 (with 1,206 combined deliveries) there has been a remarkable compound annual growth rate (CAGR) of 9.6%. The greatest sellers: the 737-800 with 4,959 aircraft delivered through end of 2018 and the A320 with 4,700.

The first time that the combined deliveries surpassed the 200 airplanes was in 1989 (204 aircraft). In 1998, the combined figure surpassed the 400 (450 aircraft). In 2012 they reached more than 800 (870). In 2016, more than 1,000 combined deliveries (1,035), reaching 1,206 in 2018.

737_vs_a320_family_deliveries_1967-2018

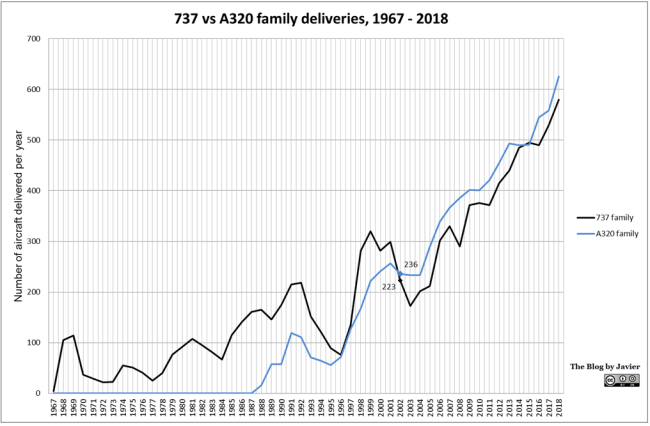
The A320 family surpassed the 737 family in yearly deliveries for the first time in the year 2002, when 236 aircraft of the family were delivered (85 A319, 116 A320 and 35 A321) compared to 223 737s. Since then Airbus has taken the lead in the relative market share between both families, with the exception of 2015 (49.8% – 50.2% for Boeing; with 4 aircraft making the difference – 491 vs 495).

737_vs_a320_family_relative_share_1988-2018

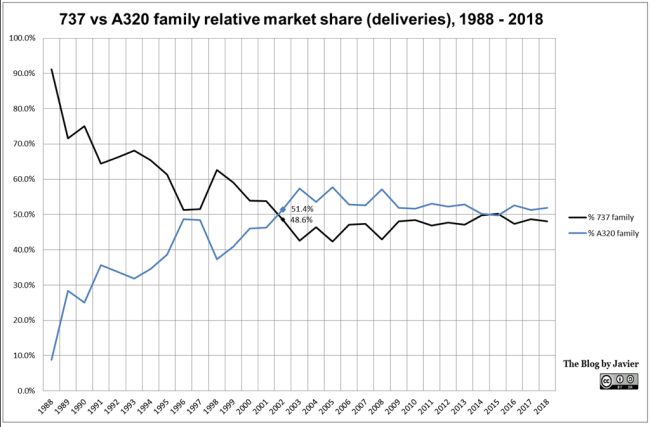
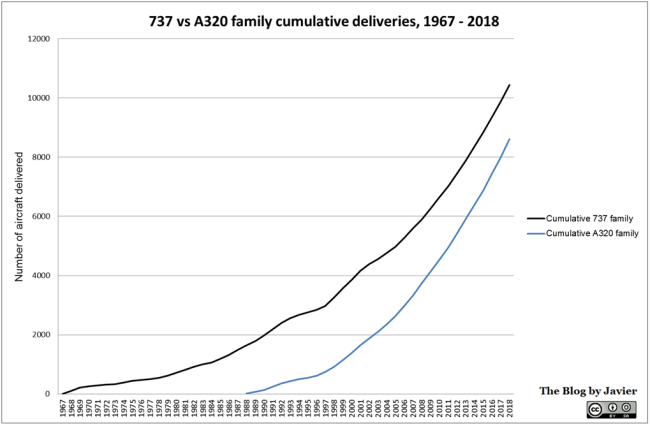
The 737 was introduced in 1967, the A320 in 1988, 21 years later. The 737 led the market for another 14 years, increasing the gap in aircraft deliveries. Since then Airbus has been narrowing it: at the end of 2018 the gap was of 1,839 aircraft with 10,444 cumulative 737s delivered compared to 8,605 A320s.

737_vs_a320_family_cumulative_deliveries_1967-2018


Leave a comment

Filed under Aerospace & Defence

737 deliveries per year, 1967-2018

Two weeks ago, both Airbus and Boeing have released the figures of aircraft deliveries for the complete 2018: 800 and 806 airplanes, respectively, in what is a new industry record. This is just a quick post to share the graphic below with the evolution of 737 family deliveries per model since 1967 (year of its introduction) till 2018.

737 deliveries per year, 1967-2018

Through December 2018, up to 10,444 Boeing 737s have been delivered, making it the most successful commercial jet aircraft throughout history. In the graphic you can see the different generations: -100/-200 till the mid-80s, the -300/-400/-500 till the end of the 90s, the Next Gen in the 2000s and 2010s, until the introduction of the MAX a couple of years ago. With the steep ramp up in the recent years, it reached 580 deliveries in 2018.

However, it is worth noting that since 2002 Airbus A320 have delivered more aircraft in every single year with the exception of 2015. The 626 A320 deliveries in 2018 have meant a new industry record for commercial jet aircraft.

infographic-airbus-commercial-aircraft-orders-and-deliveries-2018

1 Comment

Filed under Aerospace & Defence

Boeing 787 orders, cancellations, deliveries & backlog through 2018

Quick post with the updated figures and graphic of orders, cancellations, deliveries and backlog of the 787 programme at the end of 2018.

For the fifth consecutive year above a hundred 787 airplanes have been delivered in 2018, 145 deliveries, a new industry record for a commercial wide-body aircraft. At that pace, the backlog is being consumed quickly, especially since in the last years the wide-body market has been rather sluggish.

In the last 5 years, 487 gross orders for 787s were placed, offset by 114 cancellations (about 20%) for a total of 373 net orders, 109 of them in 2018, its best selling year since 2013. Book-to-bill ratio was 0.75 in 2018, less than a desired > 1, but better than in the previous years.

Since 2011, there have been 781 cumulative deliveries (or in-service aircraft), that is 56% of the standing 1,403 net orders. Reversely, there is a backlog (1) of 622 aircraft to be delivered, 44% of the orders received so far, or about 4.3 years of production at this rate.

787 orders and cancellations 2018


(1) Since Q1 2018 Boeing has adopted a new revenue Recognition Accounting Standard (ASC 606) which imposes additional criteria for the backlog accounting beyond the existence of a firm contract to deliver. For the purpose of this post, I have kept the previous criteria, knowing that the difference between 787 “unfilled orders” (622) and “backlog” (604) are 18 aircraft.

Leave a comment

Filed under Aerospace & Defence

Cumulative wide-body airplanes’ deliveries per model, 1969-2018

Last week, both Airbus and Boeing have released the figures of aircraft deliveries for the complete 2018: 800 and 806 airplanes, respectively, in what is a new industry record. In a previous post I showed the evolution commercial wide-body airplanes’ deliveries per year since 1969 (year of the introduction of the 747) till 2018. In this article, I wanted to show this other graphic with the evolution of the cumulative wide-body airplanes’ deliveries per model since 1969 until 2018.

cumulative wide-body airplanes' deliveries per model per year, 1969-2018

For the first time since 1969, the Boeing 747 is not the most built wide-body airplane in history, as in 2018 it was surpassed by the Boeing 777. At the end of the year cumulative deliveries stood at 1,548 and 1,582, respectively.

Diving into Boeing Commercial Airplanes site, we can see when that happened:

  • On March 20th, with the delivery of a 777-300ER (MSN 64989; LN 1548) to United Airlines (registration N2645U), the 777 programme matched the 1,543 cumulative deliveries that the 747 had achieved until then.
  • On March 22nd, with the delivery of another 777-300ER (MSN 64085; LN 1538) this time to Qatar Airways (registration A7-BEQ), the 777 programme surpassed the 747 programme deliveries, and established a new record with 1,544 cumulative deliveries. Since then, it has taken the lead until year end (1,582) and for the foreseeable near future.

boeing 777 surpasses 747 in cumulative deliveries

Leave a comment

Filed under Aerospace & Defence

Commercial wide-body airplanes’ deliveries per year, 1969-2018

This week, both Airbus and Boeing have released the figures of aircraft deliveries for the complete 2018: 800 and 806 airplanes, respectively, in what is a new industry record. This is just a quick post to update a graphic with the commercial wide-body airplanes’ deliveries per year since 1969 (year of the introduction of the 747) till 2018 (1).

commercial wide-body airplanes' deliveries per year, 1969-2018

Some reflections:

For the first time ever, in 2015 over 400 twin-aisle aircraft were delivered in a year (412), the same feat was achieved in 2016 (402). In 2017 and 2018 production descended below 400, down to 380 twin-aisles last year, still the fourth best year in the wide-body history.

The average number of deliveries for the previous 20-year period (1998-2017) was 249 airplanes per year. Up to now, in the 50 years of twin-aisle market (2), in only 7 years more than 300 airplanes were delivered in a single year, the seven last years, and only in other 9 years more than 200 airplanes had been delivered.

The combined steep production ramp-up during last years has enabled to reach a production rate of about the double of what was produced in 2010 (195). In particular, the combined compound annual growth rate (CAGR) of the rate of deliveries for the last 10 years has been 7.6%. These rates are above the yearly growth of traffic (measured in RPKs).

With the figures up to the end of 2018, above 9,100 wide-body airplanes had been delivered. Thus, around the end of 2020 we will reach reach the 10,000th. However, we won’t know whether the 10,000th twin aisle will be a Boeing or an Airbus.

The share of wide-body deliveries in 2018: 59% Boeing and 41% Airbus.

There were 145 787s delivered in 2018, the largest amount of twin-aisle deliveries of a single model in a single year ever. A remarkable feat and new industry record for the wide body segment, beating its mark of 2016 (137). Only the 787 and the A330 have ever been delivered in excess of 100 aircraft in any given year; 4 times for the A330 (between 2012 and 2015) and the last 5 years in the case of the 787.

The deliveries of the 777 have been decreased by half in the past two years: from 99 in 2016 to 48 in 2018. This is similar output valley than what happened with the A330 when reaching the mark of ~ 2 years before targeted entry into service (EIS) of the new version, the A330neo: delivery decrease in 2016 for an 2018 EIS for the A330neo, and delivery decrease in 2018 for a 2020 Q2 target EIS for the 777X.

a330_b777_valleys


—————

(1) See here a previous post with the figures up to 2017.

(2) On February 9th, it will be the mark of the 50th anniversary of the 747 first flight.

1 Comment

Filed under Aerospace & Defence

Boeing 787 orders, cancellations, deliveries & backlog through 2017

Quick post with the updated figures and graphic of orders, cancellations, deliveries and backlog of the 787 programme at the end of 2017.

For the fourth consecutive year above 100 787 airplanes have been delivered in 2017, 136 deliveries, the third year in a row with above or 135 deliveries. At that pace, the backlog is being consumed quickly, especially since in the last years the wide-body market has been rather sluggish.

In the last 4 years, 351 orders for 787s were placed, offset by 87 cancellations (about 25%) for a total of 264 net orders, 94 of them in 2017, its best selling year since 2013. Book-to-bill ratio was 0.69 in 2017, less than a desired > 1, but better than in the previous years.

Since 2011, there have been 636 cumulative deliveries, that is 49% of the standing 1,294 net orders. Reversely, there is backlog of 658 aircraft to be delivered, 51% of the orders received so far.

787 orders and cancellations 2017

787 orders, cancellations, deliveries and backlog through 2017.

Leave a comment

Filed under Aerospace & Defence

Commercial wide-body airplanes’ deliveries per year, 1969-2017

In the last weeks, both Airbus and Boeing have released the figures of aircraft deliveries for the complete 2017. This is just a quick post to update a graphic with the commercial wide-body airplanes’ deliveries per year since 1969 (year of the introduction of the 747) till 2017 (1).

Commercial wide-body airplanes' deliveries per year, 1969-2017

Commercial wide-body airplanes’ deliveries per year, 1969-2017.

Some reflections:

For the first time ever, in 2015 over 400 twin-aisle aircraft were delivered in a year (412), the same feat was achieved in 2016 (402). In 2017 production descended to 394 twin-aisles, still the third best year in wide-body history.

The average number of deliveries for the previous 20-year period (1997-2016) was 239 airplanes per year. Up to now, in the 49 years of twin-aisle market, in only 6 years more than 300 airplanes were delivered in a single year, the six last years, and only in other 9 years more than 200 airplanes had been delivered.

The combined steep production ramp-up during last years has enabled to reach a production rate of more than the double of what was produced in 2010. In particular, the combined compound annual growth rate (CAGR) of the rate of deliveries for the last 10 years has been 7.1%. These rates are above the yearly growth of traffic (measured in RPKs).

With the figures up to the end of 2017, nearly 8,800 wide-body airplanes had been delivered. Thus, by mid-2018, we will certainly reach the 9,000th. However, we won’t know whether the 9,000th twin aisle will be a Boeing or an Airbus.

The share of wide-body deliveries in 2017: 59% Boeing and 41% Airbus.

There were 136 787s delivered in 2017. A remarkable feat: one aircraft short of its 2016 record of 137 deliveries, the largest amount of twin-aisle deliveries of a single model in a single year ever. Only the 787 and the A330 have ever been delivered in excess of 100 aircraft in any given year (4 times for each aircraft).


(1) See here a previous post with the figures up to 2015.

1 Comment

Filed under Aerospace & Defence

A380 vs. 747: orders and production rates

After the recent announcement by Airbus and Emirates of the signature of an MoU for up to 36 A380 (press release), my friend and colleague Jose and I quickly wondered how would that leave a series of comparisons in which we set out years ago to compare how quickly or not sales of the 747 piled up back in its heyday.

See below the update of those couple of graphics.

First see in the graphic below A380 orders since the programme launch (2001) in comparison to those of the 747 (1966):

A380 vs 747 - Launch 2017

A380 and 747 orders referenced to the year of launch of each programme (up to 2017).

Both programmes show an initial sales rush at the time of programme launch. In both cases the rhythm of sales slowed down after the second year. In the first 18 years of program, each had managed:

  • 747: 615 orders.
  • A380: 337 orders (55% of 747’s). With a caveat being that we are now in January 2018 and through the end of the year the A380 could pile up some more orders.

Thus, we can see that the Boeing 747 was selling better already from the beginning of the programme.

I include again yet another comparison: aircraft orders taking as reference the year of first delivery, having heard so often the industry mantra that some potential customers would wait to see the aircraft in operation before placing orders. See below this second comparison:

A380 vs 747 - Delivery 2017

A380 and 747 orders referenced to the year the 1st aircraft delivery of each programme (up to 2017).

In this case, and due to the shorter time to develop the Boeing 747 since program launch (1966), the difference in sales is slightly narrowed:

  • 747: 554 orders.
  • A380: 337 orders.

You can see that, 11 years after the 1st delivery of each aircraft (2007 for the A380 and 1969 for the 747) the 747 had sold about 50% more aircraft and that is due to the pick up of sales it went through from its 8th year of operation.

Finally, I include below an update of yet another graphic in which we compared the Boeing 747 and Airbus A380 production rates throughout history. The bars show Boeing 747 yearly deliveries. The lines the monthly production rate for both aircraft and its 3-year rolling average. I took this average to smooth the curve even if it is very similar to the year-by-year data.

A380 vs 747 - rate 2017

Some comments on the 747 production rates (taken from its yearly deliveries):

  • The average monthly production rate since its first delivery back in 1969 has been: 2.6 airplanes per month (1.7 for A380).
  • During the first about 30-35 years (till ~2002-3) the rate fluctuated between 2 and 5 deliveries per month.
  • Since 2003 the rate has averaged 1.2.
  • For the first 11 years of the 747 programme (as the A380 just completed those first eleven years of deliveries), its production rate averaged 3.1 aircraft per month.

Time will tell if the market for the A380 picks up.

Leave a comment

Filed under Aerospace & Defence

My forecast of Boeing Commercial Airplanes 2017 revenues

Next January 31st, Boeing will hold an earnings conference where it will announce its Q4 and full 2017 year financial results, including the revenues of each of its units.

Three weeks ago, on January 9th, Boeing already issued a press release where it announced its deliveries and orders for 2017, mainly:

  • 763 commercial aircraft delivered (including 529 of the 737 family, or 136 787).
  • 912 net orders (after cancellations) (including 745 of the 737 family).

The release mentions “912 net orders, valued at $134.8 billion at list prices“, however those list prices are discounted, nothing new, and with an estimate of that discount I’ll try to guess the figure of revenues for the Boeing Commercial Airplanes division, not so much trying to be accurate in itself, but to point in advance to the increasing of the discounts as we will see below.

Where can we find Boeing list prices? Boeing host them in their site, these have just bee raised 10 days ago about 4% (see this comment about it). The previous prices dated from March 2017, when Boeing raised them again, that time by about 2% from its 2015 prices (untouched in 2016). To compute 2017 revenues and estimate of discount I use 2017 prices, not the latest ones.

If Boeing didn’t apply those discounts, the value of the 763 aircraft delivered in 2017 would yield revenues of above 118 bn$. To come to a ballpark figure, I will take the latest figure of discounts that I had calculated with 2016 and earlier figures, being the latest ~46%.

Discount evolution_2016

If I plug that discount into the 2017 list prices of the fleet mix of the 763 commercial aircraft that Boeing delivered we would come to a figure of revenues of 62.1 bn$. However, see below what was Boeing’s own guidance in their Q3 earnings release:

2017 Q3 Financial Outlook

Boeing’s 2017 Financial Outlook at Q3 2017 earnings press release.

At three months to the year end (Q3), they forecast between 760 and 765 deliveries, which turned in 763. At the same time they pointed to revenues between 55.5 – 56.5 bn$… and not above 62 bn$. I believe they will exceed their own estimate, but not by 5 bn$, that is why I see that their discounts have been greatly increased in the last 2017. They must have had a bad time in escalating prices of aircraft sold years ago, delivered in 2017 but with escalation conditions much lower than ongoing list prices.

With all these ingredients… my forecast is: 57.0 bn$.

Some comments to it:

  • My forecast is a bit more optimistic than their upper bracket (56.5) which may be slightly conservative.
  • The implied discount of my revenues forecast would be in the ~ 50% range.

(1) See here a couple of such forecasting revenues exercises that I did for Boeing’s 2014 and 2015 revenues.

(2) See here the latest detailed calculation of discounts that I posted in 2015.


2 Comments

Filed under Aerospace & Defence

A380: 747 production rate throughout history

Back in 2013, I wrote a post comparing the orders of the Airbus A380 compared to those of the Boeing 747 Jumbo taking different references for the comparison. As I explained then, the idea for the post was triggered by a conversation with my friend Jose. A year later, in 2014 I wrote an update of that comparison (here).

This post is yet again triggered by another point raised by Jose (1) in another conversation a few months ago, when Airbus announced that it has reached the unit break even point for the A380 programme in 2015 with 27 deliveries. In that news it was already mentioned that the company sought to lower the number of aircraft for breaking even on any given year. The point became more relevant since Airbus confirmed, this week at Farnborough air show, that it would slow down its production pace to a monthly rate of 1 aircraft per month from 2018.

In our conversation, Jose looked at how the Boeing 747 production rate had evolved throughout history. Taking the figures from the 747 article in the Wikipedia (here), you can see the results in the graphic below. The bars show yearly deliveries. The lines the monthly production rate and its 3-year rolling average. I took this average to smooth the curve even if it is very similar to the year-by-year data (1).

747 rate

Some comments on the 747 production rates (taken from its yearly deliveries):

  • The average monthly production rate since its first delivery back in 1969 has been: 2.7 airplanes per month (above 2.25 for A380 in 2015).
  • During the first about 30-35 years (till ~2002-3) the rate fluctuated between 2 and 5 deliveries per month.
  • Since 2003 the rate has averaged 1.3.
  • For the first 10 years of the 747 programme (as the A380 is just about to complete that first decade of deliveries), its production rate averaged 2.9 aircraft per month.
  • Even if not reflected in the graphic, for information, Boeing has announced that it would decrease production rate down to 0.5 airplanes per month (6 a year) from September 2016.

Time will tell if the rate for the A380 is sustainable and whether its market rebounds.

(1) I took 3 years to make the rolling average as the fact of confirming in 2016 a delivery rate decrease to be effective from 2018 may give an idea of lead times.

Leave a comment

Filed under Aerospace & Defence