This post is to compare the compensation of Airbus and Boeing CEOs, with the recently published information of 2025 fiscal year, to have a record of the evolution (1) and for quick reference in different conversations.
As both Boeing and Airbus are public companies, the information about their CEOs compensation is public and can be found in the annual report and proxy statement from each one. I just share the information and sources below for comparison and future reference.
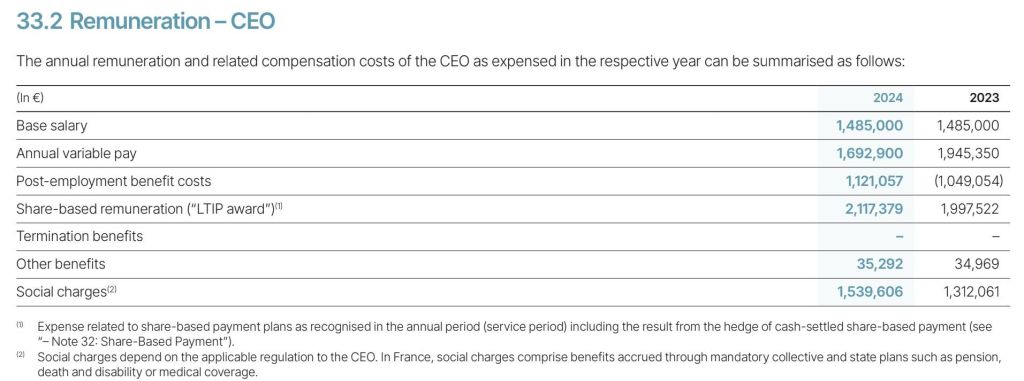
Airbus CEO, Guillaume Faury’s 2025 compensation (financial statements here, PDF, 2.1 MB, page 50):
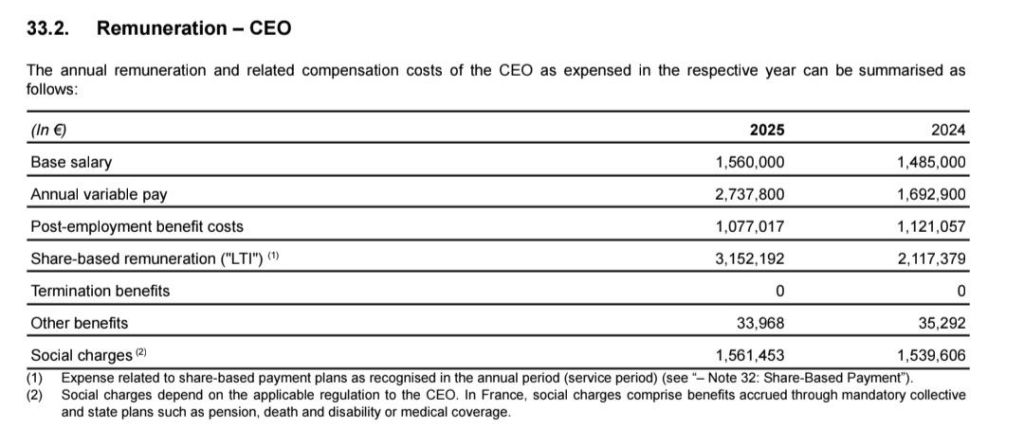
Faury had his base salary increased by 5% to 1.56M€ (which had been frozen in previous years and still at the level of 10 years ago). Variable pay increased by 62% to 2.74M€, post-employment benefit costs slightly decreased, share-based remuneration increased by 49% to 3.15M€ and social charges and other benefits slightly changed. Thus, the overall compensation at 10.12M€ increased 27% vs 2024 level (7.99M€) thanks mainly to the variable pay and share-based remuneration.
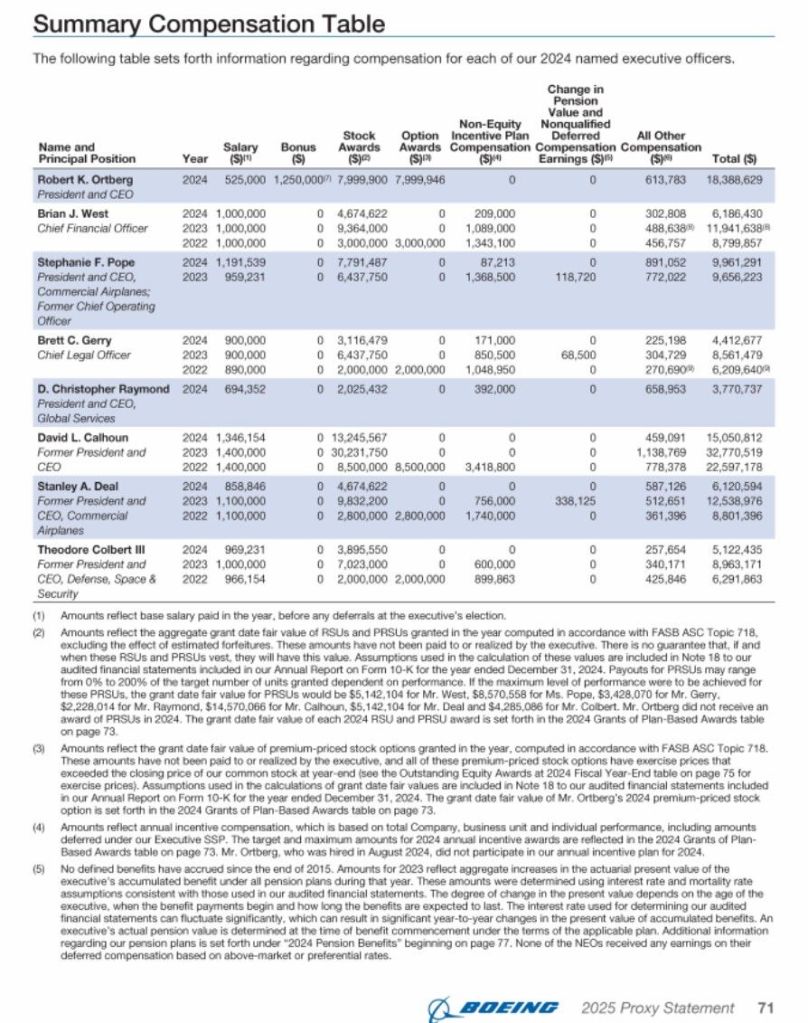
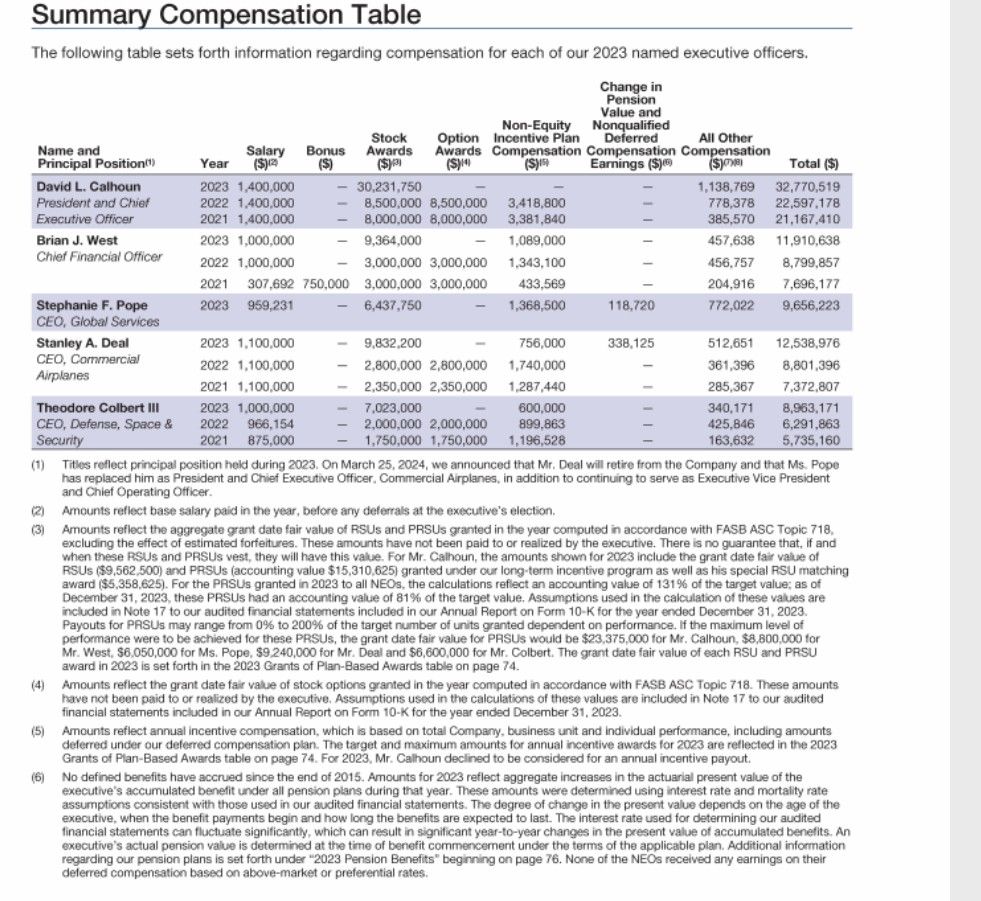
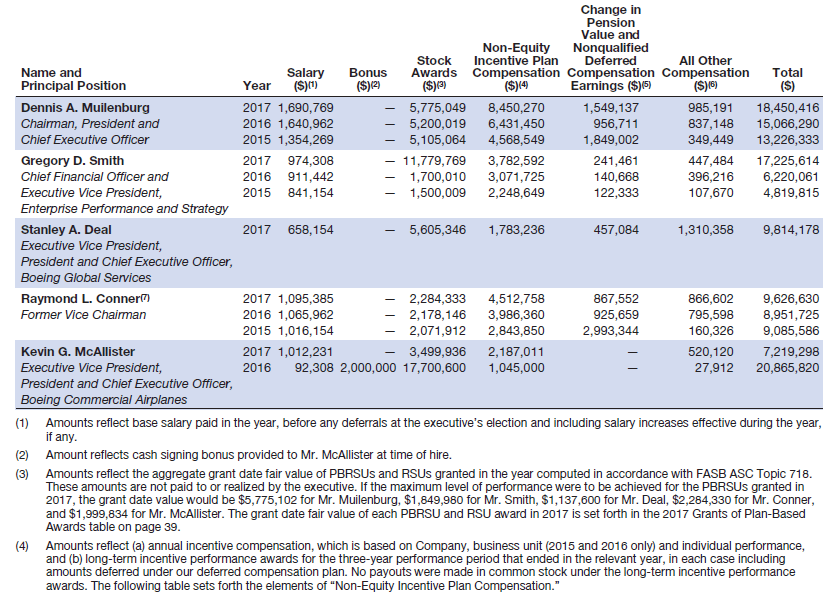
Boeing CEO, Robert Kelly Ortberg’s 2025 compensation (2026 proxy statement here, page 69):

Robert Kelly Ortberg had a base salary of 1.5M$ (up from 1.3M$ in 2023 for David Calhoun), received 17.5M$ in stocks and options based awards (9% up vs 2024), other 3.9M$ in non-equity incentive plan compensation and another 0.65M$ compensation item. The 2025 total compensation was 23.58M$, up from 2024 level but still below the 32.77M$ that Calhoun received in 2023.
Comparison. It is interesting to note that while the base salary is nearly the same in both companies, ~ 1.5 m€, the much higher stock based incentive schemes at Boeing pushed up the total remuneration for the CEO to about twice (x2.01) the one in Airbus.
(1) See the previous comparisons for the years 2013, 2014, 2015, 2016, 2017 and 2024.