Last year, I wrote in a couple of posts an introduction to the concept of the learning curve and provided a the case of the Boeing 787 in 2013 (based on figures disclosed by Boeing CFO, Greg Smith). In the first of those posts, I discussed that:
Boeing does not disclose outright what is the actual learning curve it is achieving in its program. Nevertheless, in its investor relations conferences it provides information here and there of cost savings achieved, etc. This can be interpreted as derived from learning curve effects, and would permit to build a model, even if based on scarce information.
This year again, let me quote again one of those excerpts from Boeing executives in order to update the exercise:
“On the 787-8, we’ve seen a decline in unit cost of approximately 30% over the last 175 deliveries and on 787-9, we’ve seen declines of 20% since the first delivery. Based on this progress, our production schedule and planned productivity investments, we continue to expect the 787 to be cash positive during 2015 and we still anticipate deferred production to decline shortly after we’ve achieved the 12 per month production rate in 2016. No change to these fundamental milestones.” Greg Smith, Boeing EVP – CFO at Q4 2014 Earnings Conference
As I mentioned last year, to the avid reader, and knowledgeable and savvy analyst, this paragraph is enough to deduce an actual learning curve achieved by the 787 for each aircraft model, provided that information reported by Boeing CFO, Greg Smith, was accurate.
Through the end of 2014, Boeing had delivered 212 787-8 and 10 787-9. The 787-9 were all delivered in 2014. The 212 787-8 were delivered as follows:
- 2011: 3 aircraft.
- 2012: 44 a/c.
- 2013: 63 a/c.
- 2014: 102 a/c.
Greg Smith is mentioning a cost reduction of 30% over the last 175 deliveries. As he was talking at the 2014 earnings call, we can safely assume that the figures were put up for him using deliveries and costs only through the end 2014 (and not counting info from January 2015 deliveries). That means that the cost improvements are measured theoretically from the aircraft 37th through the 212th (175). You can extract a report from Boeing website of the complete 787 deliveries here. I did it. Analysing it you see that between the beginning of December 2012 and the end of December 2014 176 787-8 were delivered (1).
Thus, the exercise to find out what learning curve Boeing achieved during that time span is as simple as to see what learning curve yields an “approximately 30% unit cost improvement” from the unit 36th (2) to the unit 212th. The beauty is that we do not even need to know the initial unit cost to perform the calculation, as the relative improvements in terms of percentages are independent of the starting point. All the information has indeed been provided by Boeing.
As I did in the blog post of the last year, in this first graph below I just plotted some generic learning curves, from 95% to 75%. This form of representation provides a good view of how learning is intense at the beginning of the production process and it stabilizes later on. It also shows well how learning is more intense and cost reductions are bigger for a 75% curve than for a 95% curve.

Generic learning curves.
However, in the previous curves it is difficult to distinguish the 36th and the 212th units which are needed for the calculation. Thus, I plotted the same curves in a log scale for the numbers of units produced in the graphic below:
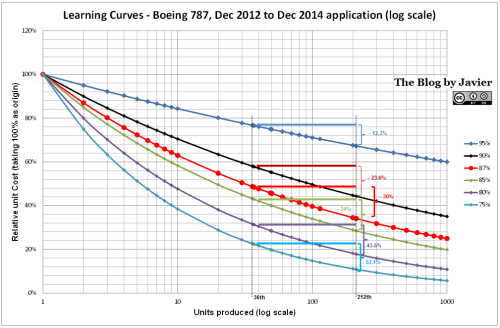
Boeing 787 learning curve over 176 units through Dec 2014 calculation, delta unit cost between 36th & 212th units.
In this second graphic I added the information of what relative cost reduction is achieved between the 36th and the 212th units for each of the curves (3).
To make sure that readers are not lost, let’s take the 87% curve (in red). Following that curve, the unit cost of the 36th unit produced is a 48.7% of the 1st unit cost, whereas the unit cost for the 212th unit produced is a 34.1% of the 1st unit cost. The difference is then 48.7% – 34.1% = 14.6%, which represents a 30.0% cost reduction from the 36th unit cost. If you follow the same calculation for each of the curves, you will obtain the following unit cost improvements between 36th and 212th units:
- 95% curve: -12.3% unit cost improvement
- 90% curve: -23.6% unit cost improvement
- 87% curve: -30.0% unit cost improvement
- 85% curve: -34.0% unit cost improvement
- 80% curve: -43.5% unit cost improvement
- 75% curve: -52.1% unit cost improvement
Thus, from the information provided by Boeing of units delivered and unit cost improvement (“approximately 30%″, Greg Smith) we can deduce that from December 2012 through December 2014 the average learning curve that the 787 program has achieved is about 87%. Thus, in line with aerospace average indicated by NASA (85%), or in line with the reported 84% achieved in the 777. Though a bit lower than that calculated for 2013 (see here last year’s post). We can interpret that mismatch as either as a minimum error inherent of these estimates (85% vs. 87%) or that indeed the rate of improvement has somehow slowed down in 2014 in comparison to 2013.
Had Boeing been able to achieve effectively a 85% curve in the last 175 deliveries, bear no doubt that the message from Greg Smith would have been along the lines of an approximate 35% cost reduction (being the mathematical result 34%), instead of the reported 30%.
All these numbers refer to the 787-8. Now, remember that Boeing CFO also indicated that “on 787-9, we’ve seen declines of 20% since the first delivery”.
Here, the calculation that needs to be done is the same. 787-9 deliveries started in 2014. If we assume that Greg’s comment referred only to 2014 deliveries (not 2015 ones), then the calculation must be made on 10 787-9 delivered between June and December 2014. Here the learning curve obtained is a 93.5% ~87-88% (5) (6).
—
(1) I guess Greg Smith rounded to 175, but his “decline in unit cost of approximately 30% over the last 175 deliveries” refers to actually some fixed internal monthly reports and is based on 176 deliveries (not 175). (4)
(2) Taking into account the note (1), I will use 176 aircraft and deliveries from the 36th aircraft through the 212th.
(3) Bear in mind what a relative cost reduction is in contrast to the fact of relative costs represented in the vertical axis as percentages of the initial cost (100%).
(4) The taking of 175 instead of 176 aircraft practically does not change the result. For the same 87% curve the calculated cost reduction in one case is 30% and in the other 29.6%.
(5) This is in line with the slow down of the learning curve for the 787-8 comparing 2013 result with the result along the time span December 2012-December 2014.
(6) I initially calculated 93.5% as a result of a 20% cost reduction between the 1st and 10th units produced. However, as Matt B pointed, the first 3 787-9 have not been delivered (though they are units produced from which there was a learning effect). When you calculate what is the result for a 20% cost reduction between units 4th and 13th (the first 10 delivered), you get a curve between 87-88%, more or less the same one than for 787-8. Thus, it seems than at the beginning of the 787-8 production they went along a 85% curve that has slowed to a 87% for both models.
