Tag Archives: forecast

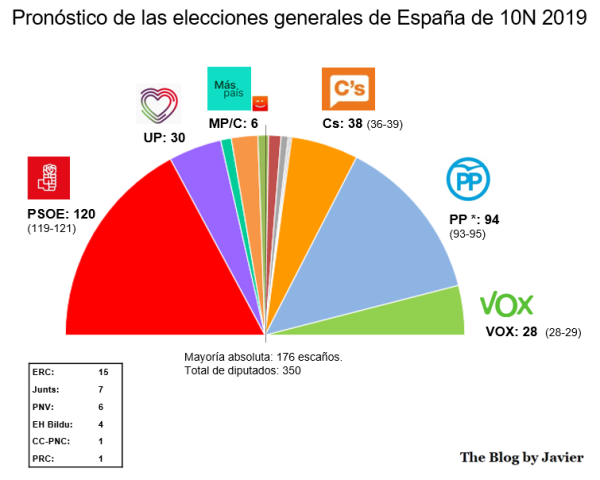
Mi pronóstico de las elecciones generales de España del 10N 2019

De nuevo, con la ocasión de las elecciones generales en España el próximo domingo 10 de noviembre, quería aprovechar para hacer un pronóstico de las mismas.

La metodología de mi ejercicio es simple: me he construido una base de datos con los porcentajes de voto por partido y provincia a partir de los resultados de las últimas elecciones generales y autonómicas desde 2011. Y, a partir de esos resultados, viendo las tendencias, he intentado pronosticar el porcentaje de voto de cada partido en cada provincia, lo que después, haciendo uso del sistema de reparto D’Hondt, proporciona los escaños.

Para hacer ese pronóstico me he basado principalmente en mi “gut feeling” sin mirar qué dicen las encuestas. Debo aclarar que el ejercicio no se trata de una encuesta (no he ido llamando a nadie), ni de una media de encuestas.

Como recordatorio: en España tenemos 52 circunscripciones (provincias más Ceuta y Melilla) que aportan desde 1 diputado (Ceuta y Melilla) a 37 (Madrid). El total son 350 y la mayoría absoluta se consigue con 176 escaños.

Dicho esto, la tabla y la gráfica siguientes resumen todo el trabajo:

Arco_2019_10N

Pronostico detallado_2019_10N

Me sale que las elecciones las ganaría el PSOE, con unos porcentajes de voto a escala nacional para los grandes partidos en el orden de:

  • PSOE: 27.7 %
  • PP: 21.6 %
  • Ciudadanos: 12.1 %
  • Unidas Podemos: 11.6 %
  • VOX: 10.4 %

Como curiosidad, los siguientes bloques obtendrían las siguientes sumas de escaños:

  • PP + Cs + VOX : 160
  • PSOE + Cs : 158
  • PSOE + Unidas Podemos + Más País / Compromís : 156


Leave a comment

Filed under Miscellanea

Mi pronóstico de las elecciones generales de España del 28A 2019

De nuevo, con la ocasión de las elecciones generales en España el próximo domingo 28 de abril, quería aprovechar para hacer un pronóstico de las mismas.

La metodología de mi ejercicio es simple: me he construido una base de datos con los porcentajes de voto por partido y provincia a partir de los resultados de las últimas elecciones generales y autonómicas desde 2011. Y, a partir de esos resultados, viendo las tendencias, he intentado pronosticar el porcentaje de voto de cada partido en cada provincia, lo que después, haciendo uso del sistema de reparto D’Hondt, proporciona los escaños.

Para hacer ese pronóstico me he basado principalmente en mi “gut feeling” sin mirar qué dicen las encuestas. Debo aclarar que el ejercicio no se trata de una encuesta (no he ido llamando a nadie), ni de una media de encuestas.

Como recordatorio: en España tenemos 52 circunscripciones (provincias más Ceuta y Melilla) que aportan desde 1 diputado (Ceuta y Melilla) a 37 (Madrid). El total son 350 y la mayoría absoluta se consigue con 176 escaños.

Dicho esto, la tabla y la gráfica siguientes resumen todo el trabajo:

Arco_28A

Pronostico detallado_28A

En contra de lo que dicen la mayoría de las encuestas (a falta de 3 semanas) me sale que las elecciones las ganaría el PP en vez del PSOE, con los siguientes porcentajes de voto a escala nacional para los grandes partidos:

  • PP: 24.7 %
  • PSOE: 23.2 %
  • Unidas Podemos: 15.6 %
  • Ciudadanos: 13.8 %
  • VOX: 9.3 %

Como curiosidad, los siguientes bloques obtendrían las siguientes sumas de escaños:

  • PP + Cs + VOX : 172
  • PSOE + Cs : 138
  • PSOE + Unidas Podemos + Compromís : 149

Finalmente, aunque no tiene mucha utilidad dejo también el típico mapa por provincias con el color del partido que me sale más votado en cada provincia:

las-provincias-de-espana_2

Leave a comment

Filed under Miscellanea

My forecast of Boeing Commercial Airplanes 2017 revenues

Next January 31st, Boeing will hold an earnings conference where it will announce its Q4 and full 2017 year financial results, including the revenues of each of its units.

Three weeks ago, on January 9th, Boeing already issued a press release where it announced its deliveries and orders for 2017, mainly:

  • 763 commercial aircraft delivered (including 529 of the 737 family, or 136 787).
  • 912 net orders (after cancellations) (including 745 of the 737 family).

The release mentions “912 net orders, valued at $134.8 billion at list prices“, however those list prices are discounted, nothing new, and with an estimate of that discount I’ll try to guess the figure of revenues for the Boeing Commercial Airplanes division, not so much trying to be accurate in itself, but to point in advance to the increasing of the discounts as we will see below.

Where can we find Boeing list prices? Boeing host them in their site, these have just bee raised 10 days ago about 4% (see this comment about it). The previous prices dated from March 2017, when Boeing raised them again, that time by about 2% from its 2015 prices (untouched in 2016). To compute 2017 revenues and estimate of discount I use 2017 prices, not the latest ones.

If Boeing didn’t apply those discounts, the value of the 763 aircraft delivered in 2017 would yield revenues of above 118 bn$. To come to a ballpark figure, I will take the latest figure of discounts that I had calculated with 2016 and earlier figures, being the latest ~46%.

Discount evolution_2016

If I plug that discount into the 2017 list prices of the fleet mix of the 763 commercial aircraft that Boeing delivered we would come to a figure of revenues of 62.1 bn$. However, see below what was Boeing’s own guidance in their Q3 earnings release:

2017 Q3 Financial Outlook

Boeing’s 2017 Financial Outlook at Q3 2017 earnings press release.

At three months to the year end (Q3), they forecast between 760 and 765 deliveries, which turned in 763. At the same time they pointed to revenues between 55.5 – 56.5 bn$… and not above 62 bn$. I believe they will exceed their own estimate, but not by 5 bn$, that is why I see that their discounts have been greatly increased in the last 2017. They must have had a bad time in escalating prices of aircraft sold years ago, delivered in 2017 but with escalation conditions much lower than ongoing list prices.

With all these ingredients… my forecast is: 57.0 bn$.

Some comments to it:

  • My forecast is a bit more optimistic than their upper bracket (56.5) which may be slightly conservative.
  • The implied discount of my revenues forecast would be in the ~ 50% range.

(1) See here a couple of such forecasting revenues exercises that I did for Boeing’s 2014 and 2015 revenues.

(2) See here the latest detailed calculation of discounts that I posted in 2015.


2 Comments

Filed under Aerospace & Defence

Review of Boeing Current Market Outlook 2016

Last week, on the first day of Farnborough air show, Boeing Commercial published its yearly update of the Current Market Outlook (CMO) for the next 20 years of commercial aircraft market (2016-2035).

I have just compared the figures for passenger aircraft of the last two years’ CMOs:

CMO 2016 vs 2015 comparison

CMO 2016 vs. 2015 comparison.

Some comments to it:

  • You can see that the total number of new aircraft delivered has slightly increased from 37,130 to 38,690, a 4.2%, which is consistent with the 4.8% traffic increase (1) that Boeing predicts (2).
  • The volume (Bn$) increases by a larger percentage, 7.2% (380Bn$) up to 5.66 Trn$… this is due mainly to the increase in (3):
    • single-aisle aircraft expected sales in volume (8%, +230M$) and aircraft (+1,410), and
    • small wide-body segment with 220 more aircraft (+5%) and an increase in volume of 80 Bn$ (+7%).
  • Three years ago, I wrote about a sudden change between CMO 2013 and CMO 2012 of the mix in wide-bodies; in this respect, CMO 2015 is consistent with last year’s one, showing simply an  increase in demand for both sub-segments.
  • It is interesting to note how Boeing continues to downplay the large aircraft segment at the moment when a A380 is discussed, however this year’s figures are increased in relation to CMO 2014 in terms of both aircraft and volume.

This year study’s figures and presentation focus again on single-aisle (737 MAX 8, “Medium-size aircraft are at heart of single-aisle market“) and small wide-bodies (787, “opening new markets”), the products to be pushed by the sales force.

Find below the nice infographic [PDF, 464 KB] that the guys from Boeing have put up together:

Boeing Commercial Aviation Market Forecast 2016-2035 infographic.

Boeing Commercial Aviation Market Forecast 2016-2035 infographic.

As always, I recommend going through the CMO, as you can learn a lot about the business: from global numbers, to growth, traffic figures, fleet distributions, forecasts, etc… You may find the presentation [PDF, 4.7 MB], a file [XLS, 0.6 MB] with all the data or the full CMO report [PDF, 4.1 MB].

This year again, together with the CMO, Boeing provides two interesting papers from a couple of years ago: Key Findings on Airplane Economic Life [PDF, 0.3MB, dating from August 2013] and A Discussion of the Capacity Supply -Demand Balance within the Global Commercial Air Transport Industry [PDF, 0.6MB, dating from August 2013].

(1) Traffic increased measured in RPKS (revenue passenger kilometers) in billions.

(2) These two ratios, 4.2% fleet demand and 4.8% traffic growth, point to an implicit increase in the average size of the aircraft in fleet and / or a higher utilization of the aircraft (higher availability).

(3) These two segments (single-aisle and small wide-body) saw as well the largest increases in number of aircraft and volumes in the CMO of 2015 in relation to 2014.

(4) Find the reviews I wrote comparing 2015 CMO with 2014 CMO2014 CMO with 2013 CMO and 2013 CMO with 2012 CMO.

Leave a comment

Filed under Aerospace & Defence

Mi pronóstico de las elecciones generales de España del 26J 2016

De nuevo, con la ocasión de las elecciones generales en España el próximo domingo 26 de junio, quería aprovechar para hacer un pronóstico de las mismas como ejercicio de aprendizaje (1) y para ver si el acierto que tuve con las del 20 de diciembre (2) fue flor de un día.

La metodología es simple: me he construido una pequeña base de datos con los porcentajes de voto por partido y provincia a partir de los resultados de las últimas 2 elecciones generales (2015 y 2011) y de las últimas 2 elecciones autonómicas (2015, 2012-2011). Y, a partir de esos resultados, viendo las tendencias, he intentado pronosticar el porcentaje de voto de cada partido en cada provincia, lo que después, haciendo uso del sistema de reparto D’Hondt, proporciona los escaños.

Para hacer ese pronóstico me he basado principalmente en mi “gut feeling” y para pocas provincias he mirado a ver qué decían las encuestas (y en algunos de esos casos ha sido para reafirmarme en mis números contra los otros… veremos). Debo aclarar que el ejercicio no se trata de una encuesta (no he ido llamando a nadie), ni de una media de encuestas (3).

Generalmente, cuando una encuesta a nivel nacional nos dice “el PP va a conseguir un 29% y entre 118-125 escaños” nos da un resultado que se compone de la suma de muchas provincias, que no nos sirve para ver qué va a pasar en nuestra provincia en particular. El CIS, sin embargo, ofrece una encuesta con más de 17 mil encuestados, donde indica su estimación de reparto de escaños por provincias y de porcentajes de voto globales (4). Y esa visión, mucho más completa, es la misma que quiero replicar con mi pronóstico.

Como recordatorio: en España tenemos 52 circunscripciones (provincias más Ceuta y Melilla) que aportan desde 1 diputado (Ceuta y Melilla) a 36 (Madrid) (5). El total son 350 y la mayoría absoluta se consigue con 176 escaños.

Dicho esto, la tabla y la gráfica siguientes resumen todo el trabajo:

Como quedaría el arco parlamentario.

Cómo quedaría el arco parlamentario.

Pronóstico detallado.

Pronóstico detallado.

Esta vez quería dejar, acompañando el pronóstico en escaños de arriba, también la tabla origen con los porcentajes debajo (para los 4 grandes partidos). Esta tabla, en combinación con la de escaños, permite al lector ver cómo de cerca están uno u otro partido según el pronóstico, y qué porcentaje de voto más tendría que sacar un partido para obtener ese último escaño que se lleva otro. (6)

Porcentajes pronosticados por provincia.

Porcentajes pronosticados por provincia.

Una vez compartido el pronóstico, no voy a hacer ningún análisis del mismo, dado que puede estar muy o poco equivocado; mejor esperar a tener los resultados reales.

(1) Ya en 2011, tras las elecciones generales hice el ejercicio de repartir con distintos métodos (proporcional vs D’Hondt, circunscripciones provinciales vs única…) y el ejercicio me resultó útil.

(2) Ver aquí un análisis de lo acertado de mi pronóstico para el 20D de 2015 con los resultados finales.

(3) Ver por ejemplo los que hace Kiko Llaneras aquí.

(4) Ver más abajo las tablas del CIS. La fuente aquí.

(5) En estas elecciones León pierde un escaño en favor de Valencia.

(6) Esta tabla puede tener muchos errores parciales (pequeñas desviaciones del porcentaje del resultado) sin que ello necesariamente haga que el pronóstico de escaños sea incorrecto.

CIS 26J tabla escanos

CIS 26J tabla resumen

1 Comment

Filed under Miscellanea

Forecasting France Euro 2016

I have a work colleague who not only is a tremendous negotiator and aircraft seller but also has a great sense of humor and manages in his free time late in the night to set up a contest for office staff to try to guess winners, matches’ scores, top scorers, etc., of major international soccer competitions. The France Euro 2016 which starts this afternoon could not be missed. Nacho managed to set up the contest in time.

In this post I am going to explain how I went about forecasting the results of the UEFA Euro 2016.

“when in doubt, build a model”, Nate Silver.

The readers of this blog may already know how much I do like to build models to produce forecasts, guesstimates, etc. In relation to forecasting this UEFA Euro 2016 there is some background that has shaped my mind in relation to the subject in the recent years, let me give you some hints:

Having shared this background, you may understand that I tried to remove all the beauty of guessing and my football knowledge out of the forecasting process (1).

I rather made use of:

  • ESPN Soccer Power Index (SPI) ranking, introduced by the economist Nate Silver. I used its offensive and defensive scores plus weight for each of the scores based on a tip indicating that in competitive matches the defensive factor tends to be slightly more important (see “A Guide to ESPN’s SPI rankings”) (2).
  • The frequency of different scores in the group phases of the Euro 2012 and the World Cup 2010, the in the round of 16, quarter finals and semi-finals.

Frenquency

  • A few simple rules about how to allocate results given the difference between SPI ratings of the two nations playing each match. (3)
  • The total number of goals during group phases the latest Euro and World Cup. In order to cross check that the total numbers of goals that my forecast yielded was in check with previous competitions.

It may sound very complex. It is not. It requires a bit of reading (which most of it I did years ago), retrieving the latest ratings, giving it a bit of thought to set up the model and then, not even looking at the names of the teams, you go about allocating the scores based on raw figures. Let’s see how my forecast fares this time! (4)

Porra Euro 2016

Les grandes personnes aiment les chiffres” (5), the Little Prince.

(1) In fact I have not watched a single national team football match from any country since the World Cup in Brazil in 2014.

(2) See here the blog post I published yesterday in which I made a more thorough review of the ESPN SPI index.

(3) I set up rules like “if the difference of the combination of indices of the two nations is below this threshold, I take it as a draw, if it is between x and y as victory by 1 goal, if higher…”, etc.

(4) This way of forecasting allowed me to finish 4th out of 47 in 2010, 15th out of 87 in 2014. As it removes biases it allows to be better than the average, though it prevents you of guessing outliers, gut feelings, etc.

(5)”Adults love figures”.

Note: In the blog post from yesterday I mentioned that the latest complete ranking from the ESPN SPI index that I could retrieve dated from October 2015. That is the one I have used, therefore, Germany results as winner. Of the latest ranking, covering the Top 25 nations, only 13 countries of the 24 competing at the Euro 2016 are included. I could have set up an hybrid ranking taking the latest rankings and ratings for the top 13 from June and using the October figures for the lower 11 teams. I decided to go on with a single set of data. If I had done so, the maing changes would have come from the semifinals onwards. France would have appeared as winner instead of Germany. We’ll see if that was a good decision.

Leave a comment

Filed under Sports

Twin-aisle aircraft deliveries 20-year forecast (update 2015)

In a previous post I shared a graphic with the “Commercial wide-body airplanes’ deliveries per year, 1969-2015” (see below). I then commented:

“Looking backwards it’s clear that 2015 was a peak in wide-bodies deliveries. Looking forward it may have been a short-term peak, but looking further ahead it is not so clear.”

Commercial wide-body airplanes' deliveries per year, 1969-2015.

Commercial wide-body airplanes’ deliveries per year, 1969-2015.

Last November, I published a post, “Airbus vs. Boeing, comparison of market forecasts (2015)“, with the following table that compares Airbus’ Global Market Forecast and Boeing’s Current Market Outlook:

Comparison of Airbus GMF and Boeing CMO 2015-2034.

Comparison of Airbus GMF and Boeing CMO 2015-2034.

If we focus on the twin-aisle segment, we see that both companies are very closely forecasting between 7,500 and 7,600 passenger aircraft deliveries (with less than 90 aircraft of difference, a 1.2% deviation). The forecast for the freighters is not shown in the table but it is also very similar for the segment, between 718 (Airbus’ view) and 800 (Boeing’s) freighter aircraft. In combination, each company foresees between  8,290 (Boeing view) and 8,297 (Airbus’) airplanes’ deliveries in the segment. Remarkably similar and definitely converged from years ago.

In the very large aircraft segment both forecasts do not converge. But since the figures of deliveries are an order of magnitude lower, I will focus on what they define as “twin-aisle” segment.

Let’s put forward again the question: was 2015 a peak year in terms of twin-aisle deliveries?

Quick math: if we take those ~8,300 aircraft to be delivered in the next 20 years, we arrive at an average of 415 aircraft per year. That figure excludes the very large aircraft. In 2015, there were 367 deliveries of twin-aisles (excluding A380 and 747):

  • A330: 103
  • A350XWB: 14
  • 767: 16
  • 777: 98
  • 787: 135
  • IL-96: 1

Thus, in 2015 we would have been far from the peak. If we simply linearized those 8,300 deliveries from 2015 levels up to 2034, we would get the following profile:

Twin-aisle deliveries historic and 20-year forecast.

Twin-aisle deliveries historic and 20-year forecast.

The reader may correctly think that market forecast figures are not engraved in stone and are rather optimistic. Fair enough.

Both forecast have been rather accurate in the past forecasting traffic growth. Not necessarily in forecasting the number of aircraft in each specific segment. See the post, “Aircraft market forecasts accuracy (update 2014)“,  in which I analyzed Boeing CMO forecast of 1999 with the actual fleet at the end of 2013. See the result below:

Comparison of aircraft fleet at year-end 2013: 1999 forecast vs. actual (sources: Boeing CMO 1999 and 2014).

Comparison of aircraft fleet at year-end 2013: 1999 forecast vs. actual (sources: Boeing CMO 1999 and 2014).

Thus, in 2013 there were 27% less twin-aisle aircraft than what had been predicted in 1999.

If 2015 market forecasts were off the mark in the same proportion (27%), that would mean that instead of 8,300 airplane deliveries in the next 20 years we would see about 6,050… meaning ~300 airplanes per year in the 20-year span.

In that case, we might have seen the peak.

Let’s take a look at current backlogs at the end of 2015:

  • Airbus: 1,112 a/c
    • A330 family: 350 a/c
    • A350: 762 a/c
  • Boeing: 1,383 a/c
    • 767: 80 a/c
    • 777 family: 524 a/c
    • 787: 779 a/c

Thus, at the end of 2015 the combined backlog (firm) stood at ~2,500 airplanes. That is a 30% of the 8,300 forecast, and a 41% of the 6,050 aircraft (i.e. forecast reduced in 27%).

The sceptic reader could still have doubts of the quality of the backlog (i.e., some customers may go through troubled waters and cancel orders).

Last year, I published a post, “Boeing 787 orders, cancellations, deliveries & backlog through 2014“, in which I showed the orders and cancellations of the 787 programme since its launch. See the summary graphic below:

787 orders, cancellations, deliveries and backlog through 2014.

787 orders, cancellations, deliveries and backlog through 2014.

The 787 programme experienced serious delays and industrial issues from 2009 to 2013 in the midst of the worst financial and economic crisis since the Great Depression of the 1930s. Through 2014, the programme had suffered 247 cancellations out of 1,318 gross orders, that is almost 19% of cancellations.

I believe that 19% can be considered an upper ceiling of how much of the current 2015 twin-aisle backlog (~2,500 a/c) could be considered as dubious. Thus, at least about 2,000 firm orders could be seen as rather secured.

Let’s see at the question (was 2015 a peak year?) from a different perspective: in the immediate coming years, what are the announced production rates?

Thus, according to the announced production rates and targets, in 2016 we should see about 380 twin-aisle combined deliveries, higher than the 367 we saw in 2015.
Leave a comment

Filed under Aerospace & Defence

My forecast of Boeing Commercial Airplanes 2015 revenues

Last year, I put the model I use to estimate the discounts applied by Boeing on the sales of its commercial aircraft to the test of trying to forecast in advance what would be Boeing Commercial Airplanes division revenues for the year. In this post I want to repeat that exercise (1).

The latest estimate of the discounts that I made, in 2015 yielded a 47% (same as the previous year). See here the post in which that estimate was explained (using Boeing’s reported figures of deliveries, orders, list prices and revenues) and below its evolution.


Boeing Average Discount Evolution, through 2014.

Boeing Average Discount Evolution, through 2014.

As of today, January 11th, Boeing revenues for the full year 2015 have not been announced yet. Boeing’s investors relations website informs that the 2015 earnings conference call will take place on January 27th.

The process and sources with which I will reach to my forecast are described below:

  1. See here Boeing (net) orders for the year 2015: 768 aircraft among all models.
  2. See here Boeing deliveries in the year 2015: 762 aircraft among all models.
  3. See here Boeing 2015 list prices.
  4. See in the above curve the average discount I will use: 47% (this is the figure calculated with 2014 data, and that is a hypothesis that will be put to test with how accurate the forecast turns out).
  5. See here [PDF, 839KB] Q3 2015 earnings press release. I use it to see how were faring in 2015 Boeing Commercial Airplanes services, deducing it from the reported figures of Sales of Services, Boeing Capital and Global Services & Support, reported in different pages of the release. Up to end September 2015, the services figures were increasing in comparison to 2014 figures. I will assume the global figure to follow the same proportional increase; arriving at ~1,636 m$ for Boeing Commercial Airplanes services (remember, this figure will not be actually explicitly reported).

With all these ingredients… my forecast is: 66.98 bn$ (2).

In the 2015 Q3 report you can see Boeing’s own guidance for year-end figures:

Boeing’s 2015 Financial Outlook at Q3 2015 earnings press release.

Boeing’s 2015 Financial Outlook at Q3 2015 earnings press release.

Some comments:

First, you can see that my forecast (66.98 bn$) is about a billion dollars more optimistic than Boeing’s own outlook 3 months ago, 65.0-66.0 bn$  (3), which was even lifted from 64.5 – 65.5 in the 2015 Q3 earnings release.

Second, in the 2015 Q3 release, you can see the revenues up to end September (below). In them, you can see that up to then, revenues of Boeing Commercial Airplanes had increased 16% in relation to 2014. My forecast is a bit less optimistic here for the year-end as it estimates the increase in revenues will be +12% (that is due to lower deliveries in the Q4 of 2015).

Boeing Commercial Airplanes revenues Q3 2015.

Boeing Commercial Airplanes revenues Q3 2015.

Final comment: if Boeing managed in 2015 to command better prices on delivered aircraft, the figure will be even higher. If the figure is lower than the 66.0 bn$, and in line with Boeing’s Outlook, it’ll mean that the market is forcing Boeing to apply ever higher discounts to their published list prices.

I am now looking forward to January 27th and Boeing’s earnings call!

Note: After Boeing’s earnings call, in order to compare the results with the forecast and evaluate its accuracy I will either write an update of this post or a new entry.

(1) See here the post from last year, in which I missed the revenues by just a 0.3%, closer than analysts and Boeing’s own financial guidance provided in their 2014 Q3 earnings release.

(2) To be more precise the forecast from the model is 66,978 m$.

(3) As I mentioned in last year’s post, if my forecast turns out correct some may be tempted to say that this is the usual trick played by CFOs: to present better figures (in the results) than expected (in the outlook).

3 Comments

Filed under Aerospace & Defence

Wide-body mix in 17 years of Boeing CMOs

Two years ago, I wrote a post showing the puzzling change in Boeing’s predicted mix of twin-aisle sales, between small and medium wide-bodies (“Wide-body mix in 15 years of Boeing CMOs”) (1). A few days ago I wrote a post about the publishing by Boeing of its Current Market Outlook for 2015-2034.  As I noted in that post, this year’s CMO is consistent with last year’s figures, i.e., the larger share of the forecasted market corresponds to small wide-bodies (787s from Boeing’s perspective). Recall the numbers:

  • small wide-bodies: 4,500 a/c in CMO2015 (passenger aircraft only),
  • medium wide-bodies: 2,990 a/c in CMO2015 (same figure as in CMO2014).

In the sub-segment of the medium wide-bodies passenger aircraft figures for  have remained constant and there is a slight increase in freighters (60 a/c); whereas for small wide-bodies the main increase is seen in the passenger aircraft (+230 a/c).

Since I keep a collection of CMOs from many years, I will include again a comparison going 17 years back…

Twin-aisle mix distribution (Boeing CMO 1998-2015, includes both passenger and freighter aircraft).

Twin-aisle mix distribution (Boeing CMO 1998-2015, includes both passenger and freighter aircraft).

Seeing at the graphic, made using Boeing’s forecasts’ figures:

  • During the first 5 years (1998-2003) the trends are quite constant, seeing medium wide-bodies a slightly higher demand.
  • From 2003 to 2007, the mix is reverted, possibly to favour the launch of the 787.
  • In 2008 the CMO did not provide the split.
  • From 2009 to 2013, you can see that both trends in the forecasts are erratic… why? Only Boeing knows. (2)
  • From 2013 to 2015, it seems that the trends are stabilized again in a higher demand for 787-size aircraft.

(1) Last year, I made an update of that post with the consolidated view of the last 16 years, find it here.

(2) A speculation: a Boeing-internal need to sell the concept of the 777X?

Leave a comment

Filed under Aerospace & Defence

Review of Boeing Current Market Outlook 2015

Just ahead of Paris air show, Boeing Commercial published its yearly update of the Current Market Outlook (CMO) for the next 20 years of commercial aircraft market (2015-2034).

I have just compared the figures for passenger aircraft of the last two years’ CMOs:

CMO 2015 vs 2014 comparison.

CMO 2015 vs 2014 comparison.

Some comments to it:

  • You can see that the total number of new aircraft delivered has slightly increased from 35,930 to 37,130, a 3.3%, which is consistent with the 4.9% traffic increase (1) that Boeing predicts (2).
  • The volume (Bn$) increases by a larger percentage, 6% (320Bn$)… this is due mainly to the increase in:
    • single-aisle aircraft expected sales in volume (8%, +210Bn$) and aircraft (+210), and
    • small wide-body segment with 230 more aircraft (+5%) and an increase in volume of 100Bn$ (+9%).
  • Two years ago, I wrote about a sudden change between CMO 2013 and CMO 2012 of the mix in wide-bodies; in this respect, CMO 2015 is consistent with last year’s one, showing simply a slight increase in demand for both sub-segments.
  • Interesting to note how Boeing continues to downplay the large aircraft segment (-16% in terms of number of aircraft) at the moment when a A380neo is discussed.

This year study’s figures and presentation focus on single-aisle (737 MAX, “fuelling forecast”) and small wide-bodies (787, “re-shaping long-haul marketplace”), the products to be pushed by the sales force.

Find below the nice infographic [PDF, 2.1MB] that the guys from Boeing have put up together:

Boeing Commercial Aviation Market Forecast 2015-2034 infographic.

Boeing Commercial Aviation Market Forecast 2015-2034 infographic.

As always, I recommend going through the CMO, as you can learn a lot about the business: from global numbers, to growth, traffic figures, fleet distributions, forecasts, etc… You may find the presentation [PDF, 3.8 MB], a file [XLS, 0.6 MB] with all the data or the full CMO report [PDF, 6.5MB].

For a comparison between this CMO and the respective Airbus’ GMF we will have to wait until after the summer, when Airbus publishes its update. Until then, find here the comparison based on 2014 market studies.

This year together with the CMO, Boeing provides two interesting papers from a couple of years ago: Key Findings on Airplane Economic Life [PDF, 0.3MB, dating from August 2013] and A Discussion of the Capacity Supply -Demand Balance within the Global Commercial Air Transport Industry [PDF, 0.6MB, dating from August 2013].

(1) Traffic increased measured in RPKS (revenue passenger kilometers) in billions.

(2) These two ratios, 3.3% fleet demand and 4.9% traffic growth, point to an implicit increase in the average size of the aircraft in fleet and / or a higher utilization of the aircraft (higher availability).

(3) Find the reviews I wrote comparing 2014 CMO with 2013 CMO and 2013 CMO with 2012 CMO.

2 Comments

Filed under Aerospace & Defence