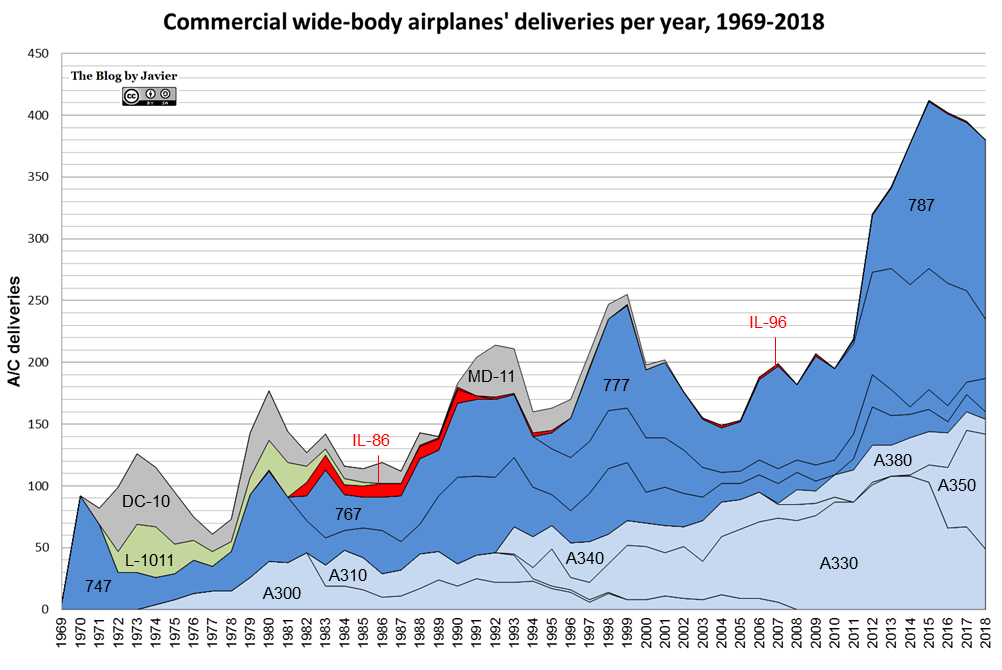
In a previous post I shared a graphic with the “Commercial wide-body airplanes’ deliveries per year, 1969-2015” (see below). I then commented:
“Looking backwards it’s clear that 2015 was a peak in wide-bodies deliveries. Looking forward it may have been a short-term peak, but looking further ahead it is not so clear.”
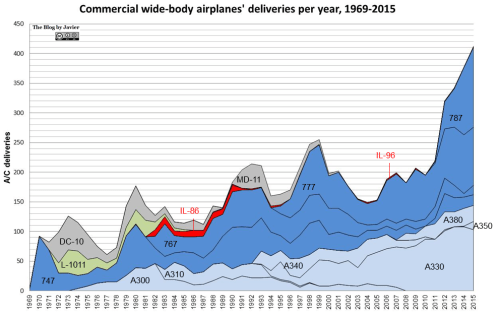
Commercial wide-body airplanes’ deliveries per year, 1969-2015.
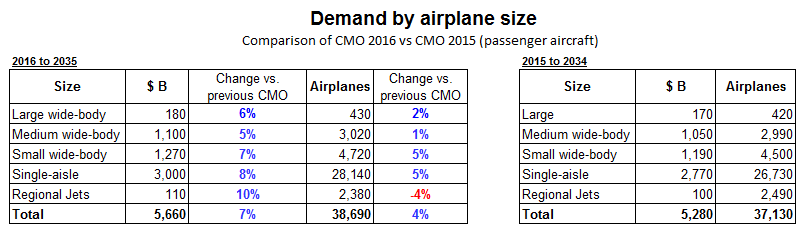
Last November, I published a post, “Airbus vs. Boeing, comparison of market forecasts (2015)“, with the following table that compares Airbus’ Global Market Forecast and Boeing’s Current Market Outlook:
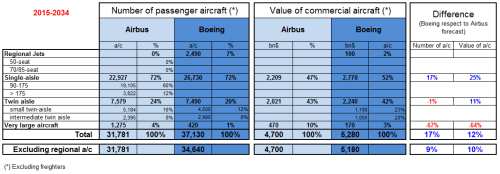
Comparison of Airbus GMF and Boeing CMO 2015-2034.
If we focus on the twin-aisle segment, we see that both companies are very closely forecasting between 7,500 and 7,600 passenger aircraft deliveries (with less than 90 aircraft of difference, a 1.2% deviation). The forecast for the freighters is not shown in the table but it is also very similar for the segment, between 718 (Airbus’ view) and 800 (Boeing’s) freighter aircraft. In combination, each company foresees between 8,290 (Boeing view) and 8,297 (Airbus’) airplanes’ deliveries in the segment. Remarkably similar and definitely converged from years ago.
In the very large aircraft segment both forecasts do not converge. But since the figures of deliveries are an order of magnitude lower, I will focus on what they define as “twin-aisle” segment.
Let’s put forward again the question: was 2015 a peak year in terms of twin-aisle deliveries?
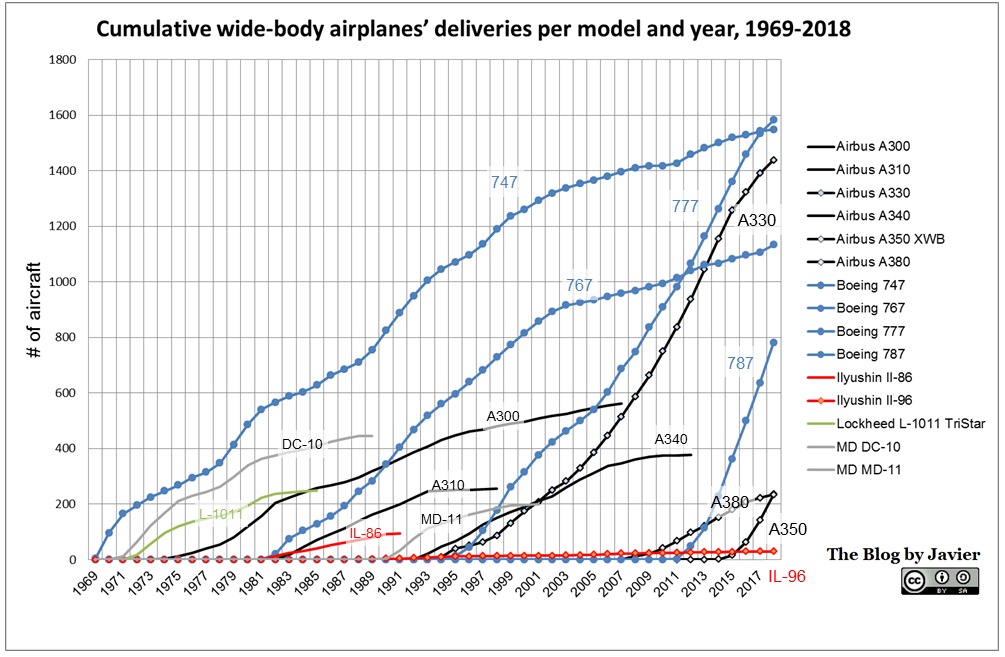
Quick math: if we take those ~8,300 aircraft to be delivered in the next 20 years, we arrive at an average of 415 aircraft per year. That figure excludes the very large aircraft. In 2015, there were 367 deliveries of twin-aisles (excluding A380 and 747):
- A330: 103
- A350XWB: 14
- 767: 16
- 777: 98
- 787: 135
- IL-96: 1
Thus, in 2015 we would have been far from the peak. If we simply linearized those 8,300 deliveries from 2015 levels up to 2034, we would get the following profile:
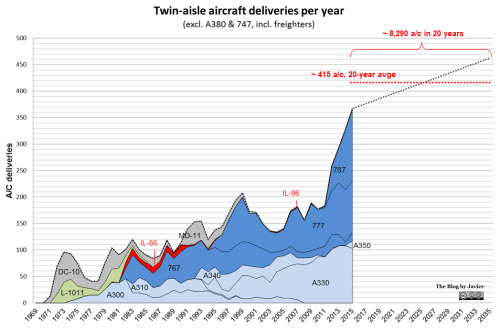
Twin-aisle deliveries historic and 20-year forecast.
The reader may correctly think that market forecast figures are not engraved in stone and are rather optimistic. Fair enough.
Both forecast have been rather accurate in the past forecasting traffic growth. Not necessarily in forecasting the number of aircraft in each specific segment. See the post, “Aircraft market forecasts accuracy (update 2014)“, in which I analyzed Boeing CMO forecast of 1999 with the actual fleet at the end of 2013. See the result below:
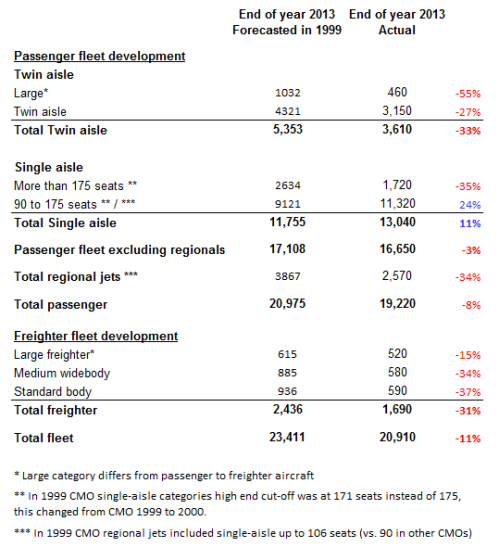
Comparison of aircraft fleet at year-end 2013: 1999 forecast vs. actual (sources: Boeing CMO 1999 and 2014).
Thus, in 2013 there were 27% less twin-aisle aircraft than what had been predicted in 1999.
If 2015 market forecasts were off the mark in the same proportion (27%), that would mean that instead of 8,300 airplane deliveries in the next 20 years we would see about 6,050… meaning ~300 airplanes per year in the 20-year span.
In that case, we might have seen the peak.
Let’s take a look at current backlogs at the end of 2015:
- Airbus: 1,112 a/c
- A330 family: 350 a/c
- A350: 762 a/c
- Boeing: 1,383 a/c
- 767: 80 a/c
- 777 family: 524 a/c
- 787: 779 a/c
Thus, at the end of 2015 the combined backlog (firm) stood at ~2,500 airplanes. That is a 30% of the 8,300 forecast, and a 41% of the 6,050 aircraft (i.e. forecast reduced in 27%).
The sceptic reader could still have doubts of the quality of the backlog (i.e., some customers may go through troubled waters and cancel orders).
Last year, I published a post, “Boeing 787 orders, cancellations, deliveries & backlog through 2014“, in which I showed the orders and cancellations of the 787 programme since its launch. See the summary graphic below:
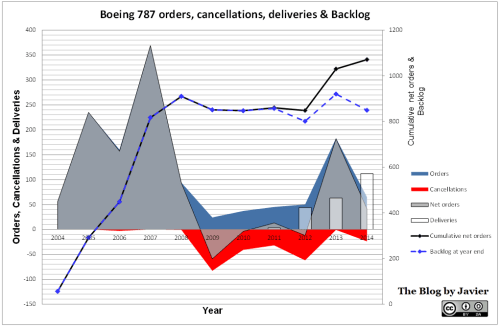
787 orders, cancellations, deliveries and backlog through 2014.
The 787 programme experienced serious delays and industrial issues from 2009 to 2013 in the midst of the worst financial and economic crisis since the Great Depression of the 1930s. Through 2014, the programme had suffered 247 cancellations out of 1,318 gross orders, that is almost 19% of cancellations.
I believe that 19% can be considered an upper ceiling of how much of the current 2015 twin-aisle backlog (~2,500 a/c) could be considered as dubious. Thus, at least about 2,000 firm orders could be seen as rather secured.
Let’s see at the question (was 2015 a peak year?) from a different perspective: in the immediate coming years, what are the announced production rates?
- Airbus: ~ 120 a/c.
- Boeing: ~ 260 a/c in 2016
Thus, according to the announced production rates and targets, in 2016 we should see about 380 twin-aisle combined deliveries, higher than the 367 we saw in 2015.