
A few years ago due to a previous job position, I got used to look at materials of the different aerospace industry associations or agencies, from the AeroSpace and Defence Industries Association of Europe (ASD), the European Defence Agency (EDA), or focusing on Spain, the TEDAE, on France, GIFAS, etc. I would do that to seek relevant figures about the business, employment, trends… Nowadays, I do that from time to time out of curiosity to see the evolution in the recent years.
The documents, yearly reports or facts and figures brochures that those institutions publish provide a good snapshot of the aerospace sector, its main players, locations, trends, civil / military split, resources invested in R&D, orders of magnitude, etc. Let’s take first a brief look at the sources and see what we can learn from them.
Europe – ASD.
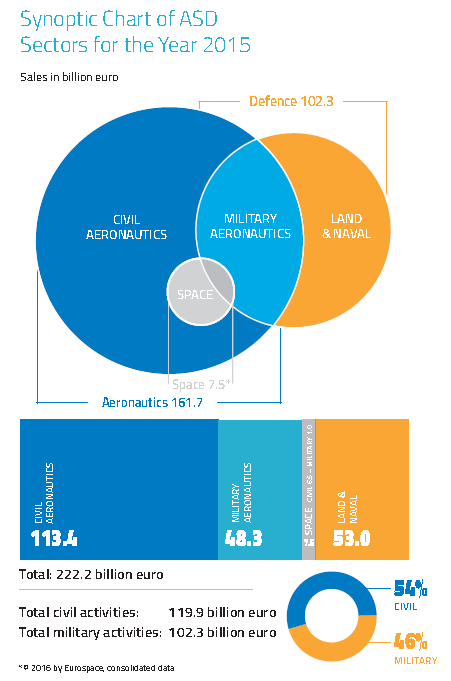
The ASD releases every year a “Key Facts & Figures” brochure (2015 issue here, PDF, 1 MB) which provides consolidated European figures of revenue, employment, investment in R&D, the split per sector (aeronautics (civil vs. military), space, land & navel)). Let me share some figures and graphic as teaser. In the year 2015 :
- The turnover of the industry was 222 bn€ (54% civil / 46% military). Up 11% from 2014.
- Direct employment: 847,700, out of which 552 k in aeronautics (2/3 in civil).
- R&D expenditure: 20 bn€ (that is a 9% of revenues), out of which 16 bn€ in aeronautics.
It is a pity but ASD, in the past, used to provide a more complete view of the business, as it, for example, provided figures of employment per country, compared revenues of the major players in the industry, etc. (see the 2010 brochure as an example). At some point the information provided has turned to be less detailed.

2010 ASD employment figures.
Europe – EDA.
Similarly, the European Defence Agency (EDA), produces a yearly “Defence Data 201x” report with the main figures and trends for the defence: member countries defence expenditures, investment on R&T, equipment, military personnel, etc. The latest one, released in 2016, aggregated defence figures of EDA members states from 2014 (PDF, 300 KB) and previous years. In a few snapshots it can be seen the effect of the crisis and austerity in defence expenditures.


Continued decrease of EDA members defence expenditure as a share of GDP and overall government expenditure.

Spain – TEDAE.
At the national level, yours truly being Spanish, I will focus first on TEDAE, which does a similar exercise for Spain as ASD at the European level. TEDAE makes two different kinds of reports, an annual report of activities (“Informe Anual 201x”) and a brochure with the main figures which contains very insightful infographics (“Cifras TEDAE 201x”). You may retrieve them here. Some figures for the year 2015 (find the report here, PDF, 31 MB):
- Revenues: 9.7 bn€ (5 bn€ defence). Up from 9.4 bn€ in 2014.
- 10% of revenues are invested in R&D.
- Employment: 54,448.
- 83% of revenues are exports.

It is a pity but TEDAE, in the past, used to provide a more complete view of the business, as it, for example, provided figures of employment per region within Spain, compared revenues of the major players in the industry, etc. (see the 2013 brochure as an example). At some point the information provided has turned to be less detailed.

Source: “Cifras TEDAE 2013”.
In the map you can see that almost half of the aerospace activity in terms of revenues (49.3%) takes place in the Madrid region, mainly in Getafe, where Airbus and Airbus Defence and Space have one of the largest factories in Spain. Nevertheless, you can see that in the region there are up to 172 production centres. In terms of employment, Madrid region accounts for a 43.9%, followed by Andalusia with 29.1%, which has seen a continuous growth in the last decade.
France – GIFAS.
Continuing at the national level, yours truly working and living in France, I will focus secondly on GIFAS (Groupement des industries françaises aéronautiques et spatiales) which does a similar exercise for France as TEDAE does for Spain and ASD at the European level. I must say that nowadays, the report from GIFAS is the most complete of the ones I have been reviewing, showing figures of revenues, new orders, employment (per region, gender, profession), recruitment, investment, exports, revenues per region, etc. Find here the annual report from 2015-2016 (PDF, 7 MB). Some key figures of the French aerospace and defence sector:
- Revenues (unconsolidated): 58.3 bn€ (77% civil; 68% export). Up 14.8% from 2014.
- That is a 26% of the European aerospace industry, or 6 times the size of Spanish aerospace and defence industry.
- 15.9% of the revenues are invested in R&D. (7.1 bn€)
- Employment: 185,000
- Up 1.7% from 2014.
- 42% engineers and managerial staff, 21% women, 92% working in aeronautics (8% in space).
- Those ~170,000 working in aeronautics represent a 31% of the 552,000 employees working in Europe in aeronautics (refer to ASD figures above).

Source: GIFAS 2015-2016 annual report.
The annual report from GIFAS includes a map with the distribution of employment per region (what I mentioned that ASD for Europe and TEDAE for Spain used to do but they do not anymore) and in it, the weight of Toulouse and its region (Languedoc-Rousillon-Midi-Pyrenees) can be appreciated.

Source: GIFAS 2015-2016 annual report.
Up to 28% of the 185,000 employees of the aerospace and defence sector are based in the area (1). That is about 52,000 employees in the region around Toulouse. If we compare with Europe figures from ASD (though those figures date from 2015), they represent around a 9% of the European aeronautics sector, or about the same size of the whole industry in Spain. Thus, as expected, truly Toulouse is the centre of gravity of the sector in Europe.
Other European Countries.
I then thought it would be good if there was a thorough database or report with key figures and data for the complete of Europe, its countries and regions and wondered whether there was any such source. A kind of report with the breadth of information provided by GIFAS but compiling data from each an every European country. At first sight that compilation could be done by ASD but they do not. And it is not easy to do. For instance, not all bodies representing each national industry provide the same level of detail nor are as diligent in releasing yearly figures, or the figures correspond squarely to the same sectors:
- The British Aerospace, Defence, Security and Space Group (ADS) publishes a yearly “Facts & Figures” (find here the latest from 2016, PDF, 0.4 MB): 65 bn£ in revenues, thereof 31 bn£ in aerospace, of which 81% export, 13% invested in aerospace R&D (3.9 bn£), 128,000 aerospace employees (out of the global 340,000 employees between the 4 sectors).
- The German Aerospace Industries Association (BDLI) releases a yearly brochure with the key figures of the industry (see here the latest one with 2015 key figures, PDF, 0.9 MB): 34.7 bn€ in revenues (up 8% from 2014), 73% in civil aviation, 70% export, 12.1% invested in R&D (4.2 bn€), 106,800 employees.
- The Italian Industries Federation for Aerospace Defence & Security (AIAD) releases an annual report with figures (find here the 2015 annual report, PDF, 0.4 MB): 15.3 bn€ in revenues, 80% corresponding to the group Leonardo-Finmeccanica, 50,000 employees.
- The Swedish Security and Defence Industry Association (SOFF) releases a “Facts” brochure with some of those figures (see here the figures from 2013/2014, PDF, 1 MB) a yearly report with some global figures (sales of 30 bn SEK in 2013, about 3 bn€), with some detail: 60% export, 65% military, 18% invested in R&D, about 52,000 employees.
- The Netherlands Aerospace Group (NAG) releases a “Factsheet” with a good snapshot of the industry (see here the latest one with 2014 figures, PDF, 0.6 MB): 3.9 bn€ in revenues (up 5.4% from 2013), 69% export, 50% MRO, 16,500 employees.
No wonder that ASD does not undertake the exercise to provide a global picture.
Nevertheless, with a quick review of these sources and their figures we have covered the 7 leading European countries in the aerospace and defence industry, which together combine above 85% of the activity and employment.
Clusters – EACP.
Therefore, unfortunately I have not been able to find in the reports of the existing industry association that global, consistent and detailed view. However, in searching for that information I found out about the European Aerospace Cluster Partnership (EACP), that
provides a permanent platform for mutual exchange, policy learning, and cooperation to achieve high-level performance among European aerospace clusters.
[…]
The EACP aims at initiating an active exchange of information and knowledge between all partners and at developing and realizing concrete steps for long-term trans-national cooperation between clusters and companies for a stronger and more competitive European position in the world aerospace markets.
From what I read, the role of the partnership would be similar to that of ASD, but rather than gathering national industry associations (and companies), their members are regional clusters (34 of them from 13 different countries). The partnership started in 2009, and honestly, it had escaped my radar up to now.

Location of EACP clusters (source: EACP brochure).
The good news: they release a brochure (PDF, 22 MB) which provides an overview of the clusters in Europe members of EACP. That report provides some figures of 20 of the 34 clusters and taken together it is the closest exercise to the global approach I was looking for. I have compiled in the table below part of the available data of those 20 clusters.

Ranking of EACP clusters by employment. (Source of the data: EACP brochure 2015).
Some comments and caveats to it:
- The biggest cluster or region is Aerospace Valley which encompasses the French regions of Midi-Pyrenees and Aquitaine, and thus companies such as Airbus, Airbus Defense and Space, Air France Industries (MRO), ATR, Continental, Dassault Aviation, Latécoère, Liebherr Aerospace, Messier-Bugatti-Dowty, Turbomeca (Safran Group), Alstom Transport, Honeywell Aerospace, Thales Alenia Space, Thales Avionics, Rockwell Collins and several research centres (2).
- The report informs that the cluster employs 130,000 workers. Recall the figures included at the GIFAS (industry-only) report, where the combined workforce of the regions Midi-Pyrenees (28%) and Aquitaine (10%) is about 70,000 employees (I have taken the percentages from the GIFAS 2014 report, previous to the re-organization of French regions).
- The largest region in Spain, as we saw before, is Madrid. Madrid Aerospace Cluster would be placed 4th in the ranking above (however the ranking has some caveats that I discuss below). The figure of employment of the Madrid cluster (35,000) is not the same as that provided by TEDAE (industry only) in its 2013 report for the region of Madrid (the 43.9% shown in the map referred to the aeronautics sector only (~41,000 employees of the ~51,000 working in aerospace and defence) and yields a figure of 18,000 employees).
- In the ranking the main other two Spanish clusters, HEGAN and HELICE (from the Basque country and Andalusia) are reported as very close to each other in terms of employment, however, as seen in the map from TEDAE, the Andalusian aeronautics industry represents a 29% of the national one, whereas the basque one a lower 10%. I guess that the reported figures in EACP from HELICE refer mainly to industry figures (or that the research centres mentioned do not employ many workers) and that HEGAN ones include a considerable figure of researchers.
- The main caveats:
- there are several clusters of which employment figures are not provided in the EACP report, in particular, the clusters from the UK (which as seen above is the second largest aerospace industry in Europe with over 128,000 employees; one or several regions from the UK would be placed high up in a regional ranking), the cluster from Paris region (recall that it represents 28% of the French aerospace employment as per GIFAS), other Italian clusters apart from Torino.
- there are no Swedish or Dutch clusters among the members of EACP, and therefore no info is included either in the report or the table above, and we saw that those 2 countries are among the leading 7 European aerospace industries. Certainly a Swedish and or Dutch cluster would rank high in the list.
- As reported above, the reported figures of the different clusters seem not to be consistent with each others, some reporting mainly industry employment whereas others include high numbers of researchers from other institutions than industry.
This post was intended mainly to share some sources above, make a review of some of the main figures of European aerospace industry and its regions. Hopefully the next time that I take a look into it I may find a European-wide report as consistent and detailed as that of GIFAS.
—
(1) Recall that Airbus plant in Toulouse is the biggest factory in France as I commented in this other post, where I included a map with the largest 100 factories from the French industrial weekly “L’Usine nouvelle”.
(2) As an example, on top of industry, the EACP report includes the following research institutes within the French “Aerospace Valley” cluster: Bordeaux University, CEA/CESTA, CEA TECH, CERFACS, CNES, CNRS, Ecoles des Mines d’Albi-Carmaux, INP Toulouse, INRIA, ONERA, Toulouse University… up to 80 research institutions.

