
Back in 2013, I wrote a post comparing the orders of the Airbus A380 compared to those of the Boeing 747 Jumbo taking different references for the comparison. As I explained then, the idea for the post was triggered by a conversation with my friend Jose. A year later, in 2014 I wrote an update of that comparison (here).
This post is yet again triggered by another point raised by Jose (1) in another conversation a few months ago, when Airbus announced that it has reached the unit break even point for the A380 programme in 2015 with 27 deliveries. In that news it was already mentioned that the company sought to lower the number of aircraft for breaking even on any given year. The point became more relevant since Airbus confirmed, this week at Farnborough air show, that it would slow down its production pace to a monthly rate of 1 aircraft per month from 2018.
In our conversation, Jose looked at how the Boeing 747 production rate had evolved throughout history. Taking the figures from the 747 article in the Wikipedia (here), you can see the results in the graphic below. The bars show yearly deliveries. The lines the monthly production rate and its 3-year rolling average. I took this average to smooth the curve even if it is very similar to the year-by-year data (1).
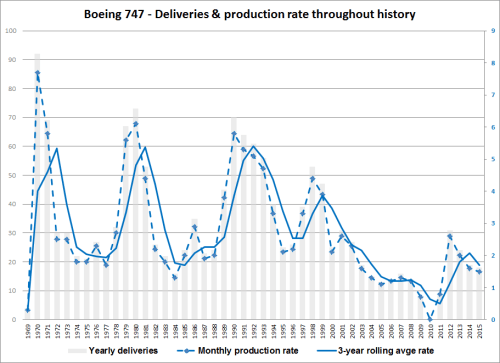
Some comments on the 747 production rates (taken from its yearly deliveries):
- The average monthly production rate since its first delivery back in 1969 has been: 2.7 airplanes per month (above 2.25 for A380 in 2015).
- During the first about 30-35 years (till ~2002-3) the rate fluctuated between 2 and 5 deliveries per month.
- Since 2003 the rate has averaged 1.3.
- For the first 10 years of the 747 programme (as the A380 is just about to complete that first decade of deliveries), its production rate averaged 2.9 aircraft per month.
- Even if not reflected in the graphic, for information, Boeing has announced that it would decrease production rate down to 0.5 airplanes per month (6 a year) from September 2016.
Time will tell if the rate for the A380 is sustainable and whether its market rebounds.
—
(1) I took 3 years to make the rolling average as the fact of confirming in 2016 a delivery rate decrease to be effective from 2018 may give an idea of lead times.

