
Four years ago, when I first wrote a blog post about the different NGOs that I supported, I briefly discussed the dire situation of Official Development Assistance (ODA) based on the OECD report from 2005.
OECD 2005 Development Aid
Just 5 countries were then above the 0.7% threshold, that I recall was first suggested by:
[…] Lester B. Pearson (PDF, 40KB), former Prime Minister of Canada, who in 1969 recommended that resources equivalent to a minimum of 1% of the GNP of developed nations should flow to developing countries.
This 1% would be made up of official development assistance, other official flows from the government, and private sector flows; the official development assistance component of the 1% commitment would be equivalent to 0.7% of GNP.
In this post I wanted to take a look at the latest data from the OECD which was released in a note published a few days ago, “Development aid stable in 2014 but flows to poorest countries still falling“. Together with the note you can download a file with all the statistics [XLS, 329KB] and a brief report explaining the figures [PDF, 349KB]. In my opinion the best way to understand the situation is to play with tool, of which I give a screenshot below:
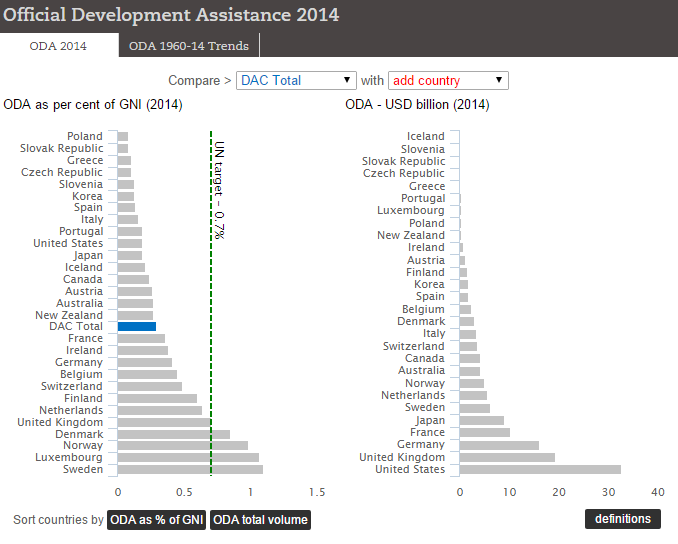
OECD Official Development Assistance, 2014 data.
In the graphic you can see that still today, as it was the case 10 years ago, only 5 countries (Denmark, Luxembourg, Norway, Sweden and the UK) exceeded the United Nations target of keeping ODA at 0.7% of GNI (the UK has taken the place of The Netherlands). In absolute terms, the bigger donors are the USA, the UK, Germany, France and Japan. The total net ODA from member countries of the Development Assistance Committee (DAC) was 135.2bn$ (practically the same as in 2013) or a 0.29% of the gross national income (GNI) of those countries.
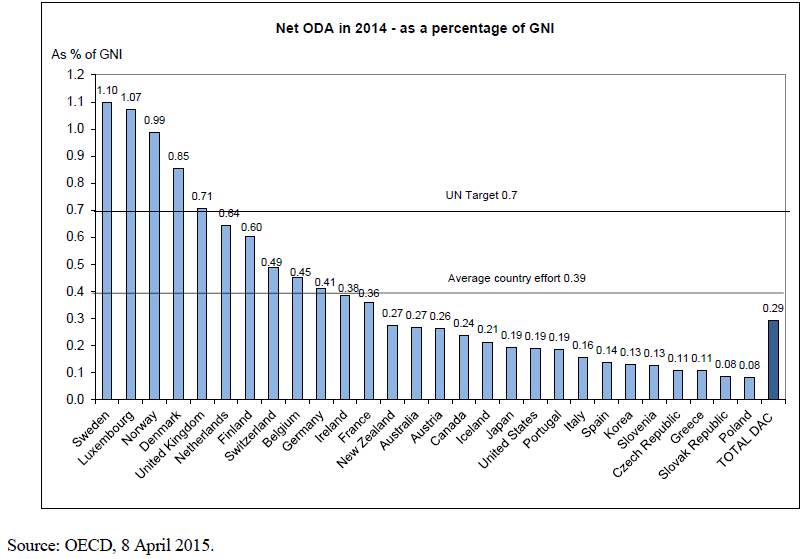
OECD ODA 2014, target, average country effort and total DAC.
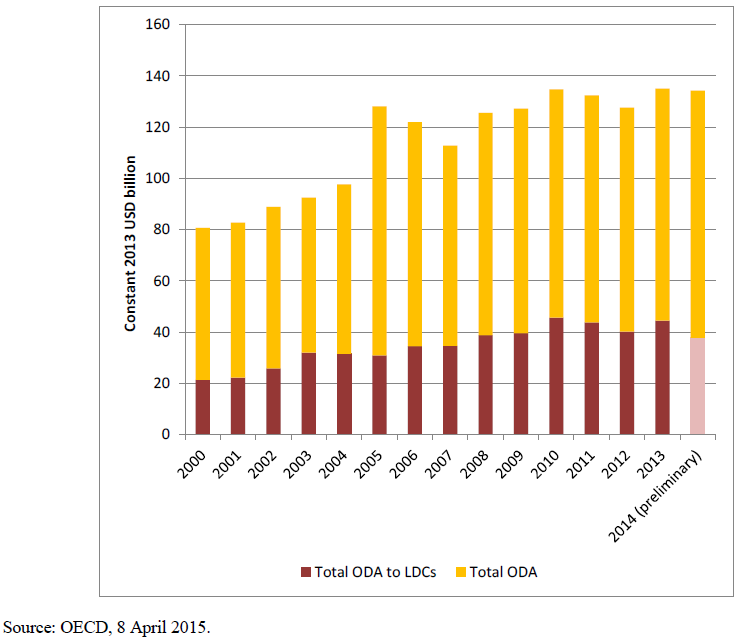
In the graphic below you can see the evolution of the total ODA in the past years, which with the crisis has suffered from continuous up and downs.
Finally, using the tool, I dived into the case of Spain (my country of origin). You can see that Spain’s official development assistance contributions peaked in 2008-2009, when it reached 0.46% and 6.41bn$. The crisis then took its particular toll in Spain and priorities were redefined by the political class, almost completely forgetting about ODA. In the 2014 it contributed 1.89bn$ which represented 0.14% of the GNI, or a fifth of the UN target.
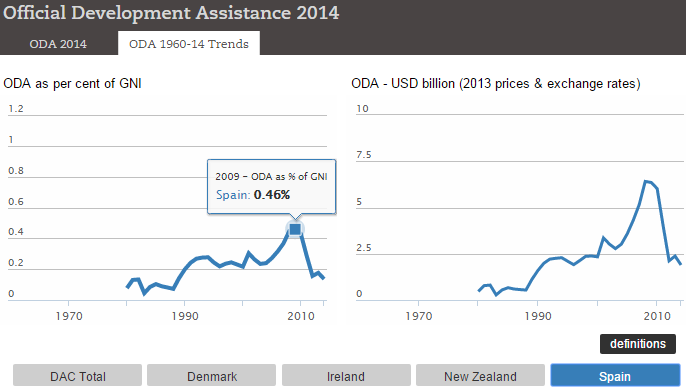
Spain’s ODA evolution in relative (% of GNI) and absolute ($bn) terms.

