Category Archives: Economy

Aeropuerto de Zaragoza y el transporte de mercancía, 2003 – 2018

Hace unos días leí una noticia del diario Expansión titulada Así es el desconocido negocio de la carga aérea en España. La noticia describe los principales aeropuertos de la red de AENA en términos de transporte de mercancía, encabezados por Madrid, seguido de Barcelona, Zaragoza y Vitoria.

El artículo ofrece algunos gráficos, comparando el volumen de la carga transportada desde esos aeropuertos, el crecimiento del volumen total transportado en la red de aeropuertos (+54% entre 2004 y 2018) o una comparación con los grandes aeropuertos europeos en términos de transporte de mercancía.

También se ofrece la pista del porqué el aeropuerto de Zaragoza es un hub de carga, y es debido a que, entre otras empresas, Zara tiene allí su centro logístico, desde el cual se transportan el 40% de las prendas por vía aérea.

En esta entrada quería compartir la gráfica de debajo que he realizado a partir de los datos publicados por AENA durante los últimos 15 años. En ella se muestra la evolución del volumen de carga en los principales aeropuertos de España (excluyendo Madrid), y entre ellos destaca el crecimiento de Zaragoza.

aena_zaragoza_2003-2018

Algunos comentarios:

  • El centro logístico de Inditex se abre en 2003.
  • En ese año 2003, Zaragoza termina como noveno aeropuerto de España en transporte de mercancía.
  • Seis años más tarde, en 2009, ya es el tercer aeropuerto, solo por detrás de Madrid y Barcelona.
  • En 2009 el volumen transportado en Zaragoza supone un 41% del volumen transportado desde Barcelona. Nueve años más tarde, en 2018, ese porcentaje pasa a ser el 96%, a pesar del fuerte crecimiento de Barcelona en los últimos 5 años.
  • Si el ritmo de crecimiento de 2018 de ambos aeropuertos se mantiene en 2019, este año Zaragoza pasará a ser el segundo aeropuerto de la red.
  • Un último dato: la tasa de crecimiento anual (TCAC o también CAGRCompound annual growth rate, en inglés) del aeropuerto de Zaragoza en estos 15 años ha sido del 22.2%. Los siguientes aeropuertos con mayor crecimiento en ese tiempo han sido Sevilla (7.7%), Barcelona (6.5%) y Madrid (3.6%).

Leave a comment

Filed under Aerospace & Defence, Economy

El tráfico aéreo en Cataluña desde el 1 de Octubre (actualización 2018)

En enero de 2018 escribí una entrada en el blog para ver si a partir de los datos compilados por AENA (Aeropuertos Españoles y Navegación Aérea) se podía detectar algún impacto en el tráfico aéreo en Cataluña entre el 1-O y el 27-O y los meses siguientes. Tras analizar las diferentes curvas que incluí en aquel artículo, no se podía concluir un impacto:

sacar una conclusión clara de que hasta diciembre el 1-O o el 27-O hayan tenido un impacto en el tráfico aéreo de los aeropuertos en Cataluña se hace más difícil que leer los posos del café.

AENA acaba de publicar hoy las estadísticas de tráfico aéreo (medido en pasajeros, operaciones y toneladas de mercancía transportada) de diciembre de 2018 y con ellas las del conjunto del año 2018.

Durante 2018 fui mirando dichas estadísticas regularmente y compilándolas en un archivo para poder sacar ahora de nuevo esta entrada y ver si durante 2018 ha habido algún efecto en el tráfico aéreo debido a las tensiones que se viven en Cataluña.

Pasajeros.

pax mad - bcn - palma_2018

El volumen de pasajeros en el aeropuerto de Barcelona creció en todos los meses del año 2018 con respecto a los mismos meses de 2017. En la gráfica se observa que el crecimiento fue menor que el que obtuvo el aeropuerto de Madrid, pero mayor que el que obtuvo el de Palma de Mallorca.

En todo caso, en el global anual, Barcelona creció un 6.1%, por un 8.4% de Madrid, 4.0% de Mallorca y un crecimiento nacional (la consolidación de los 48 aeropuertos de la red) de 5.8%. Por tanto creció más que el volumen total nacional.

Operaciones.

ops mad - bcn - palma_2018

En número de operaciones el aeropuerto de Barcelona creció en todos los meses del año 2018 con respecto a los mismos meses de 2017 (aunque en noviembre ese crecimiento fuese mínimo). En la gráfica se observa que el crecimiento fue menor que el que obtuvo el aeropuerto de Madrid, y aunque no se observa bien, fue también menor en porcentaje que el crecimiento que obtuvo el de Palma de Mallorca.

En todo caso, en el global anual, los tres aeropuertos tuvieron un crecimiento en volumen de operaciones menor que el crecimiento total nacional (5.8%): Barcelona creció un 3.7%, por un 5.7% de Madrid y 5.5% de Mallorca. Por tanto creció menos que el global nacional.

Mercancía.

mer mad - bcn - zgz_2018

En volumen de mercancía transportada el aeropuerto de Barcelona creció en todos los meses del año 2018 con respecto al mismo mes de 2017, aunque ese crecimiento sea un tanto irregular según los meses del año (irregularidad que ya se dio en 2017).

En la gráfica se observa un crecimiento menor que el que obtuvo el aeropuerto de Madrid, pero éste es en términos absolutos: 47 millones de toneladas adicionales en Madrid en 2018 con respecto a 2017, por 17 millones más en Barcelona. Sin embargo, en términos relativos, el volumen creció en Barcelona un 10.8% por un 9.9% en Madrid (idéntico porcentaje que el crecimiento total nacional).

En todo caso, ambos aeropuertos crecieron menos que el tercer aeropuerto en carga, Zaragoza, que creció un 17.3%, superando en varios meses el volumen transportado en Barcelona (abril y de agosto a noviembre), aunque no el global anual.

A continuación dejo una tabla resumen con la evolución mes a mes comparada entre Madrid y Barcelona.

tablas comparativas_2018

Como conclusión final: el tráfico en Barcelona ha seguido creciendo en 2018, aunque el crecimiento haya sido menor que el que obtuvo en años anteriores (el crecimiento nacional también se ha desacelerado tanto en pasajeros como operaciones y mercancía). Ha crecido menos que el aeropuerto de Madrid en pasajeros y operaciones, pero más en mercancía. Y creció más que el crecimiento total nacional en pasajeros y mercancías, pero menos en operaciones.

Por tanto, de nuevo la conclusión tras el estudio de los datos y gráficas es que no se observa un impacto en el tráfico aéreo por ninguno de los hechos ocurridos en el último trimestre de 2017, ni por la posterior implantación del 155, ni la inestabilidad política.

Leave a comment

Filed under Aerospace & Defence, Economy

“Economic Possibilities for our Grandchildren”, John Maynard Keynes (1930)

The English economist, John Maynard Keynes, wrote in 1930 a short essay, titled Economic Possibilities for our Grandchildren , where he discussed that in about a hundred years from that time (~ 2030) the economic problem would be solved.

I read this essay years ago and have referred to it many times, thus I had wanted to write here about it and leave some of the extracts and a few related graphics for future reference.

In a nutshell: Keynes forecast that, at some point in the future, productivity growth will reach a level such that we humans will not have to work more than 15 hours per week if we spread the available work to be done as widely as possible. The problem that humans will then face will be how to employ their time in leisure activities.

He comments that without the need to accumulate money we will see a “return to some of the most sure and certain principles of religion and traditional virtue-that avarice is a vice.

In the essay he also predicts “that the standard of life in progressive countries one hundred years hence will be between four and eight times as high as it is to-day. We can measure this by seeing the evolution of GDP per capita since then in the UK in the following graphic from the website Our World in Data (by Max Roser):

GDP per capita growth UK

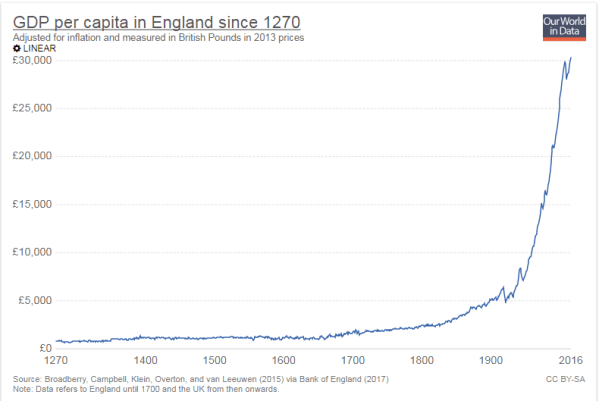
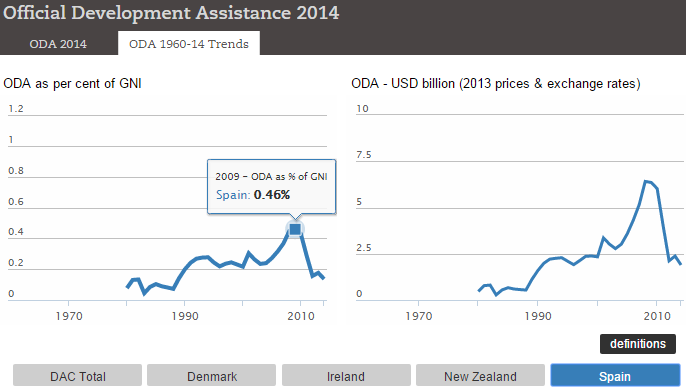
Comparing the figures of the graphic 1930 (5,746 £) and 2016 (30,281 £), we see that the increase in these 86 years has been x 5.3 times (adjusted for inflation), thus between 4 and 8 times, as predicted, and pending 14 years to go till 2030.

Keynes included at the end of the paper some conditions that will set the pace of the progress to reach the moment in which the economic problem will be solved:

  • our power to control population,
  • our determination to avoid wars and civil dissensions,
  • our willingness to entrust to science the direction of those matters which are properly the concern of science, and
  • the rate of accumulation as fixed by the margin between our production and our consumption; of which the last will easily look after itself, given the first three.

Population growth and control. In the following graphic from the same website “Our World in Data” (by Max Roser and Esteban Ortiz-Ospina) we can see that population growth from 1930 was far from being controlled. The rate of growth tripled reaching its maximum in 1962 (~2.2%). Since then it has nearly halved. The forecasts are that by the end of the current century population will cease to grow and stabilize at around 11 billion people.

updated-World-Population-Growth-1750-2100

Updated-World-Population-Growth-Rate-Annual-1950-2100

Wars and civil dissensions. Yet again, in the website “Our World in Data” (by Max Roser) we can see how a few years after Keynes wrote his essay (1930) started the Second World War. However, since the end of WWII the global figures of deaths in wars between states, civil wars, etc., have greatly decreased.

International-Battle-Deaths-per-100000-20th-Century-Acemoglu0

state-based-battle-related-deaths-per-100000-since-1946

To conclude this post, I leave here below a few extracts from the essay.

—-

“We are suffering just now from a bad attack of economic pessimism.”

“We are suffering, not from the rheumatics of old age, but from the growing-pains of over-rapid changes, from the painfulness of readjustment between one economic period and another.”

“The prevailing world depression, the enormous anomaly of unemployment in a world full of wants, the disastrous mistakes we have made, blind us to what is going on under the surface to the true interpretation. Of time-the pessimism of the revolutionaries who think that things are so bad that nothing can save us but violent change, and the pessimism of the reactionaries who consider the balance of our economic and social life so precarious that we must risk no experiments.”

“My purpose in this essay […] What can we reasonably expect the level of our economic life to be a hundred years hence? What are the economic possibilities for our grandchildren?”

“Some periods perhaps So per cent better than others at the utmost 1.00 per cent better-in the four thousand years which ended (say) in A. D. 1700.”

“This slow rate of progress, or lack of progress, was due to two reasons – to the remarkable absence of important technical improvements and to the failure of capital to accumulate.

“The absence of important technical inventions between the prehistoric age and comparatively modern times is truly remarkable.”

“At some epoch before the dawn of history perhaps even in one of the comfortable intervals before the last ice age-there must have been an era of progress and invention comparable to that in which we live to-day. But through the greater part of recorded history there was nothing of the kind.”

“The modern age opened; I think, with the accumulation of capital which began in the sixteenth century. I believe – for reasons with which I must not encumber the present argument – that this was initially due to the rise of prices, and the profits to which that led, which resulted from the treasure of gold and silver which Spain brought from the New World into the Old. From that time until today the power of accumulation by compound interest, which seems to have been sleeping for many generations, was re-born and renewed its strength. And the power of compound interest over two hundred years is such as to stagger the imagination.”

“For I trace the beginnings of British foreign investment to the treasure which Drake stole from Spain in 1580. In that year he returned to England bringing with him the prodigious spoils of the Golden Hind. Queen Elizabeth was a considerable shareholder in the syndicate which had financed the expedition. Out of her share she paid off the whole of England’s foreign debt, balanced her Budget, and found herself with about £40,000 in hand. This she invested in the Levant Company –which prospered. Out of the profits of the Levant Company, the East India Company was founded”

“Thus, every £1 which Drake brought home in 1580 has now become £100,000. Such is the power of compound interest!”

“From the sixteenth century, with a cumulative crescendo after the eighteenth, the great age of science and technical inventions began, which since the beginning of the nineteenth century has been in full flood — coal, steam, electricity, petrol, steel, rubber, cotton, the chemical industries, automatic machinery and the methods of mass production, wireless, printing, Newton, Darwin, and Einstein, and thousands of other things and men too famous and familiar to catalogue.”

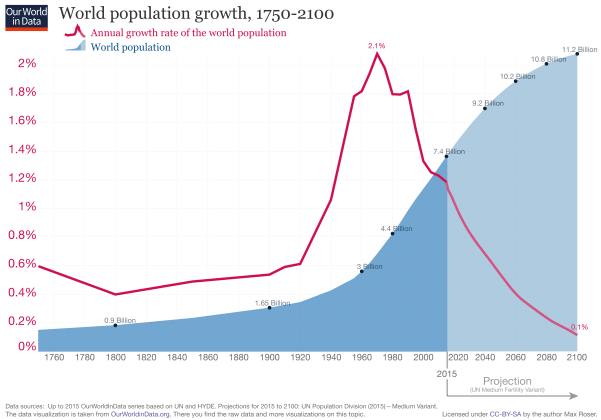
“What is the result? In spite of an enormous growth in the population of the world, which it has been necessary to equip with houses and machines, the average standard of life in Europe and the United States has been raised, I think, about fourfold. The growth of capital has been on a scale which is far beyond a hundredfold of what any previous age had known. And from now on we need not expect so great an increase of population. If capital increases, say, 2 per cent per annum, the capital equipment of the world will have increased by a half in twenty years, and seven and a half times in a hundred years. Think of this in terms of material things — houses, transport, and the like.”

“At the same time technical improvements in manufacture and transport have been proceeding at a greater rate in the last ten years than ever before in history. In the United States factory output per head was 40 per cent greater in 1925”

“In quite a few years-in our own lifetimes I mean – we may be able to perform all the operations of agriculture, mining, and manufacture with a quarter of the human effort to which we have been accustomed.”

“We are being afflicted with a new disease of which some readers may not yet have heard the name, but of which they will hear a great deal in the years to come — namely, technological unemployment. This means unemployment due to our discovery of means of economising the use of labour outrunning the pace at which we can find new uses for labour.”

“… means in the long run that mankind is solving its economic problem. I would predict that the standard of life in progressive countries one hundred years hence will be between four and eight times as high as it is to-day.”

“Let us, for the sake of argument, suppose that a hundred years hence we are all of us, on the average, eight times better off in the economic sense”

“… when these needs are satisfied in the sense that we prefer to devote our further energies to non-economic purposes.”

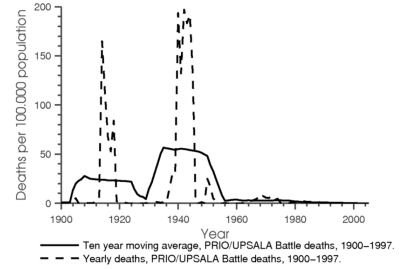
“I draw the conclusion that, assuming no important wars and no important increase in population, the economic problem may be solved, or be at least within sight of solution, within a hundred years.”

“… we look into the past-we find that the economic problem, the struggle for subsistence, always has been hitherto the primary, most pressing problem of the human race”

“If the economic problem is solved, mankind will be deprived of its traditional purpose.

“To use the language of to-day-must we not expect a general “nervous breakdown”? We already have a little experience of what I mean -a nervous breakdown of the sort which is already common enough in England and the United States amongst the wives of the well-to-do classes, unfortunate women, many of them, who have been deprived by their wealth of their traditional tasks and occupations–who cannot find it sufficiently amusing, when deprived of the spur of economic necessity, to cook and clean and mend, yet are quite unable to find anything more amusing.”

“Thus for the first time since his creation man will be faced with his real, his permanent problemhow to use his freedom from pressing economic cares, how to occupy the leisure, which science and compound interest will have won for him, to live wisely and agreeably and well.”

“For we have been trained too long to strive and not to enjoy. It is a fearful problem for the ordinary person, with no special talents, to occupy himself”

“We shall do more things for ourselves than is usual with the rich to-day, only too glad to have small duties and tasks and routines. But beyond this, we shall endeavour to spread the bread thin on the butter-to make what work there is still to be done to be as widely shared as possible. Three-hour shifts or a fifteen-hour week may put off the problem for a great while. For three hours a day is quite enough to satisfy the old Adam in most of us!”

“When the accumulation of wealth is no longer of high social importance, there will be great changes in the code of morals.”

“The love of money as a possession -as distinguished from the love of money as a means to the enjoyments and realities of life -will be recognised for what it is, a somewhat disgusting morbidity, one of those semicriminal, semi-pathological propensities which one hands over with a shudder to the specialists in mental disease.”

“I see us free, therefore, to return to some of the most sure and certain principles of religion and traditional virtue-that avarice is a vice, that the exaction of usury is a misdemeanour, and the love of money is detestable

“But beware! The time for all this is not yet. For at least another hundred years we must pretend to ourselves and to every one that fair is foul and foul is fair; for foul is useful and fair is not. Avarice and usury and precaution must be our gods for a little longer still.”

“… it will all happen gradually, not as a catastrophe. Indeed, it has already begun. The course of affairs will simply be that there will be ever larger and larger classes and groups of people from whom problems of economic necessity have been practically removed.”

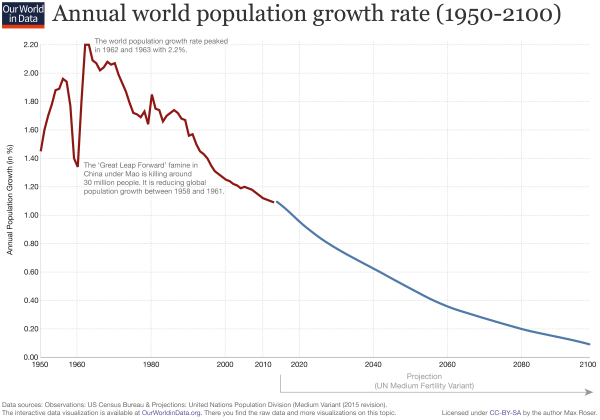
“The pace at which we can reach our destination of economic bliss will be governed by four things-our power to control population, our determination to avoid wars and civil dissensions, our willingness to entrust to science the direction of those matters which are properly the concern of science, and the rate of accumulation as fixed by the margin between our production and our consumption; of which the last will easily look after itself, given the first three.”

Leave a comment

Filed under Economy

El tráfico aéreo en Cataluña desde el 1 de Octubre

En los últimos 3 meses hemos visto muchas noticias al respecto de las empresas que están cambiando de sede de Cataluña a otras regiones como Madrid, Valencia, Baleares… Estas noticias suelen ir acompañadas de calurosos debates sobre lo grande que será el impacto, o si será nulo, si pagan sus impuestos aquí o allá, etc.

También hemos visto varias noticias sobre la desaceleración del crecimiento del empleo. Sobre el desempleo. La publicación de esos datos también conlleva animados debates.

Otros tantos debates surgen con motivo de si las reservas hoteleras en Barcelona bajan, suben o siguen igual que en otros años.

Cada vez que veo estos datos y los debates relacionados me cuesta ver negro sobre blanco el posible impacto de los resultados del 1-O, de la declaración unilateral de independencia del 27-O, etc.

Por otro lado, y sin dudar de la fiabilidad de la EPA (“Encuesta de Población Activa” aquí su metodología), o de los datos sobre capacidades hoteleras, el hecho de que se traten de encuestas me hizo plantearme el buscar un posible indicador basado en datos crudos más que en estimaciones. Datos fiables. Y eso me llevó, obviamente, a buscar datos publicados por ingenieros aeronáuticos. 😉

… Los datos sobre tráfico aéreo que publica AENA (Aeropuertos Españoles y Navegación Aérea) cada mes sobre los aeropuertos que gestiona en España.

El portal de estadísticas de AENA se puede encontrar en el siguiente enlace. En él AENA publica datos mensuales absolutos y relativos sobre el tráfico de cada aeropuerto medido en pasajeros, operaciones (despegues y aterrizajes) y en carga transportada (medido en su peso).

Para ver el posible impacto de los últimos eventos en Cataluña, compilé los datos de tráfico aéreo de los últimos tres años (2015, 2016 y 2017) en el aeropuerto de Barcelona El Prat y Gerona. Su evolución la comparo con aeropuertos con un tráfico similar: Madrid Barajas, Palma de Mallorca, Zaragoza (para el caso de carga) y Murcia (para comparar con Gerona). A continuación dejo aquí cuatro gráficas y una tabla resumen con algunos comentarios.

Tablas comparativas

Tabla comparativa con los crecimientos mensuales de Madrid Barajas y Barcelona El Prat.

Pax MAD - BCN - Palma

Pasajeros. El volumen de pasajeros en Barcelona disminuyó en los meses de octubre y noviembre con respecto a los meses de verano, como lo hace todos los años. La disminución es más acusada que en Madrid y menos que en Palma. En diciembre, de hecho, en 2017 el tráfico prácticamente ha sido el mismo que en noviembre y no descendido como en otros años. En el global del año El Prat ha crecido un 7.1%, más que Barajas (5.9%). En el último trimestre ha crecido menos. En el último mes, más.

En 2017 El Prat ha crecido menos (7.1%) que en 2016 (11.2%), pero también Barajas ha crecido menos (5.9% vs 7.7%). Se podría decir que la desaceleración es mayor, pero también lo es el crecimiento absoluto, y la mayor desaceleración también se dio en los meses anteriores al 1-O. Se hace difícil sacar una conclusión clara.

Veamos el tráfico medido en operaciones.

Ops MAD - BCN - Palma

Operaciones. En este caso el los perfiles de las curvas en 2017 vuelven a ser similares a los de los años precedentes. Hay crecimiento en prácticamente todos los meses en los 3 aeropuertos, y desde luego en los tres últimos meses. ¿Se desacelera el crecimiento en El Prat a partir del 1-O? No. En octubre, noviembre y diciembre el crecimiento es del 7.0% cada mes respecto a los mismos meses de 2016. Se podría decir que Barajas crece más en esos meses, pero el crecimiento en el último trimestre en El Prat es superior al crecimiento anual en El Prat (5.1%), por tanto, se acelera.

Sin embargo, el crecimiento en esos meses en 2016 respecto a 2015 fue mayor, y en Madrid el crecimiento en 2017 respecto a 2016 fue mayor que en 2016 respecto a 2015… pero en todos esos meses y en el global del año el crecimiento en El Prat fue mayor que en Barajas. De nuevo se hace difícil sacar una conclusión clara.

Veamos el tráfico medido en carga.

Mer MAD - BCN - ZGZ

Carga / Mercancía. En este caso los perfiles de las curvas son más complicados. Si acaso se distingue que no hay un mayor volumen en verano respecto a los meses de otoño e invierno. El pico en los tres aeropuertos (aquí Zaragoza sustituye a Palma como tercer aeropuerto en cuanto a carga) se produce en octubre y desciende en noviembre y diciembre. En carga, de nuevo El Prat crece más en el global del año (14.9% vs 13.1%) y en los últimos meses que Barajas.

Sin embargo, la desaceleración de ese crecimiento es mayor en El Prat en los tres meses del último cuarto (16.4%) con respecto a los tres anteriores (25.5%), aunque los crecimientos en absoluto sean mayores (16.4% en media en El Prat vs 12.2% en Barajas).

En 2016, sin embargo, el crecimiento se aceleró en el último cuarto del año (14.6% vs 11.4%) y en 2017 se desacelera, pero lo mismo sucede en Barajas. De nuevo se hace difícil sacar una conclusión clara y diferenciada para el aeropuerto de Barcelona El Prat.

Pax GER - MUR

Si comparamos el tráfico de Gerona con Murcia, vemos el mismo pico en los meses de verano, y en el caso de Gerona vemos que en noviembre y diciembre el tráfico es menor que en los mismos meses de 2015 y 2016. Sin embargo, eso ya ocurrió en los tres primeros meses de 2017, con lo cual se hace difícil ligar ese descenso al 1-O y acontecimientos siguientes.

Como conclusión final a este post, solo puedo decir que sacar una conclusión clara de que hasta diciembre el 1-O o el 27-O hayan tenido un impacto en el tráfico aéreo de los aeropuertos en Cataluña se hace más difícil que leer los posos del café.


1 Comment

Filed under Aerospace & Defence, Economy

Odd examples of price discounts

A quick post to share a couple of odd examples of price discounts based on quantity that I recently found:

Mugs prices at the Museum Espace Air Passion.

Mugs prices at the Museum Espace Air Passion.

The advertisement clearly indicates that preferential prices are given from the 3rd mug. Let’s see: the first and second sell for 7€ each. The 3rd one comes for an extra 4€. So far, so good. Then the 4th mug is sold for another 7€… (!?) where is the preferential pricing? The fifth and subsequent mugs come for extra 5€ each. See it graphically below:

Mugs' prices.

Mugs’ prices.

Think of a group of friends wanting to pool their purchase to lower the cost. If three friends had already decided to buy a mug, they would pay 18€, or 6€. If then came a fourth friend saying that she also wanted to join the group to buy a mug cheaper than the single one for 7€, the other 3 would have an incentive to reject her, as they would then have to pay 6.25€…

Let’s see this other example.

Flight prices at the Aeroclub du Sarladais.

Flight prices at the Aeroclub du Sarladais.

It comes from the colleagues at the Aeroclub du Sarladais. Here there are prices for short flight excursions. They offer 3 different flight durations with different prices for 1, 2 or 3 passengers. If more than 1 passenger flies, there is a discount. As there are several options, I prefer to use a table rather than a graphic to show what caught my attention:

Flights prices.

Flights prices.

In this case, in two of the cases, the marginal price to be paid by the 3rd passenger is more expensive than that to be paid by the 2nd passenger (I highlighted them in red). However, the oddity is not so striking as the average price to be paid by 3 passengers is always cheaper than the one to be paid by 2 passengers, thus, there is no economical incentive for 2 friends rejecting a 3rd wanting to join them in the experience of flying (good!).

I also found a more subtle issue with the pricing per minute for the 30 minute flights. Let’s see it with the flights for 1 passenger:

  • 15′ sell for 45€, that is 3€ per minute.
  • 20′ sell for 55€, that is 2.75€ per minute.
  • 30′ sell for 80€, that is 2.67€ per minute.

So far, so good, however, if you look at the marginal prices of the added flight time:

  • 20′-15′ = 5′, for 55€- 45€ = 10€, that is 2€ per minute.
  • 30′-20′ = 10′, for 80€- 55€ = 25€, that is 2.5€ per minute. Why are these minutes more expensive? 🙂

1 Comment

Filed under Economy

Official Development Assistance 2014 (OECD report)

Four years ago, when I first wrote a blog post about the different NGOs that I supported, I briefly discussed the dire situation of Official Development Assistance (ODA) based on the OECD report from 2005.

OECD 2005 Development Aid

OECD 2005 Development Aid

Just 5 countries were then above the 0.7% threshold, that I recall was first suggested by:

[…] Lester B. Pearson (PDF, 40KB), former Prime Minister of Canada, who in 1969 recommended that resources equivalent to a minimum of 1% of the GNP of developed nations should flow to developing countries.

This 1%  would be made up of official development assistance, other official flows from the government, and private sector flows; the official development assistance component of the 1% commitment would be equivalent to 0.7% of GNP.

In this post I wanted to take a look at the latest data from the OECD which was released in a note published a few days ago, “Development aid stable in 2014 but flows to poorest countries still falling“. Together with the note you can download a file with all the statistics [XLS, 329KB] and a brief report explaining the figures [PDF, 349KB]. In my opinion the best way to understand the situation is to play with tool, of which I give a screenshot below:

OECD Official Development Assistance, 2014 data.

OECD Official Development Assistance, 2014 data.

In the graphic you can see that still today, as it was the case 10 years ago, only 5 countries (Denmark, Luxembourg, Norway, Sweden and the UK) exceeded the United Nations target of keeping ODA at 0.7% of GNI (the UK has taken the place of The Netherlands). In absolute terms, the bigger donors are the USA, the UK, Germany, France and Japan. The total net ODA from member countries of the Development Assistance Committee (DAC) was 135.2bn$ (practically the same as in 2013) or a 0.29% of the gross national income (GNI) of those countries.

OECD ODA 2014, target, average country effort and total DAC.

OECD ODA 2014, target, average country effort and total DAC.

In the graphic below you can see the evolution of the total ODA in the past years, which with the crisis has suffered from continuous up and downs.

OECD ODA 2014 evolution


Finally, using the tool, I dived into the case of Spain (my country of origin). You can see that Spain’s official development assistance contributions peaked in 2008-2009, when it reached 0.46% and 6.41bn$. The crisis then took its particular toll in Spain and priorities were redefined by the political class, almost completely forgetting about ODA. In the 2014 it contributed 1.89bn$ which represented 0.14% of the GNI, or a fifth of the UN target.

Spain's ODA evolution in relative (% of GNI) and absolute ($bn) terms.

Spain’s ODA evolution in relative (% of GNI) and absolute ($bn) terms.

Leave a comment

Filed under Economy, Helping others

Social Progress Index

A few days ago I read an op-ed at Project Syndicate by Harvard professor Michael E. Porter titled “Why Social Progress Matters“. In it he defends the case for seeking social progress not as opposed to economic progress but to complete it.

Where there is an imbalance between economic growth and social progress, political instability and unrest often arise, as in Russia and Egypt. Lagging social progress also holds back economic growth in these and other countries that fail to address human needs, build social capital, and create opportunity for their citizens. Countries must invest in social progress, not just economic institutions, to create the proper foundation for economic growth.

In order to measure social progress he introduces the Social Progress Index (SPI), created in collaboration with Scott Stern of MIT and the nonprofit Social Progress Imperative, which measures 133 different countries in up to 52 indicators from child mortality, to affordable housing, tolerance for homosexuals, freedom of speech, greenhouse gas emissions… see them below:

Social Progress Index indicators.

Social Progress Index indicators.

I invite you to play with the tool available at Social Progress Imperative website. You can see what place your country of origin or residence ranks in each of the indicators, the consolidated indicators or the more global SPI (DEN #8, NL #9, GER #14, ESP #20, FRA #21).

Coming back to Porter’s article, it is important to note:

Focusing on social progress in this way leads to better development strategies, and builds political support for the controversial steps sometimes needed to increase prosperity. Rigorous measurement of social performance, alongside traditional economic indicators, is crucial to starting the virtuous circle by which GDP growth improves social and environmental performance in ways that drive even greater economic success. […]

[…] Paraguay, for example, has adopted the SPI to guide an inclusive national development plan for 2030. And the SPI is being used not just at the national level, but by regional and municipal authorities as well. States such as Para in Brazil, along with cities like Bogota and Rio de Janeiro in Latin America and Somerville in the US state of Massachusetts, are starting to use the SPI as a measure of development success.

This year, the European Commission will roll out regional SPIs across Europe. […]

[…] Measuring social progress offers citizens and leaders a more complete picture of how their country is developing. And that will help societies make better choices, create stronger communities, and enable people to lead more fulfilling lives.

I see that the debate on inequality is picking up, the concern for climate change is widespread, interest in sustainable development goals is rising… hopefully all these converge into increasing social progress and the dividends of the technological advances can be enjoyed by more. I see this SPI can indeed be an interesting and useful tool.

Leave a comment

Filed under Economy

Thomas Piketty, Joseph Stiglitz and Paul Krugman debate on inequality

92nd Street Y (92Y) is a multifaceted cultural institution and community center located on the Upper East Side of Manhattan in New York.

A few days ago I stumbled upon a video related to an event they organized about a month ago: “7 days of genius“. The video in particular had economists Thomas Piketty, Joseph Stiglitz and Paul Krugman debate mainly about inequality, with Alex Wagner from MSNBC as moderator. The video lasts 1h15′. If you happen to follow any of these economists (1) you will more than enjoy the time, as it is not only very informative but at points quite humorous too.

Apart from sharing the video, in this post I just wanted to highlight some passages of which I include excerpts transcribed by myself and some mental notes I made from the debate:

Krugman: “What’s not much known is that since those crisis days a lot of basic economics has worked remarkably well […] ” I’ve spent my life not entirely sure o whether I was a fraud or not […] it’s only been on the past 6 or so years that I’ve said “ok, you know, the staff works”,  the sad thing is that half of the economics profession has thrown away things that we know work […] the real sin is not failing to predict the crisis it is clinging to doctrines that are obviously clear are not working

Stiglitz: “all those fears that printing money would be inflationary was absurd” […] “economist who thought that putting the banks in the hospital for a year and a half, giving them not a blood transfusion, but a couple of trillion dollars of money would make them feel happier and that would get the economy working again. It’s clear that was wrong. That you need a clear fiscal policy, you need a real stimulus, and in a fundamental sense the economy was broken before the crisis and was using a bubble to keep that going, and that’s what we should have recognized.”

Krugman: “it’s been a race between us (USA) and Europe to see who can screw up worse, at the moment Europe is winning..”.

The three of them coincided in criticizing the (Euro zone) single currency with several fiscal policies, different interest rates on public debt, several governments… and even with that structural problem: “the situation is exacerbated by bad economic doctrines […] fiscal hypochondria” (Krugman)

Stiglitz: “we are focusing on too much debt… the real problem is that the fruits of our growth have not been widely shared”.

Stiglitz: “one of the things that Walmart raising their wages illustrates the fact that it’s not just market forces that are determining wages, that they had the power, the choice to raise their wages. […] take CEO pay, which has gone from 30x to over 300x the pay of the average worker without any justification, their productivity haven’t growth 10 times that of society”

Stiglitz: “when you have high level of youth unemployment, particularly men, when they can’t use their energy productively they tend to use them unproductively.”

Piketty: “I’m not particularly pessimistic, I see lots of good new, if you take a long perspective […] Europe is a much more prosperous and equal place today than what it was a century ago, when it was extremely unequal and more unequal than the US and today the US is more unequal than Europe, things change and different choices of policies and institutions can make things change. And also in the emerging world, there are lots of positive evolutions going on. I believe that globalization can help to reduce poverty in the world, assuming that we don’t expect that everything from the markets and we adopt the policies that can make globalization benefit broader groups of population, and sometimes governments do it. Take the example of Brazil”

I also enjoyed the criticism from Piketty to Jean Claude Juncker (current president of the European Union Commission and former Luxembourg prime minister) and its weak defense of his responsibilities in the making of Luxemburg a tax haven.

Finally, from the perspective of being Spanish, I found it interesting the following comment from Stiglitz:

“Let me call back to the question of the role of society. I was very pessimistic about Europe, but one hopeful sign of Europe is the growth of new groups like Podemos in Spain which are saying the old parties are note addressing the problems of raising unemployment and inequality. And now it’s a leading party with 27%. In the end is going to have to be political action that is going to address these issues. Civil society can bring the issue to the floor, but the real challenge is going to be to try to get those ideas into the political process […] in Europe it’s partly because it really collapsed, the real failure of old parties”

(1) I happen to like the three economists, both because of what I have read from them and the policies they advocate. As Luca warned me: the watching of the video made me fall in confirmation bias.

Leave a comment

Filed under Economy

International Women’s Day, Global Gender Gap and backing women dreams

Today, March 8th it’s International Women’s Day. In the last few days I have seen a significant buzz in social media about the day. In particular I read a couple of pieces that made contribute to the buzz with this post.

World Economic Forum:

Equal pay benefits men, too. Here are four reasons why, backed up by our Global Gender Gap Report. [PDF, 6.1MB]

I liked the approach: “What’s in it for me?” (from the perspective of men, of course) (1).

Take a look at the report (395 pages). I skimmed through it and picked some essentials, especially from a couple of graphics. The Global Gender Gap Index measures gaps in 4 sub-indices: Economic Participation and Opportunity, Educational Attainment, Health and Survival and Political Empowerment. The sources for the data are the International Labour Organisation, World Economic Forum, UNESCO Institute for Statistics, Central Intelligence Agency, World Health Organisation and the Inter-Parliamentary Union. The authors (Ricardo Hausmann (Harvard University), Laura Tyson (Berkeley), Yasmina Bekhouche (World Economic Forum) and Saadia Zahidi (World Economic Forum)) explain their methodology as follows:

There are three basic concepts underlying the Global Gender Gap Index, forming the basis of the choice of indicators, how the data is treated and the scale used. First, it focuses on measuring gaps rather than levels. Second, it captures gaps in outcome variables rather than gaps in input variables. Third, it ranks countries according to gender equality rather than women’s empowerment.

I attach below a screenshot showing the top 30 countries in the list.

Global Gender Gap Index, 2014 ranking, top 30 countries.

Global Gender Gap Index, 2014 ranking, top 30 countries.

Some comments to it:

  • Scandinavian countries are in the top of the list (no surprise here).
  • Some readers will wonder about the top places occupied by Nicaragua, Rwanda… read again the methodology above: “it focuses on measuring gaps rather than levels”.
  • When I see this kind of indices, for personal reasons I focus on the positions occupied by: Denmark #5, Germany #12, Netherlands #14, France #16, Spain #29, Lithuania #44.
  • A curiosity: Spain #29 vs. Cuba #30.
  • No surprises either at the bottom of the list: Bahrain, Turkey, Algeria, Ethiopia, Oman, Egypt, Saudi Arabia, Mauritania, Guinea, Morocco, Jordan, Lebanon, Ivory Coast, Iran, Mali, Syria, Chad, Pakistan, Yemen… which they all have in common that are located in arid subtropical zone and that most of them have at least one letter a in the name.

Coming back to the question: “What’s in it for me?” The report shows how countries in which the gender gap is lower also have good scores in several other metrics which improve the conditions of life for men as well. There is the catch. See below the comparison for the Human Development Index and the Global Competitiveness Index:

Human Development Index vs. Global Gender Gap Index.

Human Development Index vs. Global Gender Gap Index.

Global Competitive Index vs. Global Gender Gap Index.

Global Competitiveness Index vs. Global Gender Gap Index.

What can you do to help to close the gender gap? In your community you can do much. See this other open letter also in World Economic Forum from Belinda Parmar, “To men, for International Women’s Day“:

We need you.

We need you to listen. When we tell you about a problem, we don’t want you to jump to a solution for us. We just want to say it out loud to solve it ourselves knowing that you will support us.

We need you to talk. To raise the issue of gender. Don’t worry about saying the wrong thing. Saying the wrong thing is better than saying nothing at all. It’s the only way to start the conversation.

We need you to value our differences. Realise that we bring a different perspective and encourage us to bring our personalities to work, to not feel like we have to put on a ‘male suit.’

One step further: what can you do to help to close the gender gap in the countries at the bottom of the list? (those with the letter a in the names)

A few days ago I received an email from Jason Riggs of Kivathe world’s first and largest crowdfunding platform dedicated to alleviating poverty and expanding financial inclusion (about which I have written before in this blog (2)). Kiva has launched Kiva.org/Dreams to empower even more women to reach for their dreams and they asked me to help them in making this campaign more widespread. Thus, here is my contribution:

By visiting Kiva.org/Dreams, you can back a dream by choosing a woman whom Kiva should lend $25 to. There is no cost to you. By choosing her, you help her to follow her dream of starting or growing her business, sending her children to school, and ultimately, gaining financial independence.

When women have the resources to make their dreams a reality, the world changes. More children go to school, more food is grown, and nations are more peaceful and prosperous. A case in point: if women farmers had equal access to farming assets and finance, they could increase their crop yields up to 30% and 150 million people who go hungry every day would be able to eat.

By contributing to the success of an entrepreneurial woman who has overcome obstacles, we discover so much more about our own resiliency, possibility, and potential. Each of us has a part to play.

 Together we can make dreams a reality for thousands of women around the world. So in honor of International Women’s Day and the power of women, back a dream at Kiva.org/Dreams.

My suggestion: visit the site of Kiva, filter by Yemen, the country at the very bottom of the list and help dreams come true, gender gaps close and turning around the situation.

Happy International Women’s Day!

(1) I like the approach for its different persuasion approach, not like the closing the gap out of equal treatment, fairness, justice… wasn’t engouh.

(2) See other posts about Kiva: My 100th loan with Kiva“, “A Kiva success story

Leave a comment

Filed under Economy, Helping others

The Theory of Interstellar Trade

This blog post is not about the movie Interstellar, which I haven’t watched yet, but about a rather wonkish paper (as its author would put it) that I stumbled upon very recently.

The American economist and Nobel laureate Paul Krugman wrote in 1978 the paper “The Theory of Interstellar Trade” [PDF, 516KB]. The paper is simply hilarious. One of the best pieces I have ever read. It has just 15 pages and in them the author sets out to search how interest charges should be computed in interstellar trade when goods travel at close to the speed of light. It mixes economy with very light special relativity and great doses of humour. The author himself remarked in the introduction:

It should be noted that, while the subject of this paper is silly, the analysis actually does make sense. This paper, then, is a serious analysis of a ridiculous subject, which is of course the opposite of what is usual in economics.

Well, given today’s ventures, it might not be so silly 😉

Let’s review some of the highlights and conclusions derived from the paper:

To start with, he sets some fundamental considerations:

There are two major features distinguishing interstellar trade from the interplanetary trade we are accustomed to. The first is that the time spent in transit will be very great, since travel must occur at less than the light speed; round trips of several hundred years appear likely. The second is that, if interstellar trade is to be at all practical, the spaceships which conduct it must move at speeds which are reasonable fractions of the speed of light.

Because interstellar trade will take so long, any decision to launch a cargo will necessarily be a very long-term investment project […]

The second feature of interstellar transactions cannot be so easily dealt with (physicists are not as tolerant as economists of the practice of assuming difficulties away). If trading space vessels move at high velocities, we can no longer have an unambiguous measure of the time taken in the transit. The time taken by the spacecraft to make a round trip will appear less to an observer on the craft than to one remaining on Earth. […]

To solve the problem he refers to the Minkowski space-time, and includes the following diagram with the note below:

"Readers who find the Figure II puzzling should recall that a diagram of an imaginary axis must, of course, itself be imaginary".

“Readers who find the Figure II puzzling should recall that a diagram of an imaginary axis must, of course, itself be imaginary”.

By comparing the returns from actual trade between planets with the return of bonds he arrives at the First Fundamental Theorem of Interstellar Trade:

When trade takes place between two planets in a common inertial frame, the interest costs on goods in transit should be calculated using time measured by clocks in the common frame, and not by clocks in the frames of trading spacecraft.

After proving the theorem take a look at this other passage:

theorem


The author then takes on investigating possible arbitrage in interstellar transactions, and arrives to the Second Fundamental Theorem of Interstellar Trade:

If sentient beings may hold assets on two planets in the same inertial frame, competition will equalize the interest rates on the two planets.

It goes without saying that I recommend the reading of this paper.

Leave a comment

Filed under Economy, Investing