Two weeks ago I published a post where I showed a graphic of the different world records in athletics with the speeds and paces.
I received a comment from Uwe, a reader of the blog, suggesting to plot it using a logarithmic scale. At first, I wanted to show how the long distance runners could almost keep a speed (between 20.5 and 23.8 km/h) for distances from 5 kilometres to 42, a marathon. However, Uwe convinced me to make the plot and here it is:

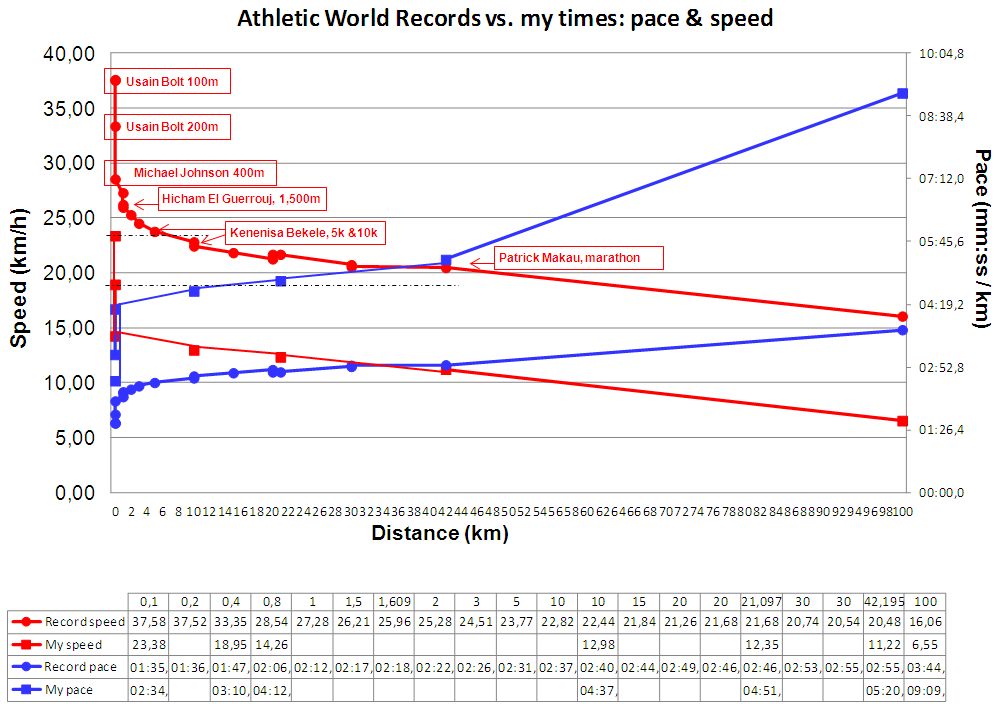
Athletics World Records vs. my times (speed) – logarithmic scale for the distances.
In this view, what it is interesting is to appreciate the different slops of the lines connecting the different records. There you can see how:
- 100m and 200m races are fully anaerobic where Usain Bolt is capable of maintaining an average speed of above 37.5 km/h. You can see in the explanation in the Wikipedia how these two races (both lasting below ~30 seconds) use as energy source high energy phosphates.
- races from 400m to 1 km are still a high intensity activity, with some anaerobic component, though another energy source enters into play: anaerobic glycolisis. And as we have heard often in descriptions about 400m races, the consequence of rapid glucose breakdown is the formation of lactic acid.
- from then (1.5 or 2km) on (up to 42km) professional runners are able to keep a high speed out of aerobic metabolism (using adenosine triphosphate, ATP). Of course, speed decreases with distance, but from the 26.2 km/h of a 1,500m to the 20.5 km/h of a marathon the speed decrease is of -22% for a race 28 times longer!
- for ultramarathons (over 42k) speed starts decreasing at a higher pace, though Wikipedia only offered the 100k time. Probably more data can be found in the web to try to find with more accuracy up to which distance the long distance stable pace could be maintained.
Uwe, you were certainly right. This view offers another very interesting perspective to the game :-).