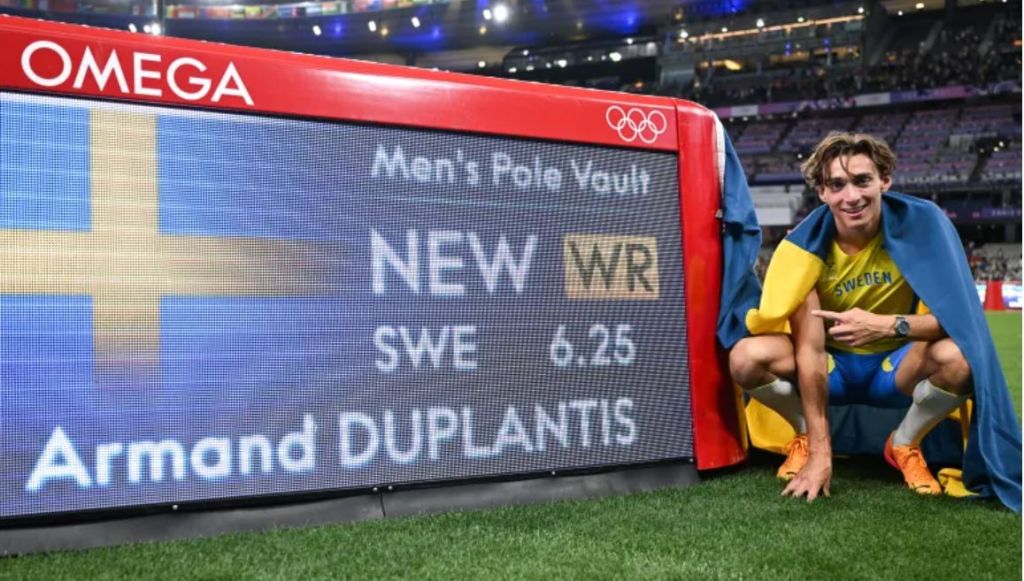
Last summer, after the Olympic Games Paris 2024 I wrote a post to review the best pole vault jumps after the world record set in that competition by Armand Duplantis with 6.25m. That post aged very quickly as just 3 weeks later Duplantis set another World record.
In this 2025 he had set another 3 records before going to the World Championship in Tokyo, where again he sat a new World record with 6.30m. This is a good time to update last year’s chart and recap the best ever performances.
For that purpose I used the website “Track and Field all-time Performances” (maintained since years ago by Peter Larsson).
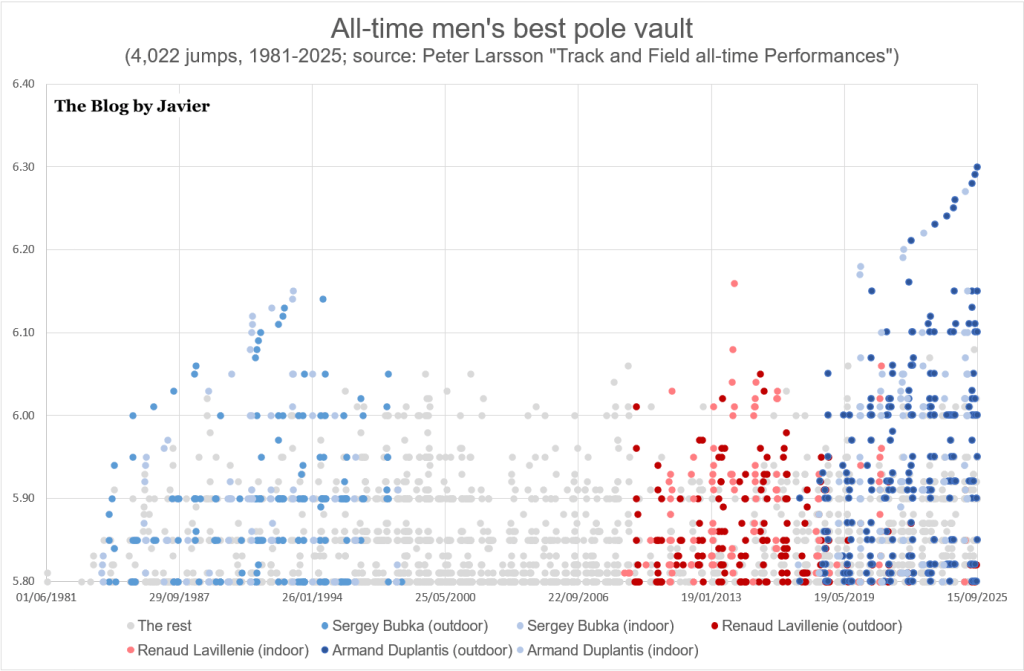
With the data of all-time men’s best pole vault I plotted the chart below with the best 4,022 jumps (jumps from 5.80m and above) and their dates, highlighting the jumps by Sergey Bubka, Renaud Lavillenie and Duplantis (dark colour for outdoor vaulting, light colour for indoor).
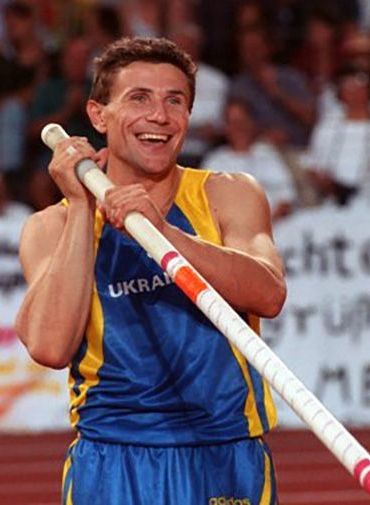
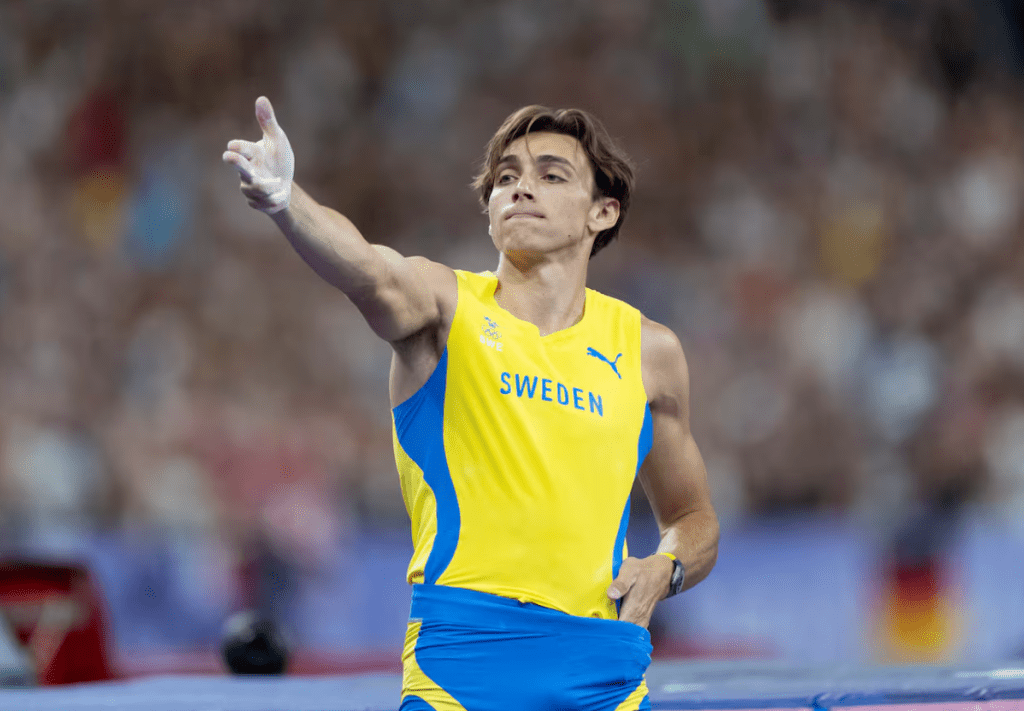
Bubka dominated the sport in the 1980’s and 90’s (first competing for the Soviet Union and later for Ukraine) when he set up to 35 world records (17 outdoor and 18 indoor), won 6 gold medals at the World Championships and 1 at the Olympic Games. Lavillenie also won a gold medal at the Olympics in London and won several World Indoor Championships (among other medals) and set an indoor world record (which was the absolute record for 6 years). Duplantis, competing for Sweden, at the young age of 25 has already won 2 gold medals at the Olympics (Tokyo and Paris) and 3 World Championships outdoors (among other medals) and has already set 14 world records (10 outdoors and 4 indoors).
Some comments after looking at the chart:
- Bubka holds 249 of the 4,022 jumps (6.2%) at 5.80m and above
- Lavillenie holds 271 of the 4,022 jumps (6.7%) at 5.80m and above
- Duplantis holds 323 of the 4,022 jumps (8.0%) at 5.80m and above… he’s already the athlete with the highest proportion in that segment
- Of those jumps of 6.00m and above (274 jumps… 52 such jumps in just the last year):
- Bubka holds 46 of the 274 jumps (16.8%) at 6.00m and above
- Lavillenie holds 21 of the 274 jumps (7.7%) at 6.00m and above
- Duplantis holds 122 of the 274 jumps (44.5%) at 6.00m and above
- If we focus at outdoor jumps of 6.00m and above (170 jumps):
- Bubka holds 28 of the 170 jumps (16.5%) at 6.00m and above
- Lavillenie holds 4 of the 170 jumps (2.4%) at 6.00m and above
- Duplantis holds 82 of the 170 jumps (48.2%) at 6.00m and above
- 25 men have vaulted outdoors at 6.00m or above, only Bubka and Duplantis jumped 6.09m or above: 6 and 28 times, respectively. Duplantis has performed 13 such jumps since the Olympics last year.
- Until Duplantis came to the scene when the World record was at 6.16m held by Lavillenie, established indoors in 2014 (Donetsk). Since 2020 Duplantis has jumped above that world record 14 times.
Bubka achieved his best jumps when he was between 27 and 30 years old. Duplantis at his 25 years has already more than twice as many high jumps as Bubka in his entire career. If Duplantis continues his progression up to 27-30 years of age we can only imagine what is to come, something that might have been deemed unbelievable for those of us who witnessed Bubka in his prime, but we are now going through the same dominance yet with higher heights and more pronounced (Emmanouil Karális, silver at the World Championships in Tokyo, achieved 6.00m… 30cm less than Duplantis!).