Category Archives: Sports

Semi marathon Toulouse 2014

Yesterday, I took part in the half (semi) marathon of Toulouse, which is run in the neighbourhood of Sept Deniers. This was the 3rd time I ran the race. Last year, it was there where I set my PB in the distance.

Since a couple of weeks ago I had not been able to set a new PB in 10km in Colomiers, I knew I wasn’t in the fastest shape and thought it would be difficult to beat last year’s time in the 21.1km. I would nevertheless give it a try.

With Andrea before the start.

With Andrea before the start.

I started running at about 4’30” per km, completing the first 10km in about 45’30”. From then on, I was not able to keep that pace. I made some numbers and saw it would be difficult to beat my PB and I went for a plan B, clocking a time below 1h40′.

This slideshow requires JavaScript.

At some point of the race, my running bib started to fall from the safety pins I used to hang it from the t-shirt. That might be the reason why, up to now, my time doesn’t appear in the classification, despite of having carried the chip and bib (even if not visible) through the end.

Final sprint.

Final sprint.

My Garmin watch recorded a net time of 1h39’34”, thus plan B accomplished! With that time, plus some more seconds to account for the official time, I would have placed about 237th out of 1257, or percentile 19%, not that bad for a tough morning run (under 20C and 80% humidity).

Leave a comment

Filed under Sports

Boulevards de Colomiers 2014

The race “Boulevards de Colomiers” (10km) is a classic of the return from summer holiday session in Toulouse area. This is the 3rd time I have run it. Last year I already wrote a post about it. I then broke the barrier of 45 minutes for the first time and made a personal best. I have since broken the “barrier” twice, setting new PBs.

This time I came to it with more or less the same preparation as last year, as I am following the same training plan, but I have not softened the training schedule to accommodate the race and thus I knew my legs would feel rather heavy.

Classic picture with Andrea before the race.

Classic picture with Andrea before the race.

I started ahead of the 45′ pacer but was caught by him around the 5th km. I then let him go away some metres, as I was not feeling my best due to the heat. In the last kilometre I catched him again and took some lead in the last 400m, being able to finish just below 45′ of net time, 44:49 as per my Garmin, about 20″ slower than last year despite the heavy legs (45:02 official gross time).

I quite happy with th result, being the 4th 10k race in a row under 45′.

Running the first km.

Running the first km.

2 Comments

Filed under Sports

Forecasting 2014 FIFA World Cup Brazil

I have a work colleague who not only is a tremendous negotiator and contracts’ drafter but also has a great sense of humor and manages in his free time late in the night to set up a contest for office staff to try to guess winners, matches’ scores, top scorers, etc., of major international soccer competitions. The 2014 FIFA World Cup in Brazil, which will start tomorrow, could not be missed. Nacho managed to set up the contest in time.

To set up the background as to how I have approached the game of forecasting this World Cup:

  • I had written a review of the book “Soccernomics“, which among other things advocates the use of data in order to make decisions in relation to football transfer market, forecasting, etc. This book relies somewhat heavily in “Moneyball” another book which I read some months ago with a similar scope but with baseball as the theme sport.
  • When the draw of the World Cup took place last December, I wrote a couple of blog posts discussing what was the so-called “group of death” basing the analysis on FIFA and ESPN rankings.
  • During the last year, I read a couple of books which approach how we make decisions and how to remove different kind of biases from the thought processes of making them: “Thinking Fast and Slow” (by the 2002 winner of the Nobel Prize in Economics Daniel Kahneman) and “Seeking Wisdom“.
  • Finally, last year I followed the open course “A Beginner’s Guide to Irrational Behavior” by Dan Ariely (though I missed the last exam due to my honeymoon and could not get credit for it).

Having shared this background, you may understand that I tried to remove all the beauty of guessing and my football “knowledge” to the forecasting process. I rather made use of  ESPN Soccer Power Index (SPI) ranking, introduced by the economist Nate Silver. I used its offensive and defensive scores plus the tip indicating that in competitive matches the defensive factor tends to be slightly more important (see “A Guide to ESPN’s SPI rankings”).

Once I plugged in the numbers from the index and used the referred tip on the defensive side, I built a simple model to guess each of the World Cup matches. Once you take this approach you will find that the model gives you plenty of results such as Nigeria 1.32 – 1.53 Bosnia… What to do with it? When the result was very tight I resolved it as a draw, otherwise a victory for the team with the highest score.

In very few instances I forecast that a team would score 3 or more goals in a match. I bore in mind that in the 2010 World Cup 80% of the matches ended up with scores of 1-0 (26% of the matches), 2-1 (15%), 0-0, 1-1 or 2-0 (each 13%).  That a team scores more than 3 goals in a match will certainly happen in some games, but I did not bother to guess in which ones, the odds are against.

The prize pot of the game organized by this colleague is not particularly big (few hundreds euros). The main point of the game is enjoying the chit-chat with work colleagues. My second main point is putting this rational approach to work and see how it fares.

Finally, what did I forecast?

A World Cup won by Brazil against Argentina in the final. With Spain beating Germany for the third place (in the penalties). For my English readers: England defeated by Colombia in the 1/8 of final. For the ones from USA, it doesn’t make the cut from the group phase. We will see along this month how well do I fare.

2014 FIFA World Cup Brazil forecast.

2014 FIFA World Cup Brazil forecast.

1 Comment

Filed under Sports

Rotterdam marathon

Last Sunday 13th April, I completed Rotterdam marathon together with JaimeSerna and Manuel. In a race preview post I wrote that I arrived to this marathon a bit short of training, having completed just about 2/3 of the training plan. In the weeks prior to the race I had asked my brother what pace he intended to start with. Having in mind the lack of thorough training, I thought of starting at a pace slightly below 5’20” per km but not below 5′. That rhythm, if sustained through the end, would allow a new personal best (at that point 3h45’35”, achieved in Paris, April 2012).

Jaime and I started the race together, departing from the box “E”. We ran together 15 kilometres, pacing each other, ensuring we would not run too fast or too slow. At km. 15 Jaime said he wanted to soften the pace a little and since then I ran alone. My intention up to then was just to try to sustain low 5’s until km. 25, just before the climb of the Erasmus bridge back to the city centre. I thought that climb would take its toll and wanted to arrive to it with some time cushion, climb it relaxed and see if after it I could go back to a similar pace.

Just when we crossed the bridge I saw that I had not slowed down but the pace was still at 5 minutes per km. This encouraged me. I took the second energetic gel bag and ate it (I consumed the first one at km. 15) and told to myself “let’s try to run a few more kilometres at 5′, one at a time”.

… and those were the best 10 kilometres of my race, from 25 to 35, where I employed less than 50′ and enjoyed it a lot. I was overtaking runners, very focused on my own pace, breathing correctly, drinking at every supply post, eating another energy gel bar at km. 33, refreshing myself with sponges…

Rotterdam marathon: pace (min / km) evolution.

Rotterdam marathon: pace (min / km) evolution.

Running at km. 40.

Running at km. 40.

At some point, seeing that I was maintaining paces of 5′ and that I had only a cumulative 1’30” over the time for 3h30′, I thought that would be possible. However, at km. 36 I started feeling stiffer. The running was less smooth. Nevertheless, I told again to myself “let’s try to clock kilometres at about 5’20” “, and so I did with the exception of km. 41, but offset with 42. The last 500 metres I sprinted to try to clock a time under 3h35′, which I did: 3h34’52”, a new personal best time in marathon.

Rotterdam marathon 5k splits, paces and predicted finish times.

Rotterdam marathon 5k splits, paces and predicted finish times.

Finish photo.

Finish photo.

From the marathons I have completed in these last 3 years, Rotterdam marathon does not have the best scenery (Rome, Paris), nor is the flattest (Berlin), or the one with the best start (Rome) or finish (Athens, Berlin)… but it has been in Rotterdam where I have enjoyed the most running, where I have had the best feelings and the best race management.

One take away for me of this marathon is something which I had read often: don’t give all out from start, keep something for the second half. After the race, I have made the numbers and the comparison: Rotterdam and Paris (my previous PB) have been the slowest 2 marathons till the half marathon.

Comparison of splits in the last 6 marathons.

Comparison of splits in the last 6 marathons.

Finish photo: 11th marathon.

Finish photo: 11th marathon.

In Rotterdam, the starting at pace above 5′ was not intended in order to keep faster paces for the second half. I wish I had had such confidence and good strategy from the outset. No, we started at those paces in order to see if we could be between 3h40′ and 3h45′. But I take the lesson for the future, for the 12th marathon…

Rotterdam marathon diploma.

Rotterdam marathon diploma.

7 Comments

Filed under Sports

Running and support items

Few days ago I completed a survey from one of the sponsors of the 2014 New York Marathon, which I will run on November 2nd. I found the survey interesting and positive as it made me reflect on some topics which I would possibly would not have deemed very important to running. See some of the questions below and reflect on them in relation to your running habits.

NY Marathon survey questions.

NY Marathon survey questions.

Which devices do I usually use when running/training? The fact is that I always use a digital watch with GPS and often a heart monitor. No smart phone or iPod. What is more, if I am not wearing the GPS/watch it feels as if I had not run…

When you run, which of the following do you usually track? Mileage, results, weight… plus series times, average training paces, hear rates…

How important these training support items are important to me when running or training?

  • Using a training plan: Extremely important. Very often is essential to find the courage to go out and run, especially when the weather conditions are not the best. It is also very important to push yourself, go for the last series repeat, etc.
  • Being part of a runner community: I initially thought this was not very important. False. It is. Being able to discuss with friends how you are evolving, how you felt at races, taking part together in races, etc., also makes it much better.
  • Having/finding a training partner: I also thought that this was not important as most of the time I run alone. Nevertheless, when I have the opportunity to run in Toulouse, Madrid or wherever in Spain with my marathon pals and other friends it makes it so much better.
  • Helping me to find routes in my area of varying distances: Very important. When you have lots of distances already measured, it reduces the thought process of deciding where to go and reduces uncertainty.
  • Providing comparative data and the ability to compare my running results with other marathon runners: the comparison with other runners is not so important to me, but being able to compare my runs with previous ones to sense how I am evolving it is very important.
  • Having one central place to store my running/training data, race results, training information, etc.: again, extremely important.

What about you?

Leave a comment

Filed under Sports

Rotterdam Marathon preview

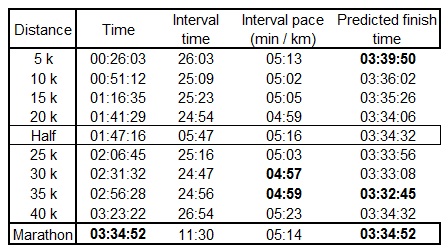
Next Sunday, April 13th, I will take part in the Rotterdam Marathon together with the usual suspects (Jaime, Serna and Manuel). I am arriving to this marathon a bit short of training as I already reflected at the time of running Blagnac’s half marathon about a month ago. I may have completed just about 2/3 of the training plan I followed, having run just about 500km in the 16 weeks preceding the marathon. Thus, in this preview instead of talking about how I arrive to it I wanted to focus on the front of the race.

Rotterdam marathon is one of the fastest marathons in the world nowadays. On top of that, I learnt a few weeks ago that Kenyan athlete Eliud Kipchoge will take part in it. Kipchoge has today the 7th best time (1) in the distance (2h4’5″), achieved in only his second attempt at a marathon, in Berlin on the 29th of September 2013, when Wilson Kipsang beat the World Record (2h3’23”). I then wondered whether on Sunday a new world record could be set.

To be clear, setting up an athletics record is not an easy feat. Especially not in a marathon. But taking that question as a departure point I deep dived a bit into the data in order to learn more about the race.

The last time the marathon WR record was set in Rotterdam was in 1988 (26 years ago), when Belayneh Densamo left it at 2:06:50. Since then the WR has been beaten 8 times; once in Chicago, once in London and 6 times in Berlin, among them the last 5 times (see here the progression). Thus, we could confidently say that Berlin is the fastest marathon nowadays.

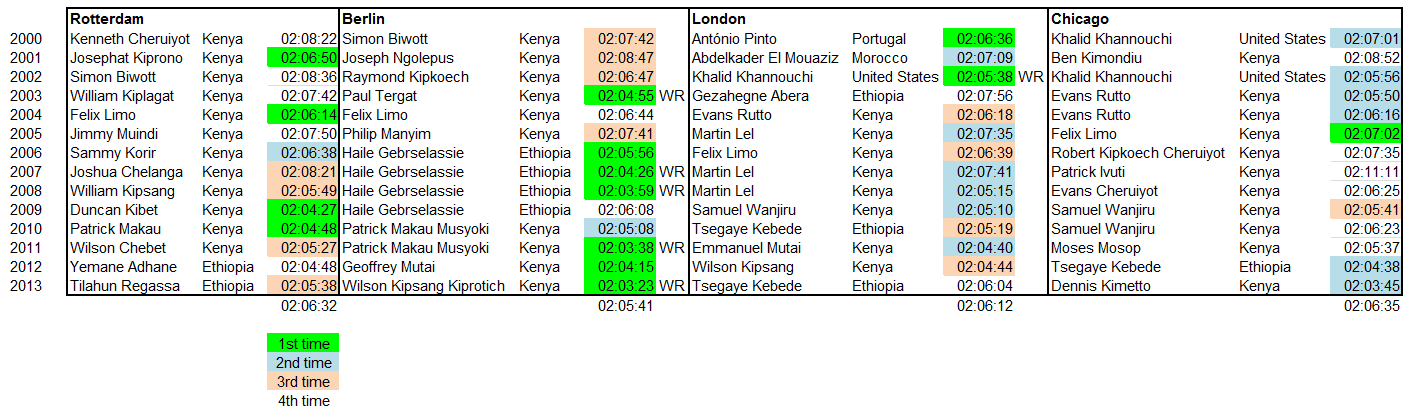
I then made a comparison of those 4 fast marathons over the last 14 years (since 2000), to see which one was the fastest race each of those years. See the results in the table below:

World fastest marathons (2000-2014).

World fastest marathons (2000-2014).

In the table you may see that out of the 14 years Berlin was the fastest of the 4 marathons in 7 (50%), however Rotterdam was the fastest marathon in 4 of those years (with a best time of 2h4’27”). By average winning times it would came 3rd (with a 2h6’32”) just after Berlin and London.

A curiosity, only twice in the past 14 years has the same runner won both Rotterdam and Berlin marathons in the same natural year: Felix Limo (2004) and Patrick Makau (2010) (2), both times each runner made a faster time in Rotterdam.

My train of thought then suggested: you are only paying attention to the winners’ times, you should compare more times to sense the profile of the race. I then found the following terrific website with all time best performances in track and field (maintained by Peter Larsson). With that database the analysis was rather simple.

I focused on the top 100 all-time marathon best times, of those:

  1. Berlin: 15 of the 100 all-time best times were achieved in Berlin, with a top 5 average time of 2h3’53” and a top 10 average of 2h4’18”.
  2. Chicago: 13/100; 2h4’29” (top 5); 2h5’4″ (top 10).
  3. Dubai: 18/100; 2h4’39” (top 5); 2h4’46” (top 10).
  4. Rotterdam: 14/100; 2h4’40” (top 5); 2h5’54” (top 10).
  5. London: 14/100; 2h5’02” (top 5); 2h5’15” (top 10).

Taking into account the top 100 times, Rotterdam marathon falls to the 4th place, seeing the irruption of Dubai as one of the top marathons, with all those times achieved in the last 6 years (run since 2000).

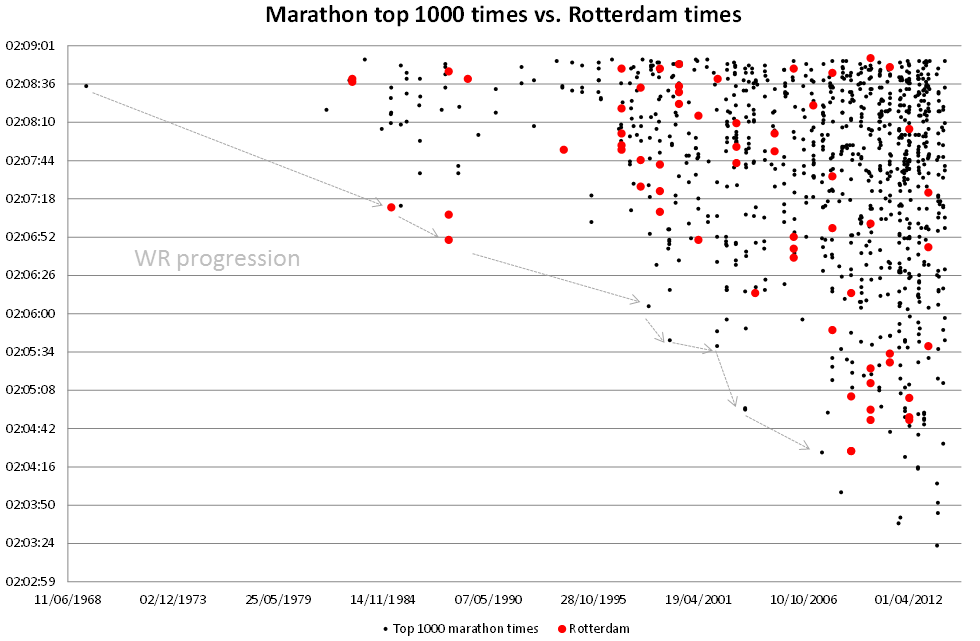
I then went a further step and made the following graph taking into account the top 1,000 times achieved in the last 45 years and highlighted in red those achieved in Rotterdam:

Marathon top 1000 times vs. those achieved in Rotterdam.

Marathon top 1000 times vs. those achieved in Rotterdam.

With those top 1,000 times, I then went back to compare the head to head of Rotterdam vs. Berlin, this time not only comparing winners times as above (Limo and Makau) but all those runners who run consecutively Rotterdam and Berlin, and checked in which race did they achieve the fastest of the 2 (or 3) times. See the results:

Runners among top 1,000 marathon times having run consecutively in Rotterdam and Berlin.

Runners among top 1,000 marathon times having run consecutively in Rotterdam and Berlin.

Of the top 1,000 marathon times, 16 runners achieved some of then running consecutively in Rotterdam and Berlin (or viceversa) (3). I made this comparison assuming that they must have been in a similar fitness (though not necessary). Of the 16, 9 of them achieved the better time in Rotterdam, 7 in Berlin. Among those times, the best 4 were achieved in Rotterdam (James Kipsang Kwambai, Patrick Makau, Geoffrey Mutai, Abel Kirui).

Then, having seen all these times, tables and graphics:

  • In the last 16 years the marathon WR has been beaten once every second year (8 times).
  • Rotterdam is arguably between the 2nd and the 4th fastest marathon.
  • However, the best time in Rotterdam (2h4’27”, Duncan Kipkemboi in 2009) is only the 14th best time overall.
  • Kipchoge PB is among the top 7 times after only his 2nd attempt at the distance.
  • Kipchoge ran in Berlin in September 2013 (2h4’5″), chances are that he beats that time running consecutively in Rotterdam in 2014.

Given the size of the feat I would not bet much on it, but I would not discard it either. Either way, I will only discover what happened about 2 hours after the race, at the front, has finished.

In case you feel like cheering me up and feel sorry for being thousands of kilometers away, don’t worry: click on this link and you will arrive at a website provided by the organization in which you can leave either one or two support messages that will be shown to me when I run by the kilometer 37 or I am just 500m from the finish line (my bib number for this race will be 1599).

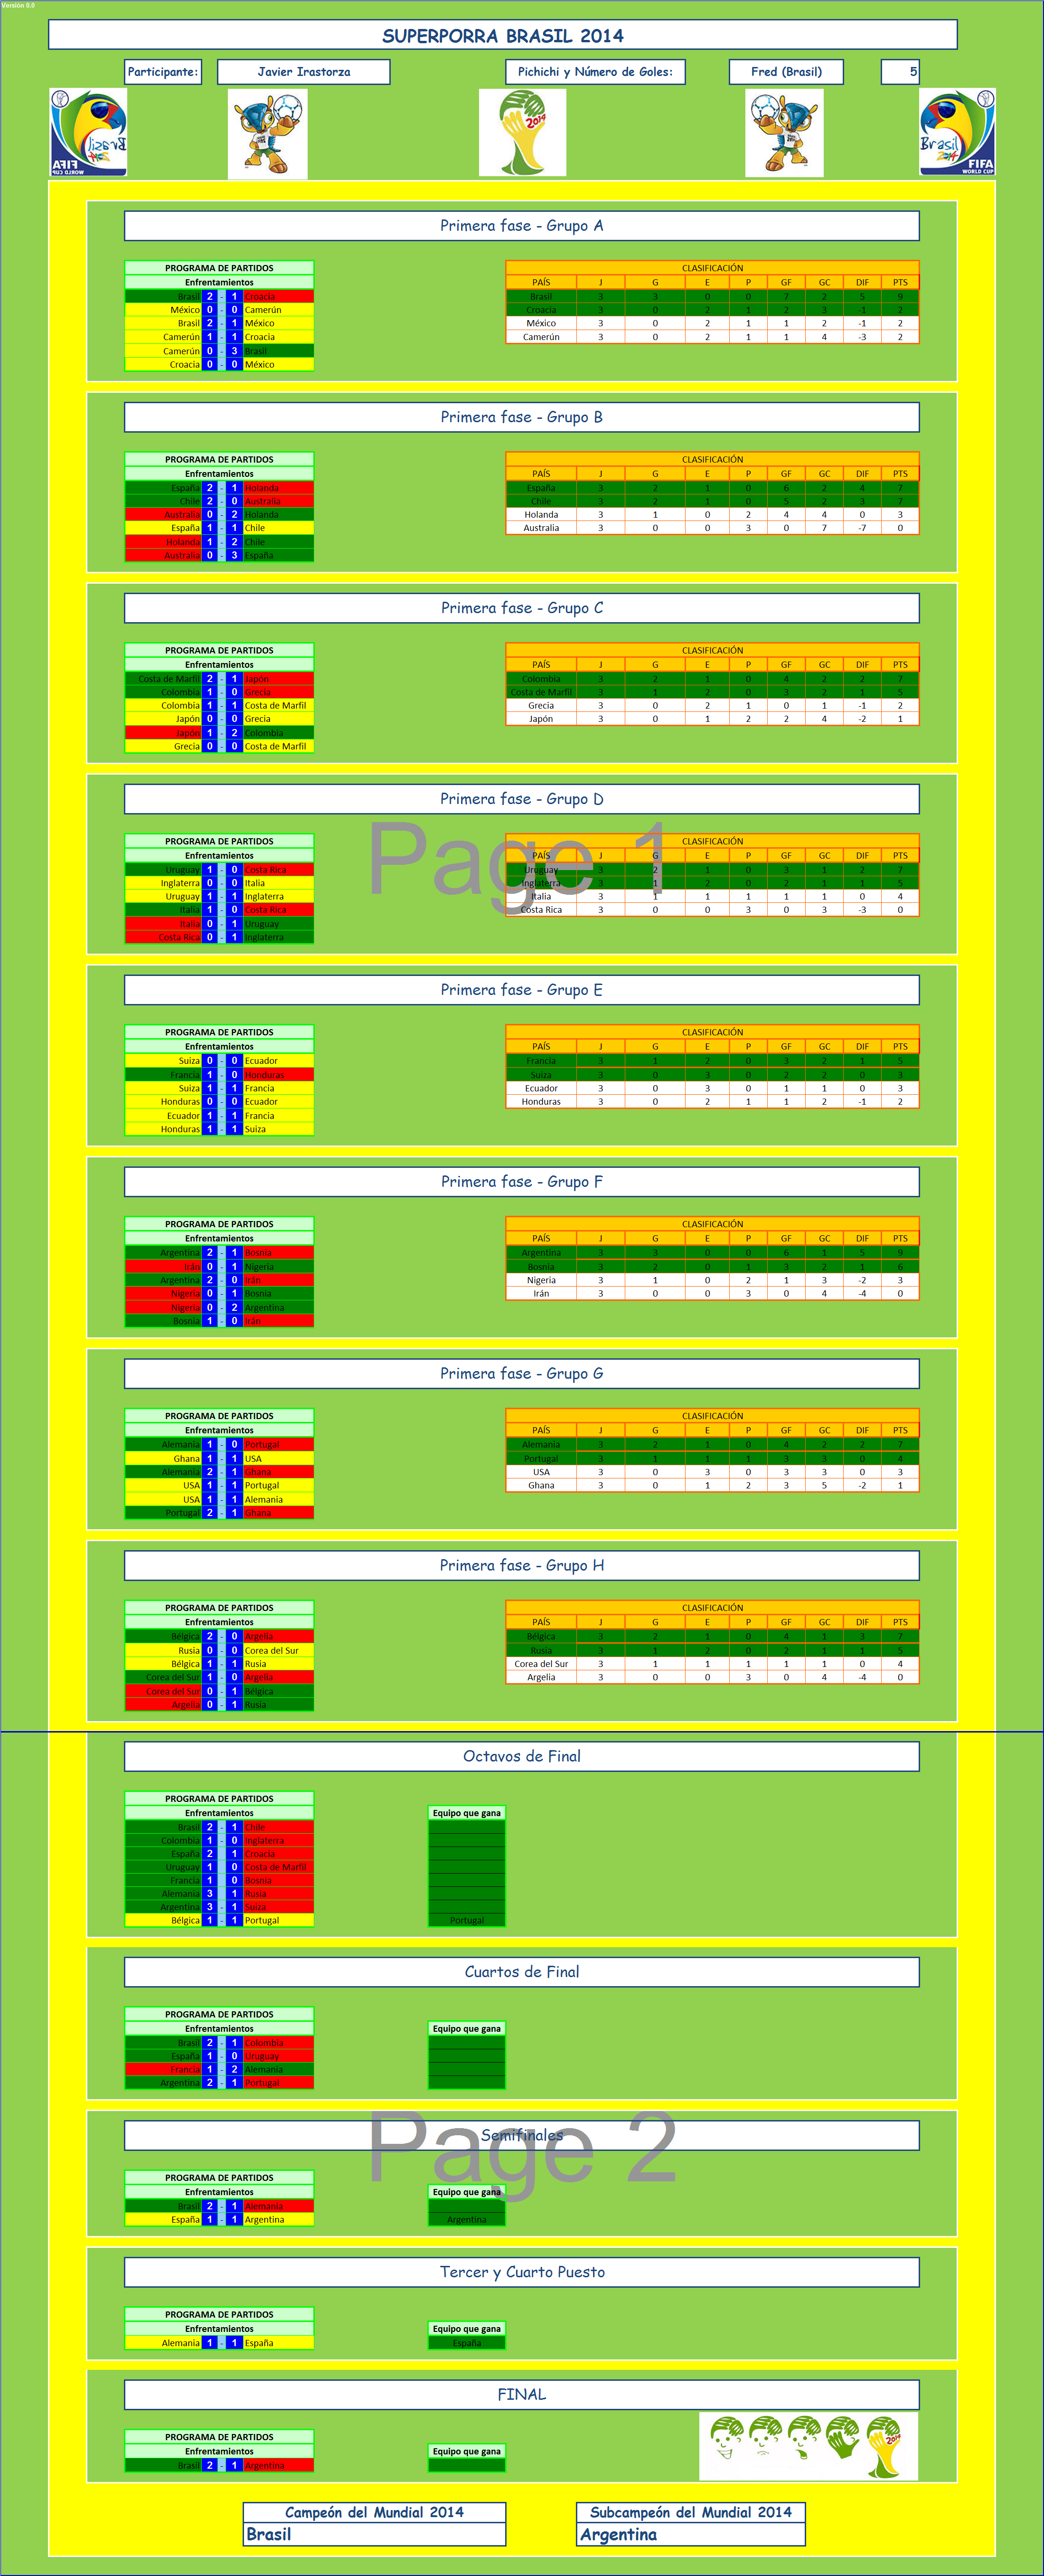
Finally, find a classic picture from my brother (and marathon pal) Jaime symbolizing this marathon:

(1) Excluding times from Boston and other races not qualifying for IAAF world records.

(2) A year later, in 2011, Patrick Makau set a new WR in Berlin, 2h3’38”.

(3) Felix Limo, Geoffrey Kipsang and Jackson Koech run 3 consecutive races in a row each.

5 Comments

Filed under Sports

Blagnac half marathon 2014

After 2 months without competing, I took part today in Blagnac’s half or semi marathon.

In this 2014, I am finding it hard to find the necessary consistency with the training. I go from fulfilling a week of training to just run 2 or 3 days the following week. It’s an issue of motivation, engagements and fatigue. That is why, today, I had not in mind pursuing any personal best time in the distance (1h37’29”). I rather checked beforehand the paces needed to achieve 1h40′ and 1h45′ and I targeted at the start line for 1h40′.

The day was sunny and windy. But it was way to sunny and hot, and a bit too windy for some of the long straight streets. Nevertheless, Blagnac’s half is completely flat. Thus, the main issue today was the lack of fitness.

I started with 2 kilometres at about 4’30” and then adapted the pace to try to continue at about 4’45” in order to be under 1h40′. However, in the second half of the race I felt that I wasn’t going to make it. It was hard for me to keep the pace.  Thus, I just tried to maintain a rhythm which was not painful and at the same time would permit to clock a time below 1h45′ and so I did. That is the good thing of having a plan B, or making it (making up the numbers in your head) on the fly (or rather run).

In the end, I finished in 1h44’19” net time as recorded by my Garmin. Definitely not the best half I have done (I haven’t done so many). I take it as a training and a test for Rotterdam Marathon, in about a month (April 13th). I will need to get more serious in the remaining weeks of training prior to that date if I don’t want that marathon to be a nightmare.

After finishing Blagnac's half marathon.

After finishing Blagnac’s half marathon.

1 Comment

Filed under Sports

San Silvestre 2013

Yet another year running on New Year’s Eve the popular San Silvestre Vallecana.

This year we had some newcomers to the community: Maicol, Alicia, Almudena and Ubaldo with friends (1) and Nacho managed to run again.

Jaime was running his 15th San Silvestre in a row. Impressive!

This race is a tradition that can hardly be matched (2), that is one of the reasons why I try to spend every year New Year’s Eve in Madrid. Again, we had talked a bit about dressing some costume or preparing something for the race but we did not.

This year my second half of the race was less fun than other years. Just after the kilometre 3 I let myself lag behind our main group to join two of our runners to talk a bit. At the km 4.5, not seeing the rest of the group, I decided to go ahead again in pursuit of them. After some 2-3 kilometres running a bit faster (~5’05″/km) than we normally do in this race (~6’30″/km) I realized that I had overtaken them without seeing them. What do I do now? Wait for them? Run softly till the end? Finally, I tried to run moderately fast when the crowd permitted (very difficult in the last 2 km).

I crossed the finish line alone, something which I think had not happened to me in over 10 years… and hopefully the last time.

Final time: ~1h00’51” (best time I have managed in ages, departing at the back of the pack).

(1) Though compared to last year we missed Pablo, Juanma and Abraham.

(2) In 2013, during the honeymoon I run the Bay to Breakers in San Francisco, which in essence is very similar. Except that it is not on New Year’s Eve and there is much less of a crowd cheering the runners.

Leave a comment

Filed under Sports

Brazil 2014 FIFA World Cup: “group of death”? (using ESPN ranking)

In a previous blog post I used FIFA world rankings to see which was the “group of death” of the following Brazil 2014 World Cup finals.

I received some comments questioning FIFA ranking based on the position of some specific countries: Switzerland, Portugal, Argentina, Colombia, Chile… I am sure that when one looks at how each country is playing he will believe that this or that country plays much better than the other placed higher in the ranking. But, the goodness of the ranking is that it removes perceptions from the process and simply establishes a set of rules by which all teams are going to be measured. It then goes on computing teams’ results along the year and the positions in the ranking are established, for good and bad.

In one of the comments I received I got the suggestion to rather use ESPN Soccer Power Index (SPI) ranking. I was even more attracted to that hint as the ESPN SPI index was introduced by the economist Nate Silver of worldly fame, who many readers will know from his forecasts on recent elections in the USA (check his blog FiveThirtyEight).

In a post from 2009, when the SPI was introduced, just before the 2010 World Cup, he explained how the index was computed (“A Guide to ESPN’s SPI rankings”). As he explained, the process had 4 main steps:

  • Calculate competitiveness coefficients for all games in database
  • Derive match-based ratings for all international and club teams
  • Derive player-based ratings for all games in which detailed data is available
  • Combine team and player data into a composite rating based on current rosters; use to predict future results.
ESPN SPI ranking at the end of Nov 2013.

ESPN SPI ranking at the end of Nov 2013.

The main difference in relation to FIFA ranking algorithm is that it takes player-based ratings for those players who play in clubs in the Big Four leagues (England, Spain, Italy, Germany) and the UEFA Champions’ League. The player-based rating is merged into the national team coefficient. The player-based rating weighs heavily in national teams with many players playing in the main leagues (e.g. England or Spain national teams) and less heavily in other nations which roster is composed of many players not playing in clubs of the 4 main leagues (e.g. Russia).

Other details of the ESPN’s approach are similar to those used by FIFA: e.g. giving weights to results depending on the opponent, measuring the competitiveness of the match, the different confederations, etc.

You can see the top ranked countries at the picture above.

Without entering on whether this or that country is far better placed in one or the other ranking based on perceptions, one simple yardstick to measure them is to see how many of their 32 top countries are not among the 32 countries qualified for the World Cup:

  • FIFA ranking: 7 teams among the top 32 are not in the World Cup: Ukraine (18), Denmark (25), Sweden (27), Czech Republic (28), Slovenia (29), Serbia (30) and Romania (32). All coming from Europe, and not qualified for the World Cup due to the limited amount of places for UEFA countries (they all placed 2nd or 3rd in their groups).
  • ESPN SPI ranking: 6 teams among the top 32 are not in the World Cup: Paraguay (19), Serbia (20), Ukraine (21), Peru (27), Sweden (29) and Czech Republic (30). 4 countries from Europe and 2 from South America, out for the same reason. Here however, Paraguay is still placed 19th despite of being the last country of the CONMEBOL qualifying.

With the information from the ESPN SPI ranking I produced the same table:

Brazil 2014 groups heat map based on ESPN SPI ranking.

Brazil 2014 groups heat map based on ESPN SPI ranking.

And then, the same analysis as in my previous post follows.

The most difficult groups in terms of total ratings are:

  1. B (Spain, Netherlands, Chile, Australia) with 327.
  2. D (Uruguay, Costa Rica, England, Italy) with 323.
  3. G (Germany, Portugal, Ghana, USA) with 322.

Looking at the average ranking, the most difficult groups are:

  1. D (Uruguay, Costa Rica, England, Italy) with 14.
  2. G (Germany, Portugal, Ghana, USA) with 15,25.
  3. B (Spain, Netherlands, Chile, Australia) with 17,5.

And excluding the rating of the favorite team (pot 1) in each group, which is the favorite facing the toughest group?

  1. Uruguay in group D, facing 239.
  2. Spain in group B, facing 238.
  3. Germany in group G, facing 234.

Then, combining the 3 approaches, the toughest group is between B (in terms of combined ratings) or D (in terms of average rating and from the favourite point of view).

Using the ESPN ranking group G would definitely would not be the toughest one, but the 3rd toughest.

I would understand ESPN journalists calling group B or D the toughest one. What strikes me is why FIFA website content editors call group B the “group of death” if by their ranking that group would be the group G!

It will be interesting to see how one ranking fares against the other at the time of predicting the actual development of the Brazil 2014 World Cup.

2 Comments

Filed under Sports

Brazil 2014 FIFA World Cup: “group of death”?

The draw of the groups for the Final phase of the football World cup to take place in Brazil from June 2014 has taken place today. As it always does, it drew much attention and right afterwards lots of speculation, especially to identify which one will be the so-called “group of death”.

I read in the Spanish sports press that Group B, where Spain is placed, is called as “lethal”. I thought to myself: “playing the victims before the competition”. Then I read in the FIFA website:

Spain, the Netherlands, Chile and Australia will make up the proverbial ‘group of death’ at the 20th FIFA World Cup™, while Uruguay, Italy, England and Costa Rica will comprise another intriguing pool.

Well, no.

Take a look at the groups in the picture. What would be your guess as to the most difficult or the easiest group?

Brazil 2014 groups

Brazil 2014 World Cup groups.

FIFA ranking end Nov 2013

FIFA ranking end Nov 2013

I then decided to take a quantitative approach using precisely FIFA world rankings, a classification made up with the points each country is getting for their results every month.

FIFA uses a formula to compute those points:

M x I x T x C = P

M: winning, drawing or losing a match

I: importance of the match

T: strength of opposing team

C: confederation strength weights

P: points for a game

Take a look in the picture in the right, to see the FIFA rankings at the end of November, just before the draw has taken place. You will see Spain in the top spot with 1,507 points, well ahead of Germany, Argentina, etc. Most of the countries in the top 23 that you can see in the picture are represented in the World Cup with the exception of Ukraine. See the whole ranking here.

With this information I built the following table, attaching to each country in the different groups the current ranking and points. Then, I calculated the average ranking of each group and the total amount of points. I then, also summed up the amount of points per group excluding the favourite in each group, showing in that way which has been the most difficult or the easiest group for the favourite countries (those placed in the pot 1 of the draw). Finally, I coloured results in a heat map: more red, more difficult. Which is then the “group of death”?

FIFA 2014 groups heat map.

FIFA 2014 groups heat map.

As you can see the most difficult groups in terms of total points are:

  1. G (Germany, Portugal, Ghana, USA) with 4,358.
  2. B (Spain, Netherlands, Chile, Australia) with 4,191.
  3. D (Uruguay, Costa Rica, England, Italy) with 4,031.

Looking at the average ranking, the most difficult groups are:

  1. G (Germany, Portugal, Ghana, USA) with 11,25.
  2. D (Uruguay, Costa Rica, England, Italy) with 14,25.
  3. C (Colombia, Greece, Côte d’Ivoire, Japan) with 20,25.

And excluding the points of the favorite team (pot 1) in each group, which is the favorite facing the toughest group?

  1. Germany in group G, facing 3,040.
  2. Uruguay in group D, facing 2,899.
  3. Spain in group B, facing 2,684.

Then, combining the 3 approaches, to me it becomes clear that the toughest group is G, with Germany, Portugal, Ghana and USA, by the total amount of points, ranking of the teams and in relation to what Germany will face.

Then, I would say that the second most difficult group is D, both looking at ranking and from the point of view of Uruguay. The third being group B (though between D and B, depends on the approach).

On the other hand, for the Netherlands, Chile and Australia (the worst team of the competition) it is clear that group B is the most difficult, as from their point of view their group has the most points excluding themselves (mainly thanks to the 1,507 of Spain).

Finally, after having done the analysis and seeing the heading of conversations on groups’ difficulty are taking I realize how few people have read about “Soccernomics” or “Moneyball“… just like with stock markets, at least this is just football.

8 Comments

Filed under Sports