I have a work colleague who not only is a tremendous negotiator and aircraft seller but also has a great sense of humor and manages in his free time late in the night to set up a contest for office staff to try to guess winners, matches’ scores, top scorers, etc., of major international soccer competitions. The France Euro 2016 which starts this afternoon could not be missed. Nacho managed to set up the contest in time.
In this post I am going to explain how I went about forecasting the results of the UEFA Euro 2016.
“when in doubt, build a model”, Nate Silver.
The readers of this blog may already know how much I do like to build models to produce forecasts, guesstimates, etc. In relation to forecasting this UEFA Euro 2016 there is some background that has shaped my mind in relation to the subject in the recent years, let me give you some hints:
- I read some time ago a couple of books about the use of data in sports: “Soccernomics“ (for which I wrote a review), which among other things advocates the use of that data in order to make decisions in relation to football transfer market, forecasting, etc., and “Moneyball” (on which Soccernomics is inspired) another book which I read years months ago with a similar scope but with baseball as the theme sport.
- I have read some other books, not linked to sports, which approach how we make decisions and how to remove different kind of biases from the thought processes of making them: “Thinking Fast and Slow” (by the 2002 winner of the Nobel Prize in Economics Daniel Kahneman), “Seeking Wisdom“ (by Peter Bevelin), “Poor Charlie’s Almanack: The Wit and Wisdom of Charles T. Munger” (by Charlie Munger, compiled by Peter D. Kaufman) and more recently “Pensar con Arte“ (by Manuel Conthe).
- A couple of years ago, I followed the open course “A Beginner’s Guide to Irrational Behavior” by Dan Ariely.
Having shared this background, you may understand that I tried to remove all the beauty of guessing and my football knowledge out of the forecasting process (1).
I rather made use of:
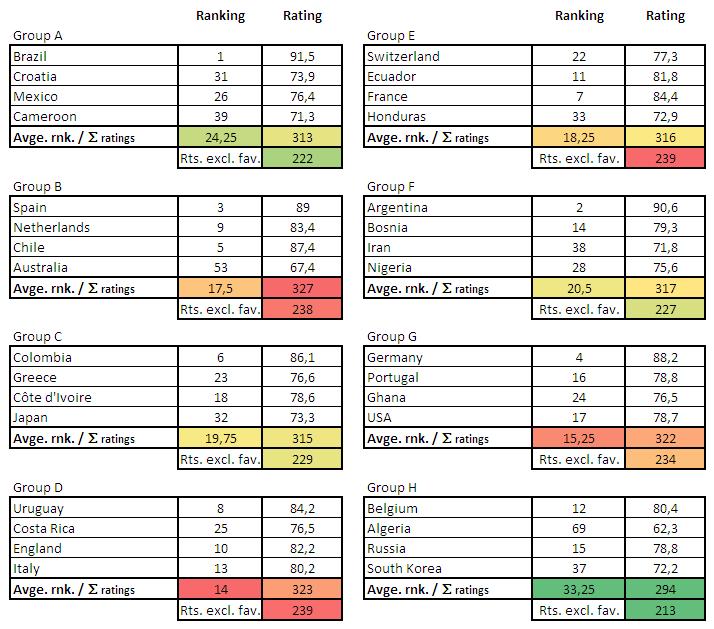
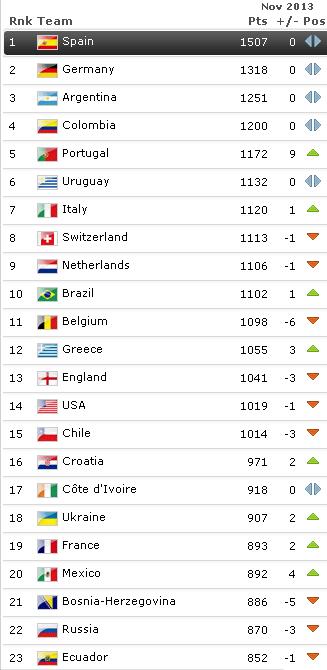
- ESPN Soccer Power Index (SPI) ranking, introduced by the economist Nate Silver. I used its offensive and defensive scores plus weight for each of the scores based on a tip indicating that in competitive matches the defensive factor tends to be slightly more important (see “A Guide to ESPN’s SPI rankings”) (2).
- The frequency of different scores in the group phases of the Euro 2012 and the World Cup 2010, the in the round of 16, quarter finals and semi-finals.

- A few simple rules about how to allocate results given the difference between SPI ratings of the two nations playing each match. (3)
- The total number of goals during group phases the latest Euro and World Cup. In order to cross check that the total numbers of goals that my forecast yielded was in check with previous competitions.
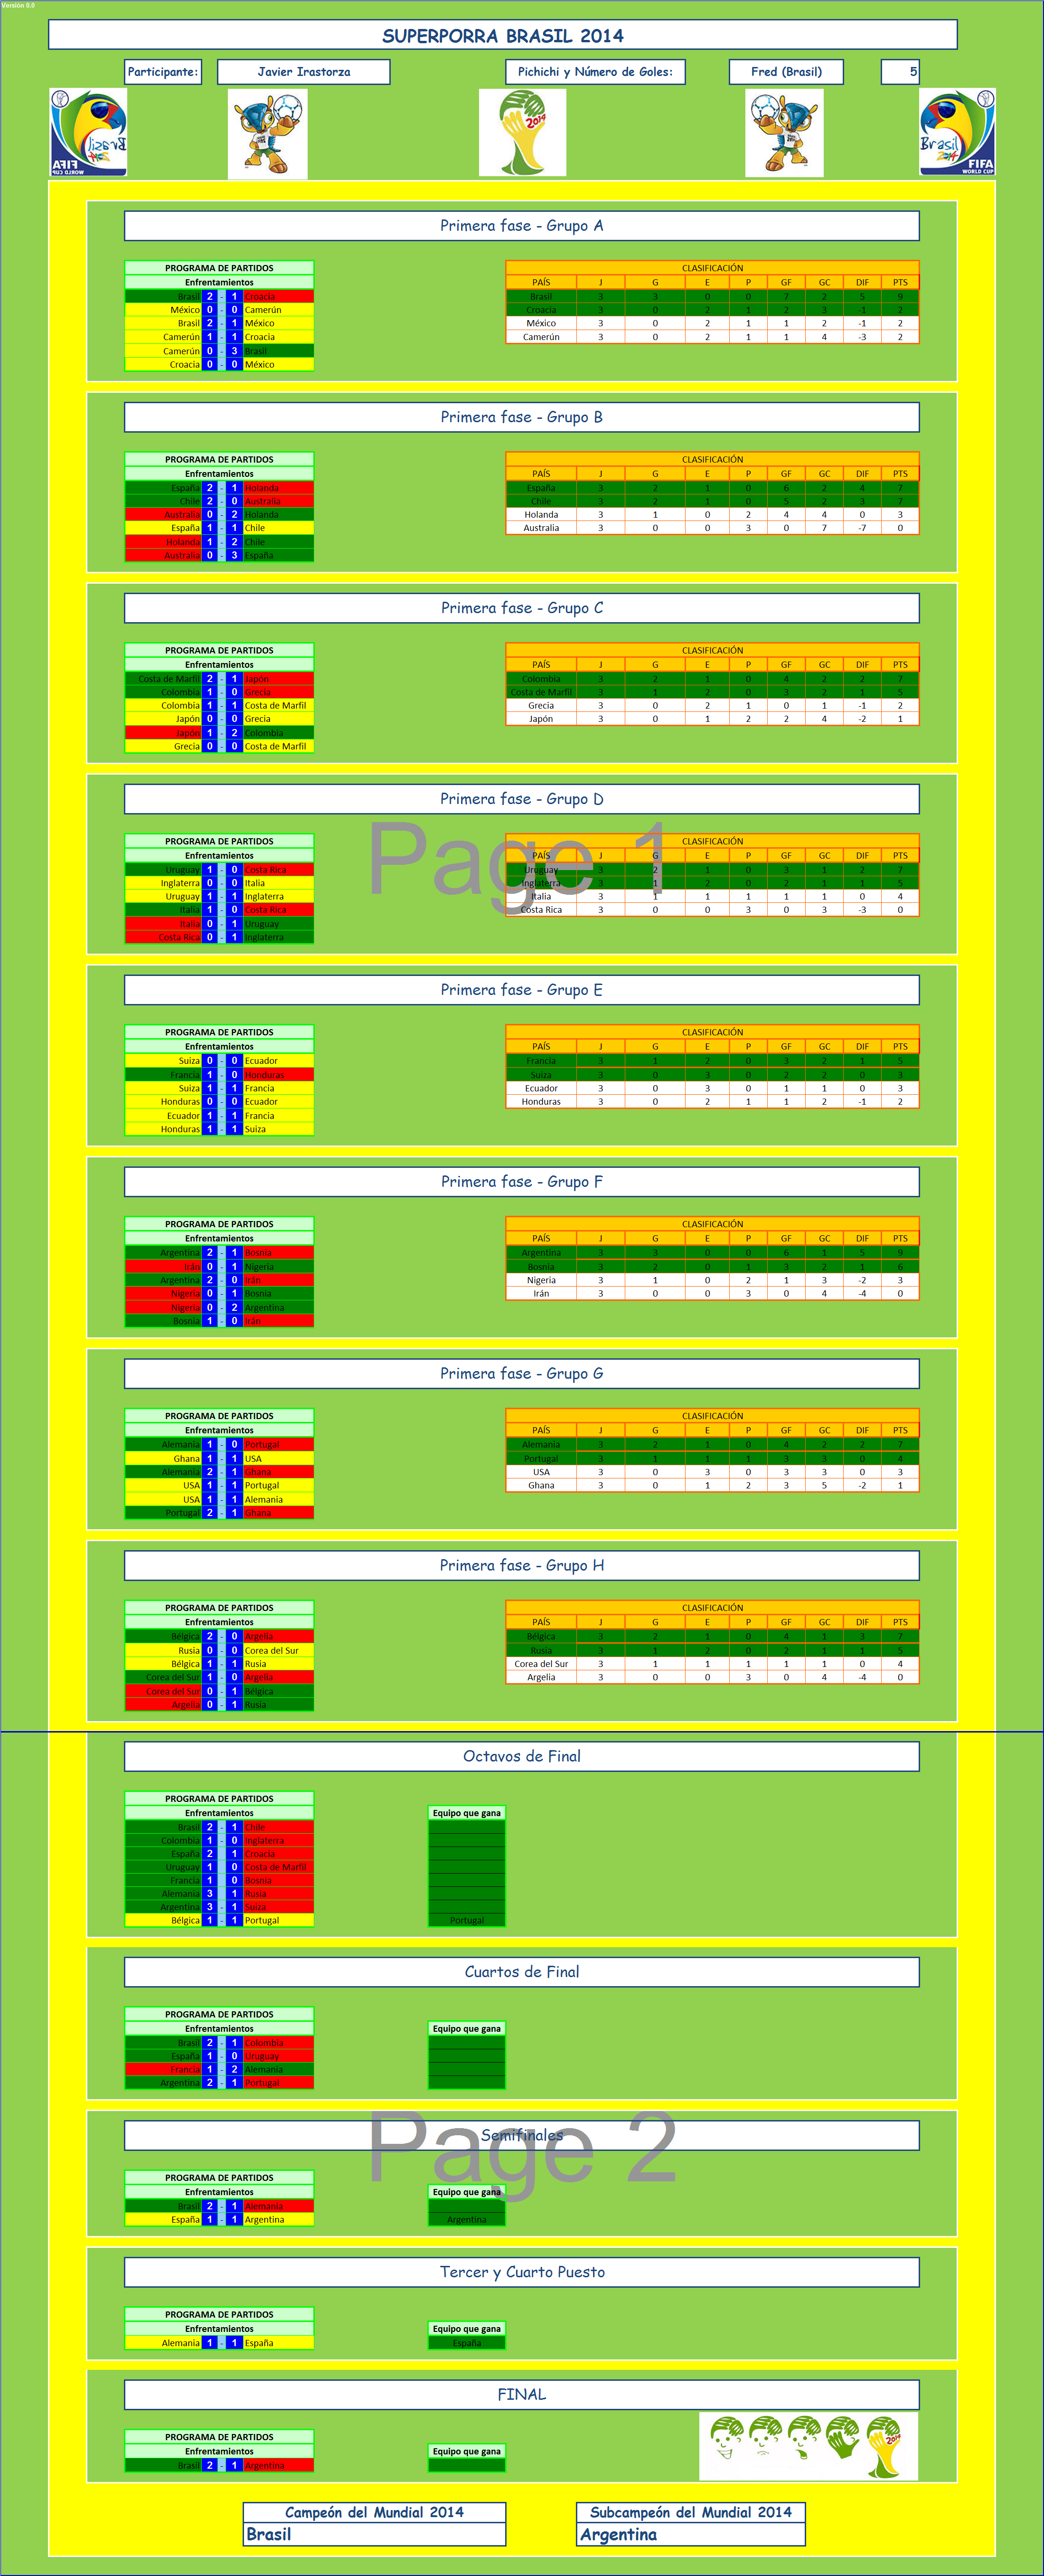
It may sound very complex. It is not. It requires a bit of reading (which most of it I did years ago), retrieving the latest ratings, giving it a bit of thought to set up the model and then, not even looking at the names of the teams, you go about allocating the scores based on raw figures. Let’s see how my forecast fares this time! (4)

“Les grandes personnes aiment les chiffres” (5), the Little Prince.
—
(1) In fact I have not watched a single national team football match from any country since the World Cup in Brazil in 2014.
(2) See here the blog post I published yesterday in which I made a more thorough review of the ESPN SPI index.
(3) I set up rules like “if the difference of the combination of indices of the two nations is below this threshold, I take it as a draw, if it is between x and y as victory by 1 goal, if higher…”, etc.
(4) This way of forecasting allowed me to finish 4th out of 47 in 2010, 15th out of 87 in 2014. As it removes biases it allows to be better than the average, though it prevents you of guessing outliers, gut feelings, etc.
(5)”Adults love figures”.
Note: In the blog post from yesterday I mentioned that the latest complete ranking from the ESPN SPI index that I could retrieve dated from October 2015. That is the one I have used, therefore, Germany results as winner. Of the latest ranking, covering the Top 25 nations, only 13 countries of the 24 competing at the Euro 2016 are included. I could have set up an hybrid ranking taking the latest rankings and ratings for the top 13 from June and using the October figures for the lower 11 teams. I decided to go on with a single set of data. If I had done so, the maing changes would have come from the semifinals onwards. France would have appeared as winner instead of Germany. We’ll see if that was a good decision.