Tag Archives: Soccernomics

The penalty shoot-outs are a lottery

Recently, the 2016 UEFA Champions League final (between Real Madrid and Atletico de Madrid) was decided in a penalty shoot-out, so was the 2016 Copa America Centenario final (Chile – Argentina) and so have already been a couple of matches in the round of 16 and quarter finals of the ongoing UEFA Euro 2016 (Switzerland – Poland and yesterday’s Poland-Portugal). You could expect one or two more matches in that competition to be decided in such a way.

“The penalty shoot-outs are a lottery”

This is a mantra repeated once and again each time the extra time of a football match comes to an end and the score is still a draw. Yet penalty shoot-outs are not a lottery. However, asking TV or radio football commentators to describe this aspect of the game as “two-person zero-sum game that meets von Neumann’s Minimax theorem” would be too much.

Years ago, while reading the book “Soccernomics“, by Simon Kuper and Stefan Szymanski (book review here), I came to know a couple of papers on penalties and penalty shoot-outs published by the Spanish economist Ignacio Palacios Huerta (at the London School of Economics).

Penalties

In a first paper, Professionals Play Minimax (2002, and its annex) [PDF, 335 KB and 342 KB], by analyzing over 1,400 penalty kicks, he came to confirm that professionals do play Minimax, a game theory rule decision model in which they try to minimize the worst outcome not knowing the strategy of their opponent.

The object of the paper itself is to try to find a natural setting in which von Neumann’s theorem implication can be tested. Penalty kicks turns out to be such a natural setting, the reasons enabling the game to be so are: there are few strategies available to the players (basically shooting left or right for the kickers, or jumping to his left or right for the keepers), it is a two-player zero-sum game and the outcome of the game (goal or no goal) is immediate after a strategy is chosen.

Studying those over a thousand penalties and in particular those of 42 players (kickers and keepers) who have been each one involved in over 30 penalties in the time span of the study (1995-2000), the author came to the following findings:

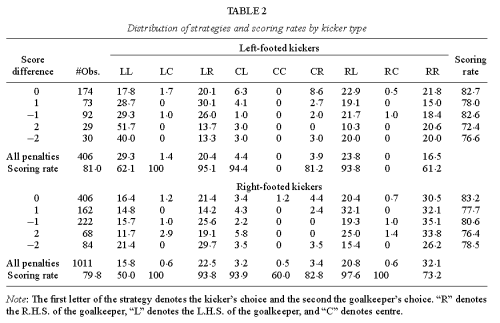
  • Kickers have practically the same probability of scoring with different mix of strategies (being a strategy alternating between shooting left or right by a given proportion).
  • Players are capable of generating truly random sequences of choices (left – right). This is remarkable, as humans, when asked to produce a random sequence, normally over do it and shy away from what would be truly random.
  • Some figures: players shoot to their natural side (with the interior of the feet, shooting left to a right footed) just above 50% of the times, keepers jump to the natural side of the kicker slightly more often.
  • When the keeper “guesses” the side to which the kicker is shooting, the scoring probability greatly differs depending on whether it was the kicker’s “natural side”, 71%, or the non-natural side, 55%. When the keeper jumps to the wrong side the scoring probability is about 95% with no big difference between natural or non-natural side.
  • During a match the average scoring rate is about 80%, with the rate decreasing as the match comes to an end (73% for penalties in the last 10 minutes).
  • Some players during the years of the study (1995-2000) had significantly better scores; in particular Mendieta (91% and no matter whether he kicked to his natural (68% of the times) or non-natural side (32%)), Del Piero and Juninho (especially strong on their natural side (94%) and above average in their non-natural (87%)) or Bergkamp (91% and 88%).
  • Strategies between players varied greatly. As I said Mendieta had a 68/32 (natural / non-natural), whereas Batistuta had a 81/19 and Baggio a 45/55, all with above average scoring success. Other players like Zidane, Mihajlovic or Chiesa managed an undistinguishable 50/50.

See a couple of interesting tables below:

Minimax table 1

Minimax table 2

Even more interesting is his second paper.

Penalty shoot-outs

In a second paper, “Psychological Pressure in Competitive Environments: Evidence from a Randomized Natural Experiment” (2009, with Jose Apesteguia) [PDF, 342 KB], Palacios Huerta wants to find out how emotions play a major effect on performance and to do so he takes a look at penalty shoot-outs from major football competitions.

For this study he reviewed over 2,800 penalty kicks in about 270 penalty shoot-outs. He divides the observations in two blocks, before and after FIFA changed the rules governing the shoot-outs in 2003. Before that date, the team of the captain winner of a toss of a coin started kicking first; after the change in the rules, the captain winner of the toss of a coin chooses which team kicks first.

Before 2003, the fact of kicking first or not was random, and after 1,343 kicks in 129 shoot-outs, the authors found out that the first in kicking in the sequence win the penalty shoot-out 60.5 percent of the time. (1)

As part of his study, Palacios Huerta made a survey questioning over 200 football players and coaches in Spain, professionals and amateurs, what would they choose if they had won the toss of a coin to decide which team kicks first in a penalty shoot-out. The results offer not doubt: over 95% of the cases chose to kick first. When asked why they would choose that option they indicated “to put pressure on the rivals”.

Experience matched the survey. After the change of FIFA rules in 2003, Palacios Huerta gathered data of another 140 penalty shoot-outs up to 2008 (just before writing his paper). Those were the first 140 penalty shoot-outs in which the winner of the toss of a coin had to choose whether he wanted his team to kick first or his opponent to kick first. In just a single case did the winner of the toss of a coin choose to let the opponent to kick first: Gianluigi Buffon playing for Italy the quarter-final of the Euro cup in 2008 against Spain, with the result that Spain won the penalty shoot-out and went to win the Euro, starting a streak of 3 consecutive major competitions at national level (Euro 2008, World Cup 2010 and Euro 2012).

Take a look at the following graphics and tables that let you read how the probabilities of scoring each penalty in a shoot-out evolve depending on previous outcomes (whether the team is behind, even or ahead) and the probability of winning the shoot-out (hence qualifying to the next phase or winning the competition) evolve.

ScoringProbabilitiesperRound

PenaltyShootOut_ScoringProbabilities

I highlighted in the previous table in blue and yellow the scoring probability for each kick and the winning percent of the shoot-out for a shoot-out in which both teams go about scoring each of the penalties. It is interesting, if not dramatic, to see how while the scoring probability for the first team is always between 72 and 78% (2), for the second team it drops from 82% to 62-66% for rounds 3 to 5. Similarly, the winning probability decreases for the second team down to 21-23% just before attempting kicks 3 and 4 if all previous penalties have been scored.

See below that 2008 penalty shoot-out between Spain and Italy.

After having commented on these two papers and its conclusions, let me share a few comments and anecdotes:

MILAN, ITALY - MAY 28: Cristiano Ronaldo of Real Madrid scores the winning penalty during the UEFA Champions League Final match between Real Madrid and Club Atletico de Madrid at Stadio Giuseppe Meazza on May 28, 2016 in Milan, Italy. (Photo by Shaun Botterill/Getty Images)

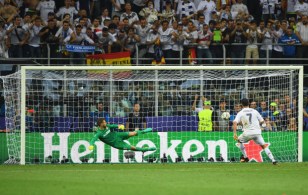
MILAN, ITALY – MAY 28: Cristiano Ronaldo of Real Madrid scores the winning penalty during the UEFA Champions League Final. (Photo by Shaun Botterill/Getty Images)

Toss of a coin. Both 2016 Copa America Centenario final and UEFA Champions League final were won by the team which kicked the first penalty, Chile and Real Madrid, respectively. In the draw, using the toss of a coin, to decide which team kicked first Chile chose to kick first (see here the video). However, in the Champions League final, Atletico de Madrid’s captain Gabi chose to let Real Madrid kick first. Apparently, he chose that as they had kicked second in the round of 16 of that same competition against PSV Eindhoven and passed. Somehow he tried to repeat the sequence thinking that this would bring them luck. Well, with that decision he put his team against about 60-40% odds backed by over 30 years of recorded experience and about 270 shootouts. Not a clever move. See this article “La buena mala suerte del Churu” by Manuel Jabois discussing this toss of a coin (in Spanish). See here the video.

“[…] we find a systematic first-mover advantage. Further, professionals are self-aware of their own psychological effects and, when given the chance, they rationally react by systematically taking advantage of these effects.” (Palacios-Huerta)

1024x1024As reflected above, in the paper, Palacios-Huerta indicates that between 2003 and 2008 only once in 140 samples did the winner of the toss chose to let the opponent kick first. That is why it was striking what Gabi did and why it called the attention of some football fans. Well, yesterday, during the first match of the Euro 2016 quarter finals between Poland and Portugal, we had yet another such example, another anomaly. This time it was Robert Lewandowski, the Polish captain, the perpetrator. He won the toss of the coin and chose that Portugal kicked first. I can imagine how Cristiano Ronaldo might have felt at that moment, the second time in just 6 weeks that he was being handed such a present. Portugal won the shoot-out.

Palacios Huerta and other analysts receive requests for dedicated reports about kicking patterns, records and data of different teams when playing knock-out phases. In Soccernomics, Simon Kuper and Stefan Szymanski, describe how that happened during the 2008 UEFA Champions League final between Manchester United and Chelsea. Palacios Huerta had given Chelsea some tips on Manchester kickers and keeper (van der Saar): “Van der Sar tends to dive to the kicker’s natural side”, “most of the penalties that Van der Sar stops are mid-height, thus is better to shoot low or high”, “if Cristiano Ronaldo stops half-way in the run-up to the ball chances are 85% that he shoots to his natural side”…, it is quite interesting to actually see that penalty shoot-out and how the different players acted. See below the video. Apparently Van der Saar saw how Cech, Chelsea’s keeper had some paper in his hands and also noticed how kickers were shooting to their non-natural side, until at the 7th penalty (~9’30” in the video) he defies Anelka by pointing to Anelka’s non-natural side, like saying “I know you have the tip to kick there”, then…

For the record, the final was won by Manchester, first in kicking.

Finally, ever since coming to know all this information I have enjoyed penalty shootouts more than before. I now entertain myself seeing the strategy taken by the keepers and kickers, whether the keeper jumps to the natural side of the kicker more or less than in 60% of the shots, if he changes his strategy depending on whether the kicker is left or right-footed, whether kickers shoot more or less than 60% of the shots to their natural side, etc.

Les grandes personnes aiment les chiffres“, Le Petit Prince.

(1) At the time of the Copa de America Centenario final, the Spanish journalist Alexis Sanchez (better know by his profile @2010MisterChip), expert in providing all kind of football statistics, tweeted that Chile, being the first in kicking in the penalty shootout against Argentina had a 55% chance of winning the tournament. Thus, it may be the case that he has a larger (not public) database including more penalty shootout.

(2) Note how probabilities in shoot-outs decrease from the average of 80% of penalties during the match.


Leave a comment

Filed under Sports

Forecasting France Euro 2016

I have a work colleague who not only is a tremendous negotiator and aircraft seller but also has a great sense of humor and manages in his free time late in the night to set up a contest for office staff to try to guess winners, matches’ scores, top scorers, etc., of major international soccer competitions. The France Euro 2016 which starts this afternoon could not be missed. Nacho managed to set up the contest in time.

In this post I am going to explain how I went about forecasting the results of the UEFA Euro 2016.

“when in doubt, build a model”, Nate Silver.

The readers of this blog may already know how much I do like to build models to produce forecasts, guesstimates, etc. In relation to forecasting this UEFA Euro 2016 there is some background that has shaped my mind in relation to the subject in the recent years, let me give you some hints:

Having shared this background, you may understand that I tried to remove all the beauty of guessing and my football knowledge out of the forecasting process (1).

I rather made use of:

  • ESPN Soccer Power Index (SPI) ranking, introduced by the economist Nate Silver. I used its offensive and defensive scores plus weight for each of the scores based on a tip indicating that in competitive matches the defensive factor tends to be slightly more important (see “A Guide to ESPN’s SPI rankings”) (2).
  • The frequency of different scores in the group phases of the Euro 2012 and the World Cup 2010, the in the round of 16, quarter finals and semi-finals.

Frenquency

  • A few simple rules about how to allocate results given the difference between SPI ratings of the two nations playing each match. (3)
  • The total number of goals during group phases the latest Euro and World Cup. In order to cross check that the total numbers of goals that my forecast yielded was in check with previous competitions.

It may sound very complex. It is not. It requires a bit of reading (which most of it I did years ago), retrieving the latest ratings, giving it a bit of thought to set up the model and then, not even looking at the names of the teams, you go about allocating the scores based on raw figures. Let’s see how my forecast fares this time! (4)

Porra Euro 2016

Les grandes personnes aiment les chiffres” (5), the Little Prince.

(1) In fact I have not watched a single national team football match from any country since the World Cup in Brazil in 2014.

(2) See here the blog post I published yesterday in which I made a more thorough review of the ESPN SPI index.

(3) I set up rules like “if the difference of the combination of indices of the two nations is below this threshold, I take it as a draw, if it is between x and y as victory by 1 goal, if higher…”, etc.

(4) This way of forecasting allowed me to finish 4th out of 47 in 2010, 15th out of 87 in 2014. As it removes biases it allows to be better than the average, though it prevents you of guessing outliers, gut feelings, etc.

(5)”Adults love figures”.

Note: In the blog post from yesterday I mentioned that the latest complete ranking from the ESPN SPI index that I could retrieve dated from October 2015. That is the one I have used, therefore, Germany results as winner. Of the latest ranking, covering the Top 25 nations, only 13 countries of the 24 competing at the Euro 2016 are included. I could have set up an hybrid ranking taking the latest rankings and ratings for the top 13 from June and using the October figures for the lower 11 teams. I decided to go on with a single set of data. If I had done so, the maing changes would have come from the semifinals onwards. France would have appeared as winner instead of Germany. We’ll see if that was a good decision.

Leave a comment

Filed under Sports

Forecasting 2014 FIFA World Cup Brazil

I have a work colleague who not only is a tremendous negotiator and contracts’ drafter but also has a great sense of humor and manages in his free time late in the night to set up a contest for office staff to try to guess winners, matches’ scores, top scorers, etc., of major international soccer competitions. The 2014 FIFA World Cup in Brazil, which will start tomorrow, could not be missed. Nacho managed to set up the contest in time.

To set up the background as to how I have approached the game of forecasting this World Cup:

  • I had written a review of the book “Soccernomics“, which among other things advocates the use of data in order to make decisions in relation to football transfer market, forecasting, etc. This book relies somewhat heavily in “Moneyball” another book which I read some months ago with a similar scope but with baseball as the theme sport.
  • When the draw of the World Cup took place last December, I wrote a couple of blog posts discussing what was the so-called “group of death” basing the analysis on FIFA and ESPN rankings.
  • During the last year, I read a couple of books which approach how we make decisions and how to remove different kind of biases from the thought processes of making them: “Thinking Fast and Slow” (by the 2002 winner of the Nobel Prize in Economics Daniel Kahneman) and “Seeking Wisdom“.
  • Finally, last year I followed the open course “A Beginner’s Guide to Irrational Behavior” by Dan Ariely (though I missed the last exam due to my honeymoon and could not get credit for it).

Having shared this background, you may understand that I tried to remove all the beauty of guessing and my football “knowledge” to the forecasting process. I rather made use of  ESPN Soccer Power Index (SPI) ranking, introduced by the economist Nate Silver. I used its offensive and defensive scores plus the tip indicating that in competitive matches the defensive factor tends to be slightly more important (see “A Guide to ESPN’s SPI rankings”).

Once I plugged in the numbers from the index and used the referred tip on the defensive side, I built a simple model to guess each of the World Cup matches. Once you take this approach you will find that the model gives you plenty of results such as Nigeria 1.32 – 1.53 Bosnia… What to do with it? When the result was very tight I resolved it as a draw, otherwise a victory for the team with the highest score.

In very few instances I forecast that a team would score 3 or more goals in a match. I bore in mind that in the 2010 World Cup 80% of the matches ended up with scores of 1-0 (26% of the matches), 2-1 (15%), 0-0, 1-1 or 2-0 (each 13%).  That a team scores more than 3 goals in a match will certainly happen in some games, but I did not bother to guess in which ones, the odds are against.

The prize pot of the game organized by this colleague is not particularly big (few hundreds euros). The main point of the game is enjoying the chit-chat with work colleagues. My second main point is putting this rational approach to work and see how it fares.

Finally, what did I forecast?

A World Cup won by Brazil against Argentina in the final. With Spain beating Germany for the third place (in the penalties). For my English readers: England defeated by Colombia in the 1/8 of final. For the ones from USA, it doesn’t make the cut from the group phase. We will see along this month how well do I fare.

2014 FIFA World Cup Brazil forecast.

2014 FIFA World Cup Brazil forecast.

1 Comment

Filed under Sports

Brazil 2014 FIFA World Cup: “group of death”? (using ESPN ranking)

In a previous blog post I used FIFA world rankings to see which was the “group of death” of the following Brazil 2014 World Cup finals.

I received some comments questioning FIFA ranking based on the position of some specific countries: Switzerland, Portugal, Argentina, Colombia, Chile… I am sure that when one looks at how each country is playing he will believe that this or that country plays much better than the other placed higher in the ranking. But, the goodness of the ranking is that it removes perceptions from the process and simply establishes a set of rules by which all teams are going to be measured. It then goes on computing teams’ results along the year and the positions in the ranking are established, for good and bad.

In one of the comments I received I got the suggestion to rather use ESPN Soccer Power Index (SPI) ranking. I was even more attracted to that hint as the ESPN SPI index was introduced by the economist Nate Silver of worldly fame, who many readers will know from his forecasts on recent elections in the USA (check his blog FiveThirtyEight).

In a post from 2009, when the SPI was introduced, just before the 2010 World Cup, he explained how the index was computed (“A Guide to ESPN’s SPI rankings”). As he explained, the process had 4 main steps:

  • Calculate competitiveness coefficients for all games in database
  • Derive match-based ratings for all international and club teams
  • Derive player-based ratings for all games in which detailed data is available
  • Combine team and player data into a composite rating based on current rosters; use to predict future results.
ESPN SPI ranking at the end of Nov 2013.

ESPN SPI ranking at the end of Nov 2013.

The main difference in relation to FIFA ranking algorithm is that it takes player-based ratings for those players who play in clubs in the Big Four leagues (England, Spain, Italy, Germany) and the UEFA Champions’ League. The player-based rating is merged into the national team coefficient. The player-based rating weighs heavily in national teams with many players playing in the main leagues (e.g. England or Spain national teams) and less heavily in other nations which roster is composed of many players not playing in clubs of the 4 main leagues (e.g. Russia).

Other details of the ESPN’s approach are similar to those used by FIFA: e.g. giving weights to results depending on the opponent, measuring the competitiveness of the match, the different confederations, etc.

You can see the top ranked countries at the picture above.

Without entering on whether this or that country is far better placed in one or the other ranking based on perceptions, one simple yardstick to measure them is to see how many of their 32 top countries are not among the 32 countries qualified for the World Cup:

  • FIFA ranking: 7 teams among the top 32 are not in the World Cup: Ukraine (18), Denmark (25), Sweden (27), Czech Republic (28), Slovenia (29), Serbia (30) and Romania (32). All coming from Europe, and not qualified for the World Cup due to the limited amount of places for UEFA countries (they all placed 2nd or 3rd in their groups).
  • ESPN SPI ranking: 6 teams among the top 32 are not in the World Cup: Paraguay (19), Serbia (20), Ukraine (21), Peru (27), Sweden (29) and Czech Republic (30). 4 countries from Europe and 2 from South America, out for the same reason. Here however, Paraguay is still placed 19th despite of being the last country of the CONMEBOL qualifying.

With the information from the ESPN SPI ranking I produced the same table:

Brazil 2014 groups heat map based on ESPN SPI ranking.

Brazil 2014 groups heat map based on ESPN SPI ranking.

And then, the same analysis as in my previous post follows.

The most difficult groups in terms of total ratings are:

  1. B (Spain, Netherlands, Chile, Australia) with 327.
  2. D (Uruguay, Costa Rica, England, Italy) with 323.
  3. G (Germany, Portugal, Ghana, USA) with 322.

Looking at the average ranking, the most difficult groups are:

  1. D (Uruguay, Costa Rica, England, Italy) with 14.
  2. G (Germany, Portugal, Ghana, USA) with 15,25.
  3. B (Spain, Netherlands, Chile, Australia) with 17,5.

And excluding the rating of the favorite team (pot 1) in each group, which is the favorite facing the toughest group?

  1. Uruguay in group D, facing 239.
  2. Spain in group B, facing 238.
  3. Germany in group G, facing 234.

Then, combining the 3 approaches, the toughest group is between B (in terms of combined ratings) or D (in terms of average rating and from the favourite point of view).

Using the ESPN ranking group G would definitely would not be the toughest one, but the 3rd toughest.

I would understand ESPN journalists calling group B or D the toughest one. What strikes me is why FIFA website content editors call group B the “group of death” if by their ranking that group would be the group G!

It will be interesting to see how one ranking fares against the other at the time of predicting the actual development of the Brazil 2014 World Cup.

2 Comments

Filed under Sports

Brazil 2014 FIFA World Cup: “group of death”?

The draw of the groups for the Final phase of the football World cup to take place in Brazil from June 2014 has taken place today. As it always does, it drew much attention and right afterwards lots of speculation, especially to identify which one will be the so-called “group of death”.

I read in the Spanish sports press that Group B, where Spain is placed, is called as “lethal”. I thought to myself: “playing the victims before the competition”. Then I read in the FIFA website:

Spain, the Netherlands, Chile and Australia will make up the proverbial ‘group of death’ at the 20th FIFA World Cup™, while Uruguay, Italy, England and Costa Rica will comprise another intriguing pool.

Well, no.

Take a look at the groups in the picture. What would be your guess as to the most difficult or the easiest group?

Brazil 2014 groups

Brazil 2014 World Cup groups.

FIFA ranking end Nov 2013

FIFA ranking end Nov 2013

I then decided to take a quantitative approach using precisely FIFA world rankings, a classification made up with the points each country is getting for their results every month.

FIFA uses a formula to compute those points:

M x I x T x C = P

M: winning, drawing or losing a match

I: importance of the match

T: strength of opposing team

C: confederation strength weights

P: points for a game

Take a look in the picture in the right, to see the FIFA rankings at the end of November, just before the draw has taken place. You will see Spain in the top spot with 1,507 points, well ahead of Germany, Argentina, etc. Most of the countries in the top 23 that you can see in the picture are represented in the World Cup with the exception of Ukraine. See the whole ranking here.

With this information I built the following table, attaching to each country in the different groups the current ranking and points. Then, I calculated the average ranking of each group and the total amount of points. I then, also summed up the amount of points per group excluding the favourite in each group, showing in that way which has been the most difficult or the easiest group for the favourite countries (those placed in the pot 1 of the draw). Finally, I coloured results in a heat map: more red, more difficult. Which is then the “group of death”?

FIFA 2014 groups heat map.

FIFA 2014 groups heat map.

As you can see the most difficult groups in terms of total points are:

  1. G (Germany, Portugal, Ghana, USA) with 4,358.
  2. B (Spain, Netherlands, Chile, Australia) with 4,191.
  3. D (Uruguay, Costa Rica, England, Italy) with 4,031.

Looking at the average ranking, the most difficult groups are:

  1. G (Germany, Portugal, Ghana, USA) with 11,25.
  2. D (Uruguay, Costa Rica, England, Italy) with 14,25.
  3. C (Colombia, Greece, Côte d’Ivoire, Japan) with 20,25.

And excluding the points of the favorite team (pot 1) in each group, which is the favorite facing the toughest group?

  1. Germany in group G, facing 3,040.
  2. Uruguay in group D, facing 2,899.
  3. Spain in group B, facing 2,684.

Then, combining the 3 approaches, to me it becomes clear that the toughest group is G, with Germany, Portugal, Ghana and USA, by the total amount of points, ranking of the teams and in relation to what Germany will face.

Then, I would say that the second most difficult group is D, both looking at ranking and from the point of view of Uruguay. The third being group B (though between D and B, depends on the approach).

On the other hand, for the Netherlands, Chile and Australia (the worst team of the competition) it is clear that group B is the most difficult, as from their point of view their group has the most points excluding themselves (mainly thanks to the 1,507 of Spain).

Finally, after having done the analysis and seeing the heading of conversations on groups’ difficulty are taking I realize how few people have read about “Soccernomics” or “Moneyball“… just like with stock markets, at least this is just football.

7 Comments

Filed under Sports

My 2012 reading list

At the beginning of the year I set as a personal objective to read at least 15 books. This will be a low number for some of you and a high one for others. To me it looked challenging but achievable… though, I did not achieve it. I completed 10 books and started other 4 which I have not yet finished (they’ll be included in the next year reading list).

See below the list with a small comment for each one, the link to a post about the book in the blog (when applicable), links to Amazon (in case you want to get them) and sometimes to the authors. I have also included a small rating from one to three “+” depending on how much do I recommend its reading:

  1. This time is different” (by C. Reinhart and K. Rogoff) (++): very interesting book offering a comprehensive book to economic and financial crises since 8 centuries ago. The book is full of graphics, statistics, example, anecdotes… I already wrote three posts about it: “The Republic of Poyais“, “The march toward fiat money” and “¿Cómo le ha ido a España en esta crisis?“. 
  2. Le Petit Prince” (by Antoine de Saint-Exupéry) (++): even if narrated as a children’s book, it contains several idealistic messages, fine criticisms of how adults behave, etc. The teachings are mainly transmitted through conversations between a child and the prince and encounters with other characters… I wrote a post about it “Le Petit Prince“.
  3. The consequences of the peace” (by John M. Keynes) (+++): the book was written at the time of the Versailles Conference after the World War I, which he attended as a delegate from the British Treasury. In the book, Keynes explained how the disaster in the making was being produced, due to lack of communication between representatives from USA, UK, France and Italy, and the intention from Clemenceau of taking as much as possible from Germany. Keynes makes a series of estimates of Germany’s production capabilities and that of the regions being taken from it and comparing them with the pretensions that were being included in the negotiations of the treaty. In the book, he warns well in advance the economic and social disaster that the treaty is going to send Germany into. (I have not yet written a specific review of the book, but since I had underlined several passages I don’t discard writing it).
  4. Le bal des ambitions” (by Véronique Guillermard and Yann le Galès) (+): the book tells the story behind the creation of EADS and its first years. Very much like in a thriller, it gives account about the characters involved, the battles for power, etc. I wrote a post about it “Le Bal des ambitions“.
  5. Desolé, nous avons raté la piste” (by Stephan Orth and Antje Blinda) (+): The book consists of a series of awkward situations in a flight described by passengers, pilots and cabin crew, mainly miscommunications between the crew and passengers or funny messages received from the cockpit. The book originated after a collection of the anecdotes posted by readers of the online version of Der Spiegel. . See the review I wrote about it “Sorry, I missed the runway“.
  6. Poor Charlie’s Almanack: The Wit and Wisdom of Charles T. Munger” (by Charlie Munger, compiled by Peter D. Kaufman) (+++): the book is a compilation of Munger’s speeches, quotes, interviews, articles, letters, etc. Some of his speeches are available in Youtube (e.g. this one given for the commencement of USC Law in 2007). One of the main takeaways is the use of several mental models to analyze situations we live in our lives (instead of being stalled in the few models which we are more comfortable with). Another recurring topic is the lack of training in psychology that we get (or even his criticism of how psychology is taught in faculties). I haven’t written a post about the book, but I think I should, if only to share more of his wit and wisdom with you.
  7. The Peter Principle: Why Things Go Wrong” (by Laurence J. Peter) (+++): the book is a hilarious account of situations that arise in companies and institutions of why and how people are promoted, cornered, etc., or in his words is a treatise on hierarchology. The name of the book comes from the Peter Principle which says: “In a hierarchy, every employee tends to rise to his level of incompetence”. I already wrote about it here.
  8. 2010 Odyssey Two” (by Arthur C. Clarke) (++): the book is a sequel to the famous “2001: A Space Odyssey“, and there is a movie as about this book. The story starts with doctor Heywood Lloyd travelling in a combined Soviet-American mission to Jupiter in order to find the spaceship Discovery One from the previous mission and what went wrong with it… I won’t tell more of the plot to avoid spoiling it for someone. I would say that I liked more this book (and movie) than the first one.
  9. The Litigators” (by John Grisham) (++): this novel is very much like most of John Grisham. In this one the plot is about a star young lawyer graduated from Harvard Law School who cannot stand the pressure from a big firm and quits it to join a mediocre small firm with two partners who chase victims of small accidents to help them get some  compensation from insurance companies, with the hope of reaching the big class action which could make the rich.
  10. Soccernomics” (by Simon Kuper and Stefan Szymanski) (+++): the authors use economics’ techniques, plenty of data, statistics, citing several papers, studies, etc., in order to bring up uncovered issues about football (such as transfer market, what makes some nations more successful in football…) or refocus the attention about other ones. See the review I wrote about it.

I also completed two other partial objectives: to read at least 2 books in French and 2 about politics/economy. And as always, on the learning side from reading there is Twitter (a source of information or distraction?), the subscriptions delivered to home of the weekly The Economist and the two monthly magazines Scientific American and Toastmasters.

10 Comments

Filed under Books

Soccernomics

Soccernomics.

If you love football (soccer) and have read one of the books of the “Freakonomics” saga or any book from Malcolm Gladwell, then “Soccernomics“, by Simon Kuper and Stefan Szymanski (430 pgs.), will be a great read for you.

The book is written in the same style as the other books mentioned above: using economics’ techniques, plenty of data, statistics, citing several papers, studies, etc., in order to bring up uncovered issues about football or refocus the attention about other ones. Some examples:

  • Mastering the transfer market. Departing from the example of Billy Beane in baseball, described in “Moneyball“, by Michael Lewis (of which a movie was also made starring Brad Pitt), the authors show how pouring money in transfer markets doesn’t bring titles. The key issue is to have a balanced net investment (sales/acquisitions). In soccer the main example would be Olympique Lyon which will “sell any player if a club offer more than he is worth”, for which each player is previously assigned a price (much like value investing).
  • The more money is paid to players the better (in salaries). Instead of buying new expensive players it seems to make more sense to pay well and ensure the adaptation of the stars already playing for the team.
  • The market for managers is not yet very open (e.g. no black coaches in main European teams), thus many of them do not make a real difference. There was even an English team Ebbsfleet United who dispensed the coach and allowed subscribed fans to vote the player selection for each match.
  • The book, written at the beginning of 2012 forecasted that soon teams from big European capitals would win the Champions’ League, being those capitals: London, Paris, Istanbul and Moscow. Few months later Chelsea won its first one, let’s see the others.
  • The main factors for the success of football national teams seem to be the experience (international games played by the national team), wealth and population.
  • The authors give much weight to Western Europe dominance of football due to the interconnectedness of continental Europe. Explaining the rise of Spain in the ’90s and ’00s due to its growth in population, improved economy since joining the EU, more experience and exchanges of styles with coaches of other countries.
  • The authors claim that future national football will be dominated by countries such as Iraq, USA, Japan or China.

As you can see there are many different topics, all with some data to support them (even if sometimes you doubt about the consistency of their claims, e.g. their statements on industrial cities as dominating football, dictatorships, etc.). I marked many pages with some anecdotes or papers that I would like to read.

One final anecdote: tips given to clubs and teams in KO competitions in case they face a penalty shoot-out. In the Champions’ League final of 2008, Chelsea and Manchester United reached the penalties. An economist had given Chelsea a study of Manchester goal keeper and penalty-shooters. Once you read the book and the tips the economist provided (“Van der Sar tends to dive to the kicker’s natural side”, “most of the penalties that Van der Sar stops are mid-height, thus is better to shoot low or high”, “if Cristiano Ronaldo stops half-way in the run-up to the ball chances are 85% that he shoots to his natural side”…), it is quite interesting to actually see that penalty shoot-out and how the different players acted.

[Pay special attention at Van der Sar’s reaction at 09’40”, when it seems he noticed about Chelsea having been tipped]

I definitely recommend this book to football fans. I also recommend two other books about which I wrote in the blog some time ago: “How soccer explains the World” and “Historias del fútbol mundial“.

8 Comments

Filed under Books, Sports