Tag Archives: World Cup

Forecasting 2018 FIFA World Cup in Russia

This a short post to share my forecast for the coming football 2018 FIFA World Cup to be played during the following five weeks in Russia.

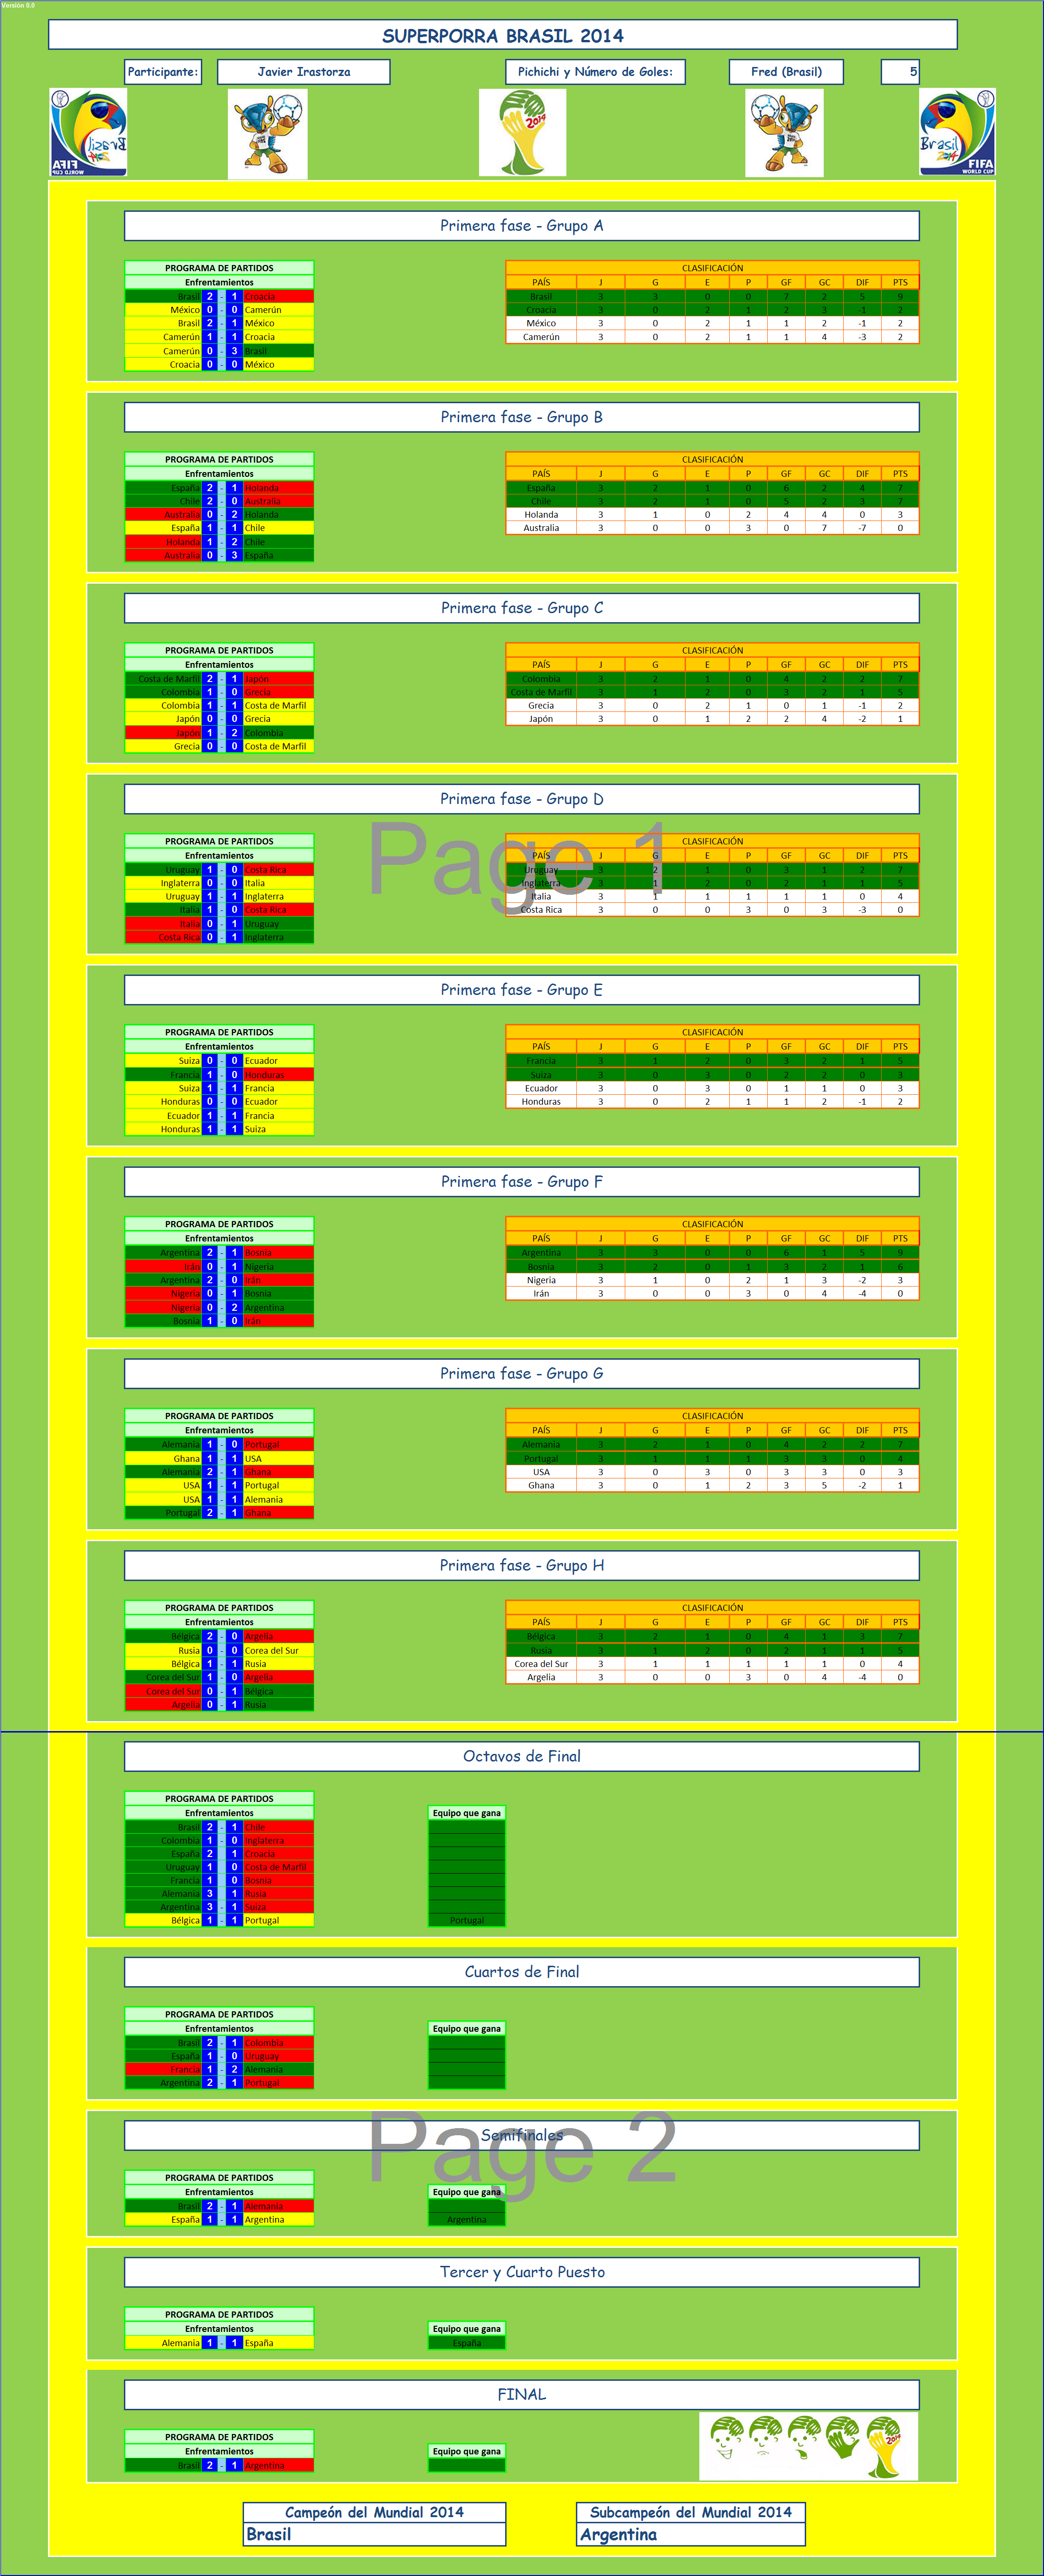
As I introduced in a similar post four years ago for the 2014 World Cup (here), I have a work colleague who not only is a tremendous aircraft salesman but also has a great sense of humor and manages in his free time late in the night to set up a contest for office staff to try to guess winners, matches’ scores, top scorers, etc., of major international soccer competitions. The 2018 FIFA World Cup in Russia, which will start this week, could not be missed. Nacho managed to set up the contest in time.

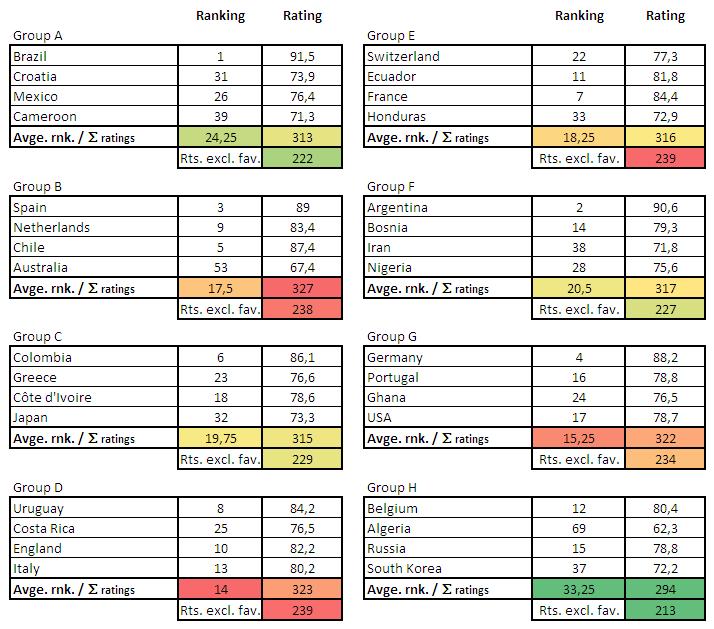
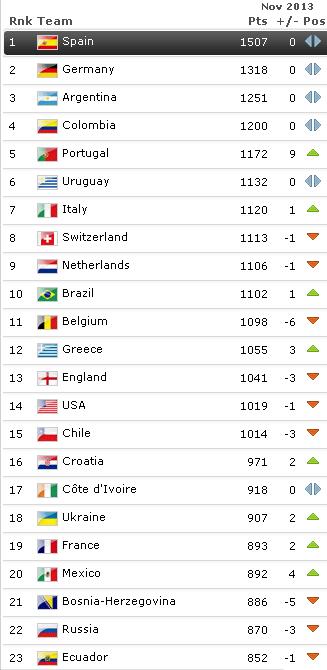
I have approached the game of forecasting this World Cup with the same method as previous times, as I have not watched a single match of national teams’ football since the previous World Cup and I have no clue of who is who and how they come to the competition. I have relied on ESPN rankings, and used its offensive and defensive coefficients to build with a simple algorithm all the scores of the competition:

  • taking into account the coefficients of both sides
  • when the difference between them was narrow, I put a draw, if resulting coefficients were high 2-2, if low, 0-0.
  • the same for victories, if the difference was high 3-0, if small and low coefficients, 1-0.
  • I also checked the numbers that different scores were repeated in the group phase in the previous two World Cups, as the most repeated ones are 2-1, 1-0, 0-0, in order to assign them in similar proportion.
  • I also checked the amounts of goals scored in the group phase of previous 2 World Cups (100 and 136 goals), to adjust the overall number of goals I would distribute.
  • Checked the goals the previous top scorers managed in World Cups to a assign a similar number.

What did I forecast?

  • A World Cup won by Brazil against Spain in the final in the penalty shootout.
  • An oddity: the algorithm provided that Spain would face 3 shootouts in this World Cup, we will see.
  • The forecast also provided that England would beat Colombia in a shootout, that may be even odder, given the historical bad luck of England at shootouts.
  • As top scorer I put Neymar (Brazil) with 6 goals.
Forecast_world_cup_2018

2018 FIFA World Cup Russia forecast.

Leave a comment

Filed under Sports

Museu do Futebol (São Paulo)

Referring to the different waves and streaks that football teams experience, the Argentinean Jorge Valdano made popular the sentence “A team is just a mood (1).

The Football Museum (Museu do Futebol) at the Sao Paulo‘s municipal Pacaembu stadium is an invitation to go through those moods, re-live some of those past moments anchored in the collective memory, by way of recorded sounds, cheering chants, radio excerpts of goals narrations, videos and interviews about the most important goals of Brazil history.

el-maracanazoYet, in my opinion, the most impacting mood, very well caught in the museum, is the transition from euphoria to depression, from music to complete silence, the tragedy of the losing the last match of 1950 World Cup between Brazil and Uruguay. A match that Brazil just needed to draw, started winning, yet lost it. The Maracanazo. In just 90 seconds, in a dark room you get submerged into the happiness of the day that would see Brazil win the first of many World Cups at the newly built Maracanã and then how the mood at the stadium changed with the first goal of Uruguay, then the second and at the end the final whistle from the referee.

Nevertheless, no matter how impacting the Maracanazo was for Brazil and football history, and how well captured it is at the museum, it would be unfair not to mention that in the museum there are many other very positive and happy moods of Brazilian football captured very well, too. If I went to think of Brazil, I would first think of happiness, football, music, dance; and those are experiences that accompany you along the museum.

The museum itself is centered around Brazil’s national football team, the only one which has won 5 World Cups to date, the country which practically at any point in time has one of the best 2 or 3 players of the World, the country of Pelé, Garrincha , Roberto Carlos, Ronaldo, Zico, Romario, Tostao, Rivaldo, Rai, Djalma Santos, Didi, Pepe, Gerson, Carlos Alberto, Rivellino, Socrates, Cafu, Bebeto, Rivaldo, Ronaldinho, Neymar… you name them.

DSC_0323The visit starts with a room where some players are picked as the most important to Brazil’s history; some images and biography of each one of them is offered.

The following room is dedicated to the goals, the main ingredient of the game. The 30 most celebrated goals in Brazil’s history are recorded and narrated by the authors or journalists (in Portuguese, English or Spanish). Several interactive screens are available for visitors to go through the different goals. There are also some desks where to listen to radio narrations recorded at the time of some of those goals.

See some of them in the video below (2).

The following rooms are dedicated to recordings of the chants of all the main teams competing at the Brasileirao; to Charles Miller, the man who introduced football in Brazil; and to a collection of pictures the years in which football was introduced in Brazil, showing life in Brazil at the time.

DSC_0326The largest space is dedicated to the World Cups, all of them, not only the ones won by Brazil. Some context of the society, cultural movements and events going on at the time are shown, together with images of the Brazilian team competing at the championship, the winners, some charismatic players and vivid images of the competition. That is another room where to wander with time enough to be captivated by the evolution of football, the players and events of the times.

There is another space dedicated to the couple Pele and Garrincha: with them playing together in the field, Brazil never lost a match (out of some 40 joint appearances). Some personal objects, pictures and videos of their best tricks are shown.

The last rooms are dedicated to football rules, some statistics, women in football and the chance to try a penalty kick against a featured Julio Cesar, where your shot’s speed is measured (and then compared to a Roberto Carlos’ shot).

DSC_0336

(1) “Un equipo es un estado de ánimo”.

(2) The video is unrelated to the museum but contains some of the goals among those 30.

1 Comment

Filed under Sports, Travelling

Forecasting 2014 FIFA World Cup Brazil

I have a work colleague who not only is a tremendous negotiator and contracts’ drafter but also has a great sense of humor and manages in his free time late in the night to set up a contest for office staff to try to guess winners, matches’ scores, top scorers, etc., of major international soccer competitions. The 2014 FIFA World Cup in Brazil, which will start tomorrow, could not be missed. Nacho managed to set up the contest in time.

To set up the background as to how I have approached the game of forecasting this World Cup:

  • I had written a review of the book “Soccernomics“, which among other things advocates the use of data in order to make decisions in relation to football transfer market, forecasting, etc. This book relies somewhat heavily in “Moneyball” another book which I read some months ago with a similar scope but with baseball as the theme sport.
  • When the draw of the World Cup took place last December, I wrote a couple of blog posts discussing what was the so-called “group of death” basing the analysis on FIFA and ESPN rankings.
  • During the last year, I read a couple of books which approach how we make decisions and how to remove different kind of biases from the thought processes of making them: “Thinking Fast and Slow” (by the 2002 winner of the Nobel Prize in Economics Daniel Kahneman) and “Seeking Wisdom“.
  • Finally, last year I followed the open course “A Beginner’s Guide to Irrational Behavior” by Dan Ariely (though I missed the last exam due to my honeymoon and could not get credit for it).

Having shared this background, you may understand that I tried to remove all the beauty of guessing and my football “knowledge” to the forecasting process. I rather made use of  ESPN Soccer Power Index (SPI) ranking, introduced by the economist Nate Silver. I used its offensive and defensive scores plus the tip indicating that in competitive matches the defensive factor tends to be slightly more important (see “A Guide to ESPN’s SPI rankings”).

Once I plugged in the numbers from the index and used the referred tip on the defensive side, I built a simple model to guess each of the World Cup matches. Once you take this approach you will find that the model gives you plenty of results such as Nigeria 1.32 – 1.53 Bosnia… What to do with it? When the result was very tight I resolved it as a draw, otherwise a victory for the team with the highest score.

In very few instances I forecast that a team would score 3 or more goals in a match. I bore in mind that in the 2010 World Cup 80% of the matches ended up with scores of 1-0 (26% of the matches), 2-1 (15%), 0-0, 1-1 or 2-0 (each 13%).  That a team scores more than 3 goals in a match will certainly happen in some games, but I did not bother to guess in which ones, the odds are against.

The prize pot of the game organized by this colleague is not particularly big (few hundreds euros). The main point of the game is enjoying the chit-chat with work colleagues. My second main point is putting this rational approach to work and see how it fares.

Finally, what did I forecast?

A World Cup won by Brazil against Argentina in the final. With Spain beating Germany for the third place (in the penalties). For my English readers: England defeated by Colombia in the 1/8 of final. For the ones from USA, it doesn’t make the cut from the group phase. We will see along this month how well do I fare.

2014 FIFA World Cup Brazil forecast.

2014 FIFA World Cup Brazil forecast.

1 Comment

Filed under Sports

Brazil 2014 FIFA World Cup: “group of death”? (using ESPN ranking)

In a previous blog post I used FIFA world rankings to see which was the “group of death” of the following Brazil 2014 World Cup finals.

I received some comments questioning FIFA ranking based on the position of some specific countries: Switzerland, Portugal, Argentina, Colombia, Chile… I am sure that when one looks at how each country is playing he will believe that this or that country plays much better than the other placed higher in the ranking. But, the goodness of the ranking is that it removes perceptions from the process and simply establishes a set of rules by which all teams are going to be measured. It then goes on computing teams’ results along the year and the positions in the ranking are established, for good and bad.

In one of the comments I received I got the suggestion to rather use ESPN Soccer Power Index (SPI) ranking. I was even more attracted to that hint as the ESPN SPI index was introduced by the economist Nate Silver of worldly fame, who many readers will know from his forecasts on recent elections in the USA (check his blog FiveThirtyEight).

In a post from 2009, when the SPI was introduced, just before the 2010 World Cup, he explained how the index was computed (“A Guide to ESPN’s SPI rankings”). As he explained, the process had 4 main steps:

  • Calculate competitiveness coefficients for all games in database
  • Derive match-based ratings for all international and club teams
  • Derive player-based ratings for all games in which detailed data is available
  • Combine team and player data into a composite rating based on current rosters; use to predict future results.
ESPN SPI ranking at the end of Nov 2013.

ESPN SPI ranking at the end of Nov 2013.

The main difference in relation to FIFA ranking algorithm is that it takes player-based ratings for those players who play in clubs in the Big Four leagues (England, Spain, Italy, Germany) and the UEFA Champions’ League. The player-based rating is merged into the national team coefficient. The player-based rating weighs heavily in national teams with many players playing in the main leagues (e.g. England or Spain national teams) and less heavily in other nations which roster is composed of many players not playing in clubs of the 4 main leagues (e.g. Russia).

Other details of the ESPN’s approach are similar to those used by FIFA: e.g. giving weights to results depending on the opponent, measuring the competitiveness of the match, the different confederations, etc.

You can see the top ranked countries at the picture above.

Without entering on whether this or that country is far better placed in one or the other ranking based on perceptions, one simple yardstick to measure them is to see how many of their 32 top countries are not among the 32 countries qualified for the World Cup:

  • FIFA ranking: 7 teams among the top 32 are not in the World Cup: Ukraine (18), Denmark (25), Sweden (27), Czech Republic (28), Slovenia (29), Serbia (30) and Romania (32). All coming from Europe, and not qualified for the World Cup due to the limited amount of places for UEFA countries (they all placed 2nd or 3rd in their groups).
  • ESPN SPI ranking: 6 teams among the top 32 are not in the World Cup: Paraguay (19), Serbia (20), Ukraine (21), Peru (27), Sweden (29) and Czech Republic (30). 4 countries from Europe and 2 from South America, out for the same reason. Here however, Paraguay is still placed 19th despite of being the last country of the CONMEBOL qualifying.

With the information from the ESPN SPI ranking I produced the same table:

Brazil 2014 groups heat map based on ESPN SPI ranking.

Brazil 2014 groups heat map based on ESPN SPI ranking.

And then, the same analysis as in my previous post follows.

The most difficult groups in terms of total ratings are:

  1. B (Spain, Netherlands, Chile, Australia) with 327.
  2. D (Uruguay, Costa Rica, England, Italy) with 323.
  3. G (Germany, Portugal, Ghana, USA) with 322.

Looking at the average ranking, the most difficult groups are:

  1. D (Uruguay, Costa Rica, England, Italy) with 14.
  2. G (Germany, Portugal, Ghana, USA) with 15,25.
  3. B (Spain, Netherlands, Chile, Australia) with 17,5.

And excluding the rating of the favorite team (pot 1) in each group, which is the favorite facing the toughest group?

  1. Uruguay in group D, facing 239.
  2. Spain in group B, facing 238.
  3. Germany in group G, facing 234.

Then, combining the 3 approaches, the toughest group is between B (in terms of combined ratings) or D (in terms of average rating and from the favourite point of view).

Using the ESPN ranking group G would definitely would not be the toughest one, but the 3rd toughest.

I would understand ESPN journalists calling group B or D the toughest one. What strikes me is why FIFA website content editors call group B the “group of death” if by their ranking that group would be the group G!

It will be interesting to see how one ranking fares against the other at the time of predicting the actual development of the Brazil 2014 World Cup.

2 Comments

Filed under Sports

Brazil 2014 FIFA World Cup: “group of death”?

The draw of the groups for the Final phase of the football World cup to take place in Brazil from June 2014 has taken place today. As it always does, it drew much attention and right afterwards lots of speculation, especially to identify which one will be the so-called “group of death”.

I read in the Spanish sports press that Group B, where Spain is placed, is called as “lethal”. I thought to myself: “playing the victims before the competition”. Then I read in the FIFA website:

Spain, the Netherlands, Chile and Australia will make up the proverbial ‘group of death’ at the 20th FIFA World Cup™, while Uruguay, Italy, England and Costa Rica will comprise another intriguing pool.

Well, no.

Take a look at the groups in the picture. What would be your guess as to the most difficult or the easiest group?

Brazil 2014 groups

Brazil 2014 World Cup groups.

FIFA ranking end Nov 2013

FIFA ranking end Nov 2013

I then decided to take a quantitative approach using precisely FIFA world rankings, a classification made up with the points each country is getting for their results every month.

FIFA uses a formula to compute those points:

M x I x T x C = P

M: winning, drawing or losing a match

I: importance of the match

T: strength of opposing team

C: confederation strength weights

P: points for a game

Take a look in the picture in the right, to see the FIFA rankings at the end of November, just before the draw has taken place. You will see Spain in the top spot with 1,507 points, well ahead of Germany, Argentina, etc. Most of the countries in the top 23 that you can see in the picture are represented in the World Cup with the exception of Ukraine. See the whole ranking here.

With this information I built the following table, attaching to each country in the different groups the current ranking and points. Then, I calculated the average ranking of each group and the total amount of points. I then, also summed up the amount of points per group excluding the favourite in each group, showing in that way which has been the most difficult or the easiest group for the favourite countries (those placed in the pot 1 of the draw). Finally, I coloured results in a heat map: more red, more difficult. Which is then the “group of death”?

FIFA 2014 groups heat map.

FIFA 2014 groups heat map.

As you can see the most difficult groups in terms of total points are:

  1. G (Germany, Portugal, Ghana, USA) with 4,358.
  2. B (Spain, Netherlands, Chile, Australia) with 4,191.
  3. D (Uruguay, Costa Rica, England, Italy) with 4,031.

Looking at the average ranking, the most difficult groups are:

  1. G (Germany, Portugal, Ghana, USA) with 11,25.
  2. D (Uruguay, Costa Rica, England, Italy) with 14,25.
  3. C (Colombia, Greece, Côte d’Ivoire, Japan) with 20,25.

And excluding the points of the favorite team (pot 1) in each group, which is the favorite facing the toughest group?

  1. Germany in group G, facing 3,040.
  2. Uruguay in group D, facing 2,899.
  3. Spain in group B, facing 2,684.

Then, combining the 3 approaches, to me it becomes clear that the toughest group is G, with Germany, Portugal, Ghana and USA, by the total amount of points, ranking of the teams and in relation to what Germany will face.

Then, I would say that the second most difficult group is D, both looking at ranking and from the point of view of Uruguay. The third being group B (though between D and B, depends on the approach).

On the other hand, for the Netherlands, Chile and Australia (the worst team of the competition) it is clear that group B is the most difficult, as from their point of view their group has the most points excluding themselves (mainly thanks to the 1,507 of Spain).

Finally, after having done the analysis and seeing the heading of conversations on groups’ difficulty are taking I realize how few people have read about “Soccernomics” or “Moneyball“… just like with stock markets, at least this is just football.

7 Comments

Filed under Sports

Ask octopus Paul to invest for you

By now, everybody probably has heard about the octopus Paul picking winners of World Cup football matches. So far, it got right all the results of Germany. Today it picked Spain as winner of the final next Sunday. See the video of its memorable performance in CNN.

First thought: what a monumental charade this is! Second thought I had today at work: what if Paul was picking stocks for an investment fund?

The thought is not that out of the box: Burton G. Malkiel in his 1973 book, “A Random Walk Down Wall Street” (which I strongly recommend), suggested that a blindfolded monkey throwing darts to select stocks wouldn’t do worse than professional fund managers.

The Wall Street Journal went a step further and tried to prove the point. They did so organizing the 6-months Dartboard contest in 1988, a contest that continued along 14 years in more than a hundred 6-months periods. They didn’t use a monkey but the newspaper staff and they weren’t blindfolded. Nevertheless, the stock picks were quite random. See the explanation of that fun story in this article from Goergette Jansen a few months before the contest was to be finished in 2002.

So, how did the “monkey” do against the pros? Dartboard picks won the contest 39% of the times while pros won 61% of them. So, the pros got better results the majority of the time. Nevertheless, think that 39% of the times you would have been better off leaving your investments decisions to the darts, a monkey or octopus Paul (call it the way you want) than professional managers who get paid to maximize your returns… uh.

After those 14 years, pros racked up an average of 10.2% gain while the darts got a 3.5% gain (this is way better than my company-sponsored BBVA pension fund…).

So, next time you jokingly comment on Paul, think that you might as well ask him where to put your money and even get better results than when listening to the advice of the broker of your bank…

2 Comments

Filed under Books, Investing