Tag Archives: Aviation Safety Network

Aviation safety evolution (2019 update)

Yesterday, the Aviation Safety Network released the 2019 airliner accident statistics showing a total of 20 fatal airliner accidents, resulting in 283 fatalities.

Aviation Safety Network is a private initiative from the Flight Safety Foundation which curates an extensive database with aviation incidents, hijackings and accidents, from 1946 to nowadays.

The tweet with which they made the announcement is below:

Which includes the graphic below.

ASN_infographic_2019

If we take a quick look at the figures (which report commercial aviation flights (passenger and cargo)):

  • Number of accidents: 20, up from 15 in 2020, though still the 7th safest year in history (in number of accidents).
  • Fatalities: 283, down from 556 in 2018, the 3rd safest year in history (in number of fatalities).
  • There were 5 accidents with over 10 fatalities (details here).

The graphic above from the Aviation Safety Network provides the view of the evolution of accidents. However, in their database they provide some more figures with which I produced the graphics below.

Evolution of accidents per million flights

The database provides figures of the evolution of the number of world air departures since 1970, together with the evolution of accidents (above). The database includes a ratio: fatal accidents per million flights, which I have plotted below together with the evolution of flight departures. You can see that the ratio has decreased 12 fold since 1970, from 6.35 to 0.51 last year.

2019_safety_accidents_per_flights


Global air traffic vs fatalities

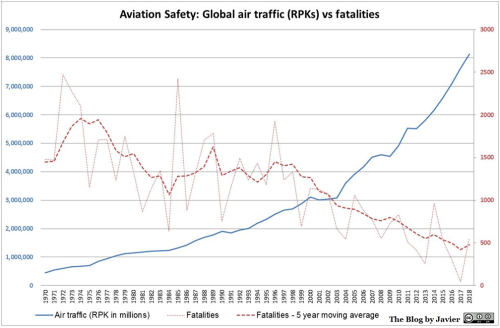
The database provides no ratio with the figures of fatalities, but they can be related to the amount of passengers carried. In aviation there is the concept of revenue passenger kilometre (RPK) transported, which is compiled year by year and can be found in publications from ICAOIATA or aircraft manufacturers. I have plotted below both the evolution of traffic growth and fatalities since 1970, together with a 5-year moving average for the fatalities.

2019_safety_RPK_vs_fatalities

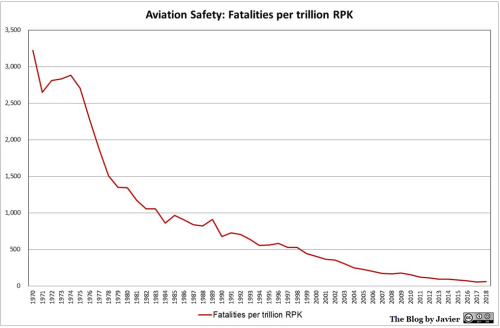
Within the evolution of traffic there are two variables that have grown over the years: the number of passengers carried per flight departure and the distance covered. Therefore, together with the decrease in the evolution of fatalities (taking the 5 year average) I have plotted below the evolution of the ratio of fatalities per trillion RPK. You can see that the ratio has decreased 81 fold since 1970, from 3,218 to 40 last year (5-year average).

2019_safety_fatalities_per_RPK

5 Comments

Filed under Aerospace & Defence

Aviation safety evolution (2018 update)

Yesterday, the Aviation Safety Network released the 2018 airliner accident statistics showing a total of 15 fatal airliner accidents, resulting in 556 fatalities.

Aviation Safety Network is a private initiative from the Flight Safety Foundation which curates an extensive database with aviation incidents, hijackings and accidents, from 1946 to nowadays.

The tweet with which they made the announcement is below:

Which includes the graphic below.

ASN_infographic_2018.

If we take a quick look at the figures (which report commercial aviation flights (passenger and cargo)):

  • Number of accidents: 15, up from 10 in 2017, though still the 3rd safest year in history.
  • Fatalities: 556, up from 44 in 2017, the 9th safest year in history.
  • There were a few accidents with large number of fatalities (details here).

The graphic above from the Aviation Safety Network provides the view of the evolution of accidents. However, in their database they provide some more figures with which I produced some graphics.

Evolution of accidents per million flights

The database provides figures of the evolution of the number of world air departures since 1970, together with the evolution of accidents (above). The database includes a ratio: fatal accidents per million flights, which I have plotted below together with the evolution of flight departures. You can see that the ratio has decreased 16 fold since 1970, from 6.35 to 0.39 last year.

2018_safety_accidents_per_flights

Global air traffic vs fatalities

The database provides no ratio with the figures of fatalities, but they can be related to the amount of passengers carried. In aviation there is the concept of revenue passenger kilometre (RPK) transported, which is compiled year by year and can be found in publications from ICAO, IATA or aircraft manufacturers. I have plotted below both the evolution of traffic growth and fatalities since 1970, together with a 5-year moving average for the fatalities.

2018_safety_RPK_vs_fatalities

Within the evolution of traffic there are two variables that have grown over the years: the number of passengers carried per flight departure and the distance covered. Therefore, together with the decrease in the evolution of fatalities (taking the 5 year average) I have plotted below the evolution of the ratio of fatalities per trillion RPK. You can see that the ratio has decreased 54 fold since 1970, from 3,218 to 59 last year (5-year average).

2018_safety_fatalities_per_RPK

Leave a comment

Filed under Aerospace & Defence

2017, the safest year in aviation history

In the last days, I have seen a wave of news and headlines mentioning that 2017 was the safest year in aviation history. The source of the information is the release of 2017 accidents figures made by the Aviation Safety Network a private initiative from the Flight Safety Foundation which curates an extensive database with aviation incidents, hijackings and accidents, from 1946 to nowadays.

The release of the figures can be found here: “ASN data show 2017 was safest year in aviation history“.

The tweet with which they made the announcement is below:

Following that publication, several specialized and generalist media echoed the information. Many of them went to say that there had not been any deaths in commercial aviation in 2017, which is not accurate. A few correctly reported the figures, e.g. Jon Ostrower from CNN. Some headlines reported that there had not been any death in “commercial passenger jet flights”, which is accurate, but misses the accidents and deaths of commercial aviation based on other aircraft than jets. Most of the headlines in the media that I have see in Spanish quickly copied the message but failed to note the word “jet”, and simply stated that there had not been any death in commercial aviation (the opposite would be private or military) or commercial passenger flights (this category would exclude cargo flights but not flights on turbo propellers for instance).

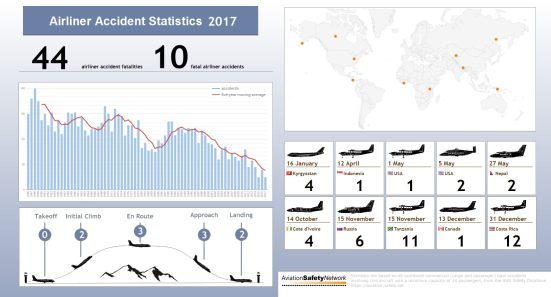
ASN_infographic_2017

If we take a look at the source of the information, we can have a quick look at the accidents:

  • there were 10 accidents in commercial aviation: 5 on passenger flights and 5 on cargo flights.
  • 44 occupants died as a consequence of those accidents. Moreover, 35 people died on ground as a consequence of those accidents.
  • there was 1 accident that involved what would be referred to as a “jet” aircraft, a Boeing 747, but this was on a cargo service. Involving four deaths.
  • there were several accidents involving commercial passenger aircraft, in this case turbo propellers, e.g. 4 Cessna 208 Caravan and Grand Caravan, or an ATR-42.

It is true that most of us rarely fly on those Cessnas, but about 2,500 have been built and they are operated by dozens of operators, including passenger commercial aviation (or FedEx, which flies over 200 of them), especially in regional aviation and inter-island flights.

ATR aircraft are also very successful in regional aviation, with over 400 ATR-42 built, and operated for example by the Air France subsidiary HOP! In this case, the ATR-42 that crashed, was operated by West Wind Aviation in Canada. After the crash investigation, Transport Canada removed the licence to the operator.

To conclude, yes, 2017 was the safest year in aviation history, but unfortunately there were 44 plus 35 fatal victims of commercial aviation.

Leave a comment

Filed under Aerospace & Defence