
Some weeks ago, in a discussion with a colleague we tried to put into context whether the A380 sales were such a dismal or not.
My colleague first plotted A380 orders since the program launch (2001) in comparison to those of the 747 (1966). I show below the result:
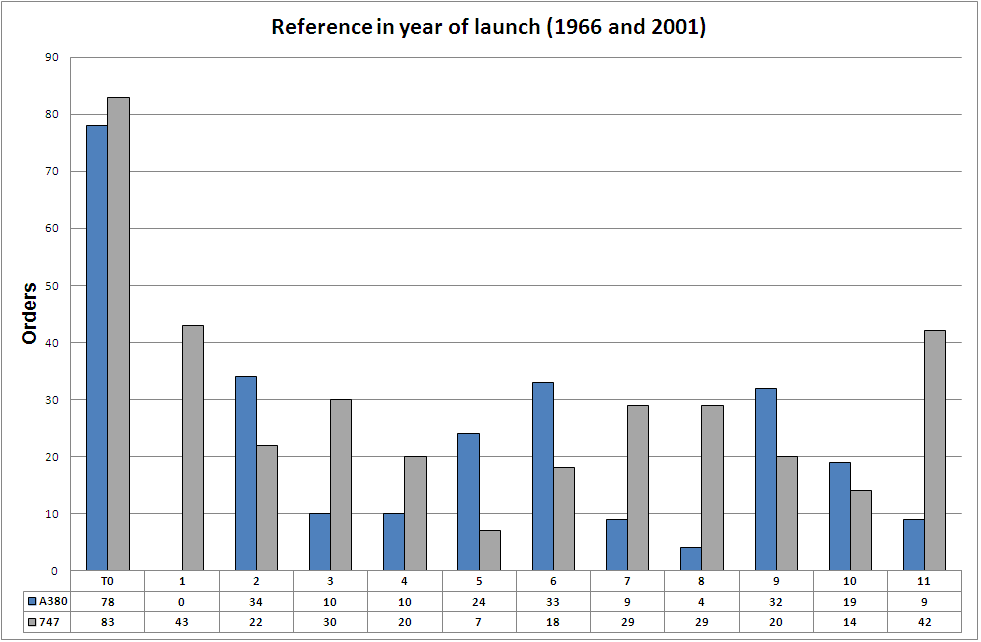
A380 and 747 orders referenced to the year of launch of each program.
Both programs show an initial sales rush at the time of program launch. In both cases the rhythm of sales slowed down after the second year. In the first 11 years of program, each had managed:
- A380: 262 orders.
- 747: 357 orders.
Thus, we can see that the Boeing 747 was selling better already from the beginning of the program.
However, I wanted to make yet another comparison: aircraft orders taking as reference the year of first delivery, having heard so often the industry mantra that some potential customers would want to wait to see the aircraft in operation before placing orders. See below this second comparison:
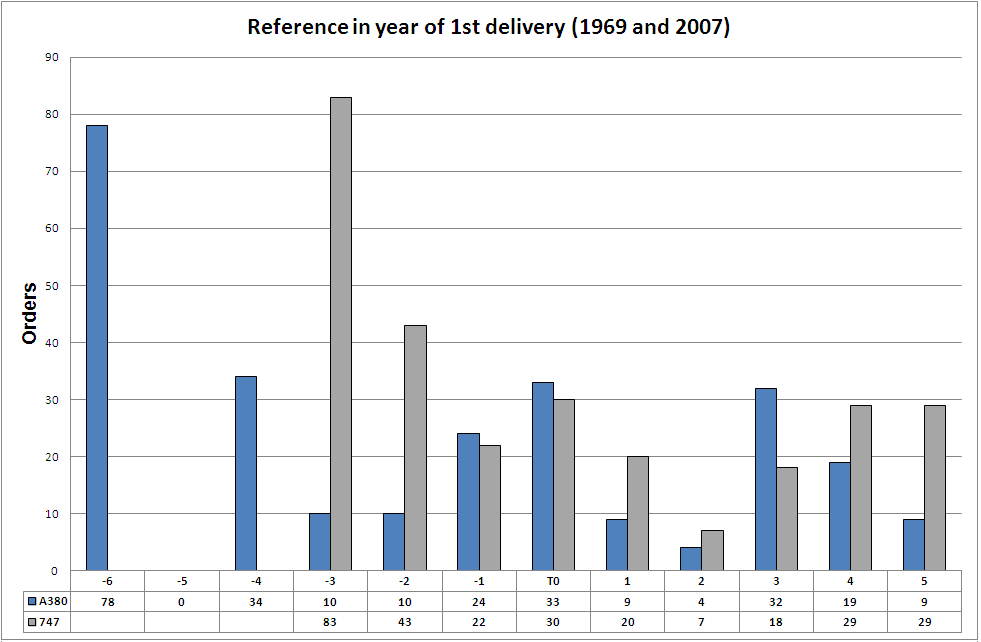
A380 and 747 orders referenced to the year the 1st aircraft delivery of each program.
In this case, and due to the shorter time to develop the Boeing 747 since program launch (1966), the difference in sales is narrowed:
- A380: 262 orders.
- 747: 281 orders.
You can see that still, 5 years after the 1st delivery of each aircraft (2007 for the A380 and 1969 for the 747) Boeing had sold more aircraft, but with this reference the margin is lower, 19 aircraft.
Boeing 747. The Boeing 747 was the first wide-body in commercial aircraft history and still is the twin-aisle with the highest amount of aircraft sold (1,528 a/c as of today, probably to be soon overtaken by the 777) and delivered (1,464 a/c as of today). However, it has taken over 40 years to reach those numbers. The 1,000th unit sold was reached after 25 years of sales in 1990. The 1,000th unit delivered was also reached after 25 years of aircraft deliveries, in 1993.
Thus, in my opinion, when we want to measure the success of the A380 we cannot be distracted by the figures of other commercial aviation segments (single-aisle and small / intermediate twin-aisle) but we have to check what the 20-year forecasts for the Very Large Aircraft say:
- ~1,300 aircraft according to Airbus GMF,
- ~600 aircraft according to Boeing CMO,
and then see what could be expected market share for the A380 against those forecasts and whether it is getting the orders to reach it or not.
—
You can find orders and deliveries figures in both manufacturers websites or summarized here: A380 and 747.


