
This is a quick post to share this infographic summarizing some data of the oil industry.
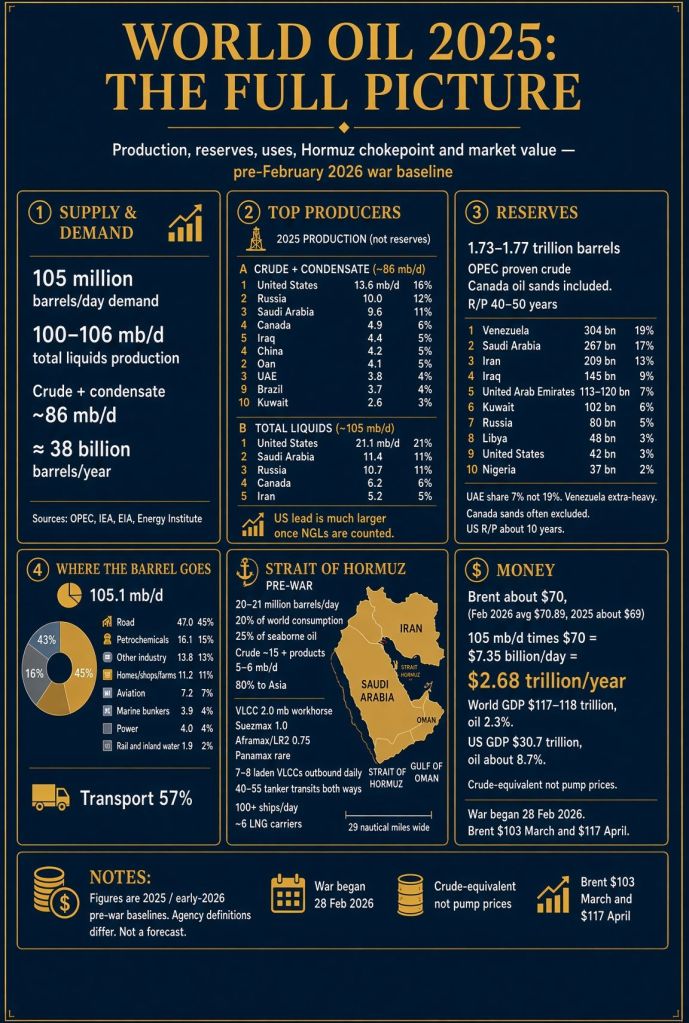
A bit of context. A few months ago I listened to a podcast on the Hormuz strait and the oil crisis by the Spanish journalist Fernando Díaz Villanueva in which he shared some figures of the industry that I found interesting. However, weeks later I could only remember some of those figures. I used Grok (Twitter/X artificial intelligence assistance) to refresh my memory through a series of questions and then asked Grok to prepare an infographic summarizing some data of the oil industry so I could have it as a reference for the future.
Global oil supply and demand in 2025 sat near 103–106 million barrels per day (mb/d), depending on definition. Agencies differ on whether they count only crude plus condensate, or a broader “total liquids” basket that includes natural gas liquids (NGLs), some other petroleum liquids, and sometimes biofuels and refinery processing gains. (source)
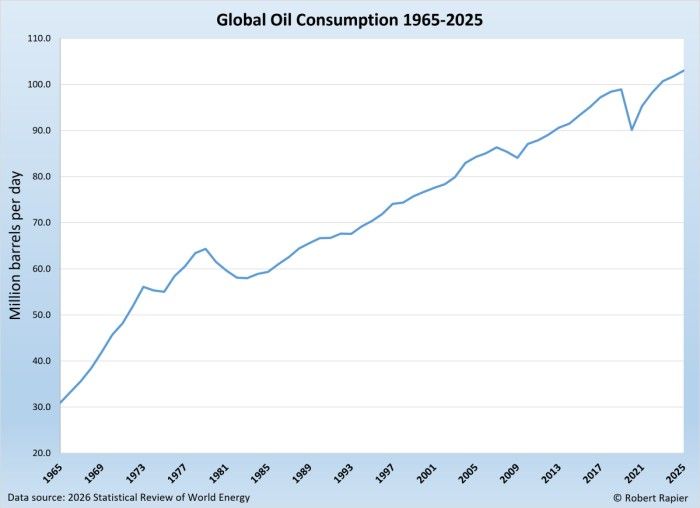
Top producers in 2025. Two common rankings are used. Crude + condensate is the narrow “oil well” measure. Total liquids adds NGLs (especially large in the U.S. shale system) and is closer to what many “oil production” headlines use.
- Crude oil + lease condensate (global total ≈ 85.8 mb/d).
- Total liquids (global total ≈ 100.4–100.6 mb/d in Energy Institute / Eni-style series; higher in IEA/EIA “petroleum and other liquids”).
The U.S. lead is much larger on total liquids because of NGL output from gas and shale. In that definition the U.S. produced nearly twice as much as Saudi Arabia.
Proven oil reserves are about 1.57–1.77 trillion barrels, depending on whether Canadian oil sands and some NGLs/condensate are counted. That is roughly 40–50 years of current production, or about 45–47 years of current consumption — but those “years left” numbers are only a simple reserve-to-production (R/P) ratio, not a forecast.
OPEC members hold about 1,243 billion barrels, or ~79% of OPEC’s world crude-reserve total. The Middle East alone is about 55–56% of that OPEC world total. (source)
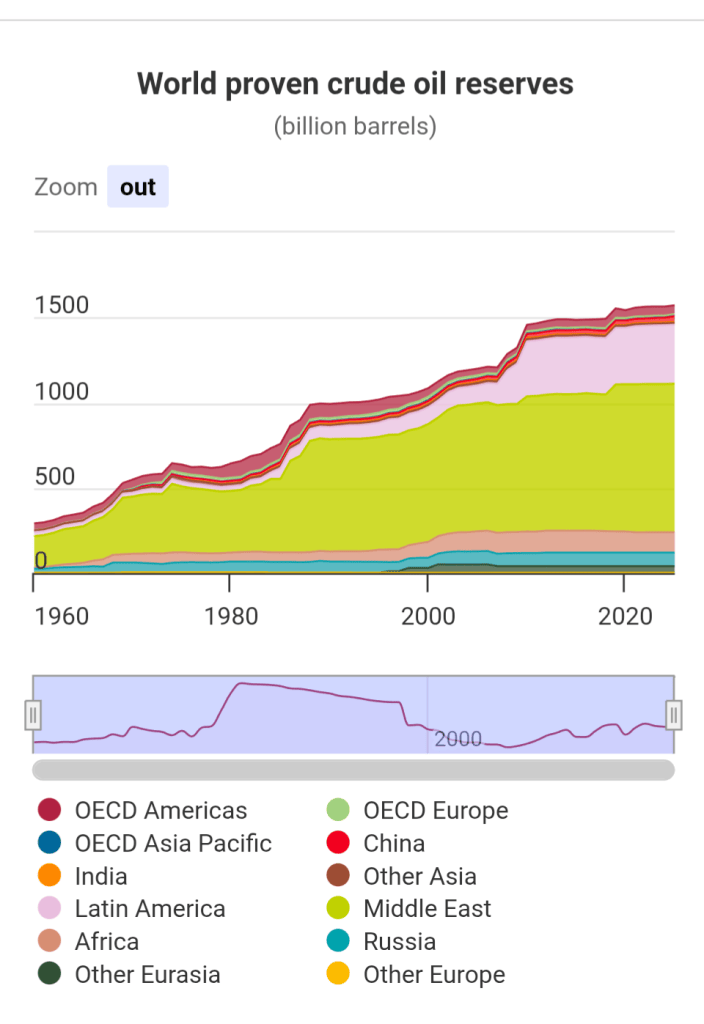
“Proven” means commercially recoverable under today’s prices and technology, not all oil in the ground.
Venezuela + Saudi Arabia + Iran already hold about half of OPEC’s booked world crude reserves. (source)
Looking at the consumption road transportation takes a clear lead with 45%, followed by the petro chemical industry, other industries, homes. Aviation consumes about 7% of the annual output. (source)
Before the February 2026 war, about 20–21 million barrels per day of oil moved through the Strait of Hormuz — roughly 20% of world oil consumption and about a quarter of all seaborne oil trade. (source)
How was that transported? Long-haul Gulf crude to Asia is a VLCC (Very Large Crude Carrier) trade. Suezmax and especially Panamax are secondary.
How many ships went through the strait per day?
Pre-war snapshots:
- S&P Global: ~135 vessels/day through the strait in February 2026, of which ~54 oil, chemical and LPG tankers and ~6 LNG carriers.
- Oxford Institute / Kpler: ~50 liquid-cargo crossings a day (both ways) just before 28 February 2026.
A simple cargo check matches the VLCC-heavy picture:
- 15 mb/d of crude ÷ ~2 mb per VLCC ≈ 7–8 laden VLCCs leaving the Gulf each day
- Roughly the same number coming back empty → ~15 VLCC transits/day
- 5–6 mb/d of products on Suezmax / Aframax / LR / MR ships (0.3–1.0 mb each) → on the order of 8–15 product-tanker sailings outbound, plus ballast returns
- Plus a handful of Suezmax crude cargoes that are not VLCC-sized
Daily and annual dollar value of the oil barrel. Using 105 million barrels/day of consumption (OPEC 2025) and a $70 pre-war Brent marker — close to February 2026 and a fair “eve of war” price, gives about $7.0–7.5 billion a day, ~$2.7 trillion per year or ~2.3% of world GDP (that is the value of the commodity flow, not oil’s share of value added).


