The Château de Montségur used to be a Cathar castle dating from late XII / early XIII century. For some time it was the centre of the Cathar church, though today only some ruins remain. The castle is at the top of a 1,200m-high rocky mountain, some kilometres away from the small village of Lavelanet out of which the Trail des Citadelles started.
This was my first long run and first race just 2 weeks after completing Rome marathon. I had only run 2 days between then and today, thus I took it more as a run in the nature than as a race, no stress from the departure. I even took the photo camera as I suspected I could take some nice pics.
The race consisted of 20km from Lavelanet to the castle and back, going as much as possible through the forest and as little as possible through paved roads (basically the first and last kilometres and little else). The rain of the previous days, of that precise morning and the passing of hundreds of runners left many of the paths impracticable, completely muddy and enabling the funniest situations.
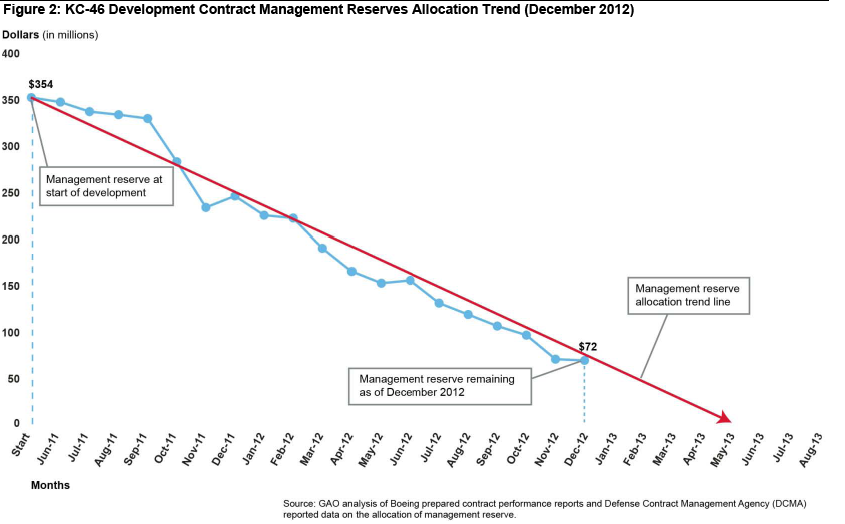
Trail des Citadelles (20km) profile.
Before having completed the 2nd kilometre my running shoes and socks were already completely soaked. Before the 3rd kilometre we had been running through some stretches in which the feet were covered up to the ankles with mud (chop, chop, splash!).
I love trails for they put you in close contact with nature, the variety of their landscapes, the absence of time pressure; even if I acknowledge that I am not particularly good with difficult descents which require some technique and equipment that I lack of.
Today I missed some mountain sticks. At the starting line I saw many people with them. I wasn’t sure if it was because they would walk instead of run. Indeed. The thing is that I would also have to walk a lot, uphill, through rocks covered with very slippery mud. Only during the race I understood why they brought them. Between the 4th and 5th kilometre we started to walk uphill more than run, and it lasted like that for almost the next 7 kilometres.
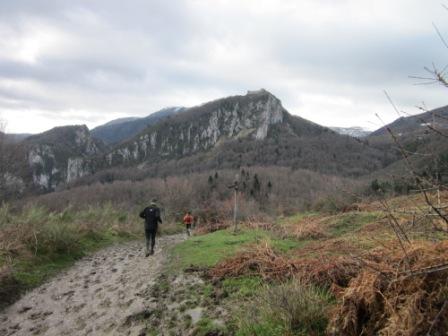
Montségur castle from afar at the top of the mountain (notice the footprints in the mud). Picture taken at about km. 5
The mostly walking uphill took a full hour to cover about 5 kilometres to the bottom of the castle stairs.
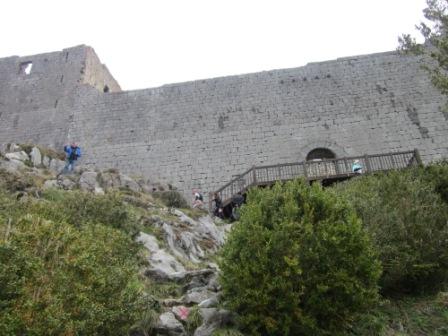
Montségur castle from below.
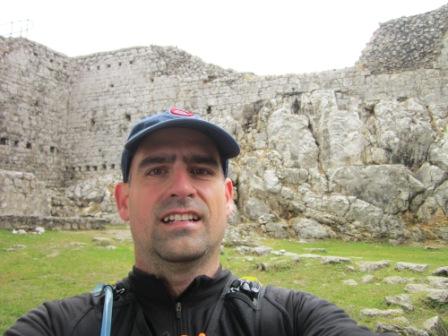
Inside the castle.
The views from the castle are stunning. The picture below does not make enough justice so I took a panoramic video.
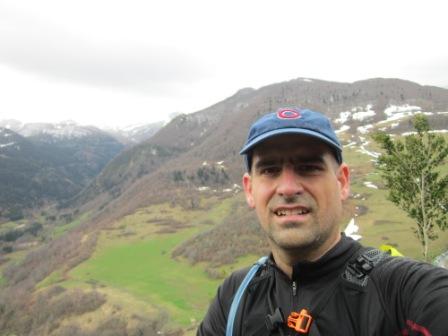
Views from the castle.
From the castle to the end of the race most of the time we would be descending. In theory, this should have made it easier. But that was only the theory. That is when the fun began (to call it that way).
The way down started with the same stairs of the castle, which we descended with much care. Then some hundreds of metres of going up and down over more or less dry surface and finally the same kind of very steep descent, sometimes along and others crossed by water flows, fully covered with slippery mud.
I lost count of how many times I slid without any control on the verge of falling down. I do keep count of the 5 times that these detours ended with me, my face, arms, whatever it was… in the mud. They were not especially painful, but left you with hands and face covered of mud, having to wash yourself in the next current of brownish water. Other times the sliding left you looking uphill to the wrong side of the race hands in the ground to prevent a full-blown fall. As I was not the only one going through this, you can get an idea of the image…
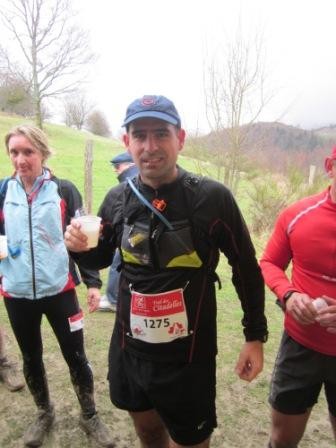
Eating at ~ km. 12.
Around the kilometre 11-12 there was the only point of supply so I did a little stop to drink some Coke, eat some chocolate, etc.
After this stop, the mix of sliding / running continued for about another kilometre until we entered a forest of pine trees where the ground was a bit drier. There I was happy as I started running faster, less worried about falling and more focused on keeping the pace… until I bent my ankle… the same ankle I strained 3 times during winter. That one was painful. I had to stop and walk for some 2-3 minutes to recover from it.
It was then that I took the camera to film another short video as an update of the race so far at 13.4 km (in Spanish):
The making of the video, the self-deprecating humour of the situation lifted my morale. I tried the ankle, which responded positively, so I started running again.
During the last 5 kilometres, more or less flat, even if still going at times through water flows or mud, I tried to enjoy running a little. I think it was only at this point that I was overtaking others instead of being overtaken :-). I discovered then that instead of avoiding water flows and poodles, it was indeed better going through them as their bottom used to be firmer. The guys of the organization took it seriously and somehow made us literally run along the river for about 200m! That was another high moment of the trail, which I recorded here (excuse my French):
When arriving at the village, one final sprint and done. I mean, done.
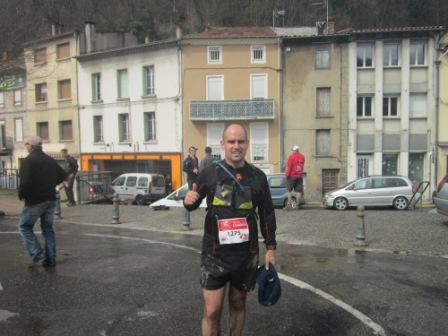
Finish line.
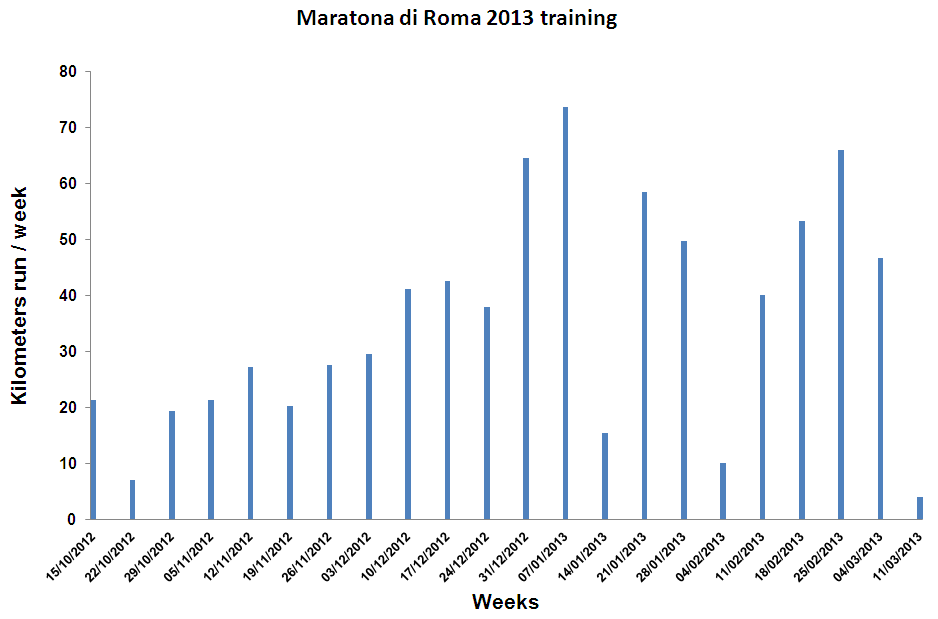
My performance: 2h49’16”, 201 out of 366 finishing within the time given of 3h30′ (see Garmin records).
—
PD: All this happened in the 20 km race; bear in mind that at the same time 2 other races were taking place one of 40 km and one of 73 km (the runners having departed at 6am to run… 9 hours? 12?). My admiration to all those heroes.