Tag Archives: Boeing Commercial Airplanes

My forecast of Boeing Commercial Airplanes 2017 revenues

Next January 31st, Boeing will hold an earnings conference where it will announce its Q4 and full 2017 year financial results, including the revenues of each of its units.

Three weeks ago, on January 9th, Boeing already issued a press release where it announced its deliveries and orders for 2017, mainly:

  • 763 commercial aircraft delivered (including 529 of the 737 family, or 136 787).
  • 912 net orders (after cancellations) (including 745 of the 737 family).

The release mentions “912 net orders, valued at $134.8 billion at list prices“, however those list prices are discounted, nothing new, and with an estimate of that discount I’ll try to guess the figure of revenues for the Boeing Commercial Airplanes division, not so much trying to be accurate in itself, but to point in advance to the increasing of the discounts as we will see below.

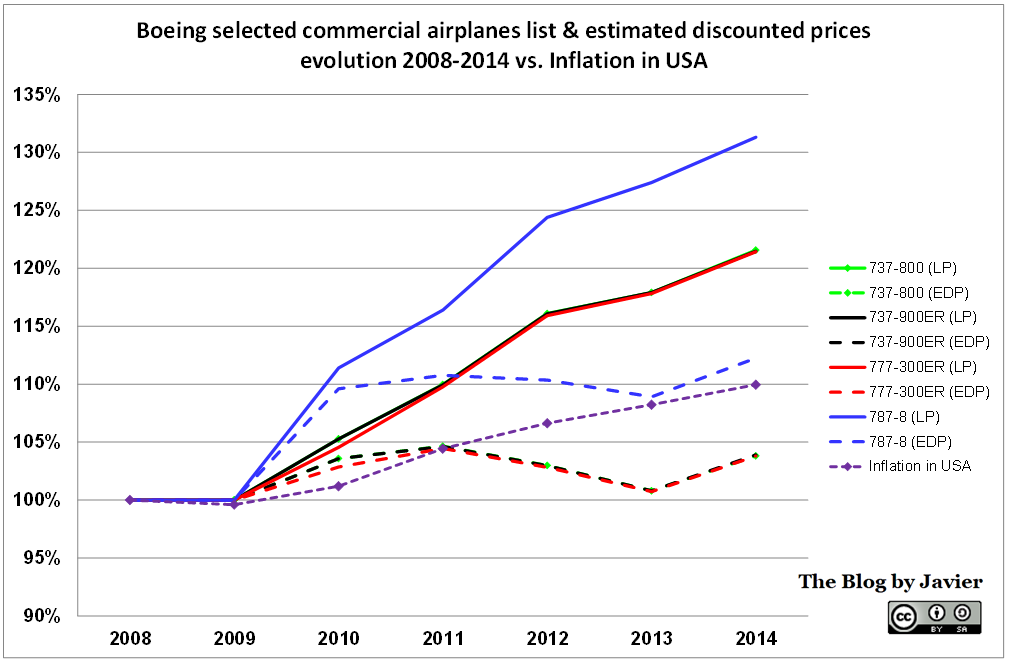
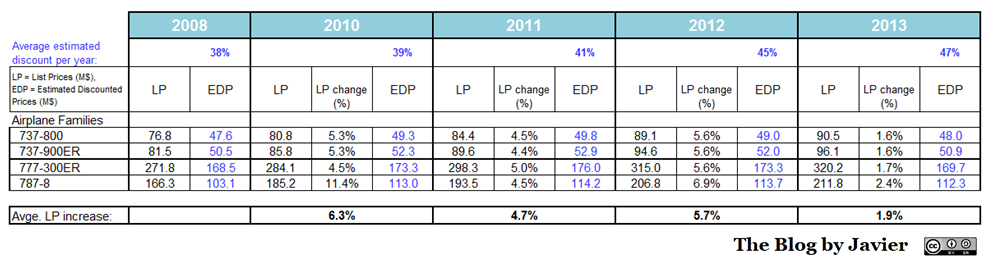
Where can we find Boeing list prices? Boeing host them in their site, these have just bee raised 10 days ago about 4% (see this comment about it). The previous prices dated from March 2017, when Boeing raised them again, that time by about 2% from its 2015 prices (untouched in 2016). To compute 2017 revenues and estimate of discount I use 2017 prices, not the latest ones.

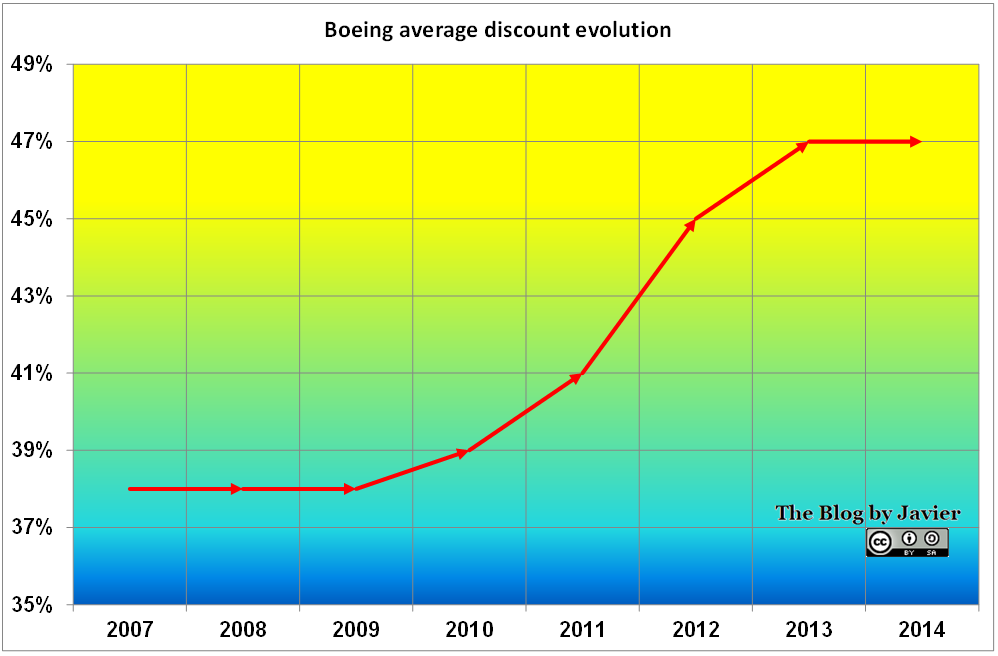
If Boeing didn’t apply those discounts, the value of the 763 aircraft delivered in 2017 would yield revenues of above 118 bn$. To come to a ballpark figure, I will take the latest figure of discounts that I had calculated with 2016 and earlier figures, being the latest ~46%.

Discount evolution_2016

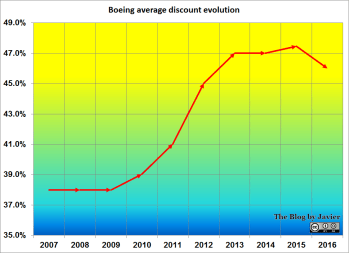
If I plug that discount into the 2017 list prices of the fleet mix of the 763 commercial aircraft that Boeing delivered we would come to a figure of revenues of 62.1 bn$. However, see below what was Boeing’s own guidance in their Q3 earnings release:

2017 Q3 Financial Outlook

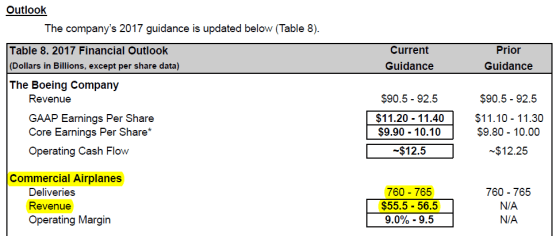
Boeing’s 2017 Financial Outlook at Q3 2017 earnings press release.

At three months to the year end (Q3), they forecast between 760 and 765 deliveries, which turned in 763. At the same time they pointed to revenues between 55.5 – 56.5 bn$… and not above 62 bn$. I believe they will exceed their own estimate, but not by 5 bn$, that is why I see that their discounts have been greatly increased in the last 2017. They must have had a bad time in escalating prices of aircraft sold years ago, delivered in 2017 but with escalation conditions much lower than ongoing list prices.

With all these ingredients… my forecast is: 57.0 bn$.

Some comments to it:

  • My forecast is a bit more optimistic than their upper bracket (56.5) which may be slightly conservative.
  • The implied discount of my revenues forecast would be in the ~ 50% range.

(1) See here a couple of such forecasting revenues exercises that I did for Boeing’s 2014 and 2015 revenues.

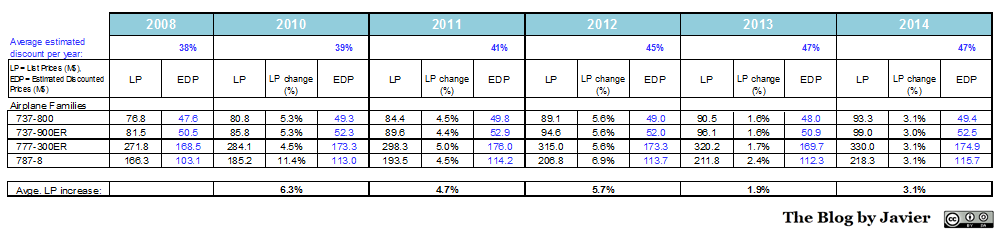
(2) See here the latest detailed calculation of discounts that I posted in 2015.


2 Comments

Filed under Aerospace & Defence

Wide-body mix in 17 years of Boeing CMOs

Two years ago, I wrote a post showing the puzzling change in Boeing’s predicted mix of twin-aisle sales, between small and medium wide-bodies (“Wide-body mix in 15 years of Boeing CMOs”) (1). A few days ago I wrote a post about the publishing by Boeing of its Current Market Outlook for 2015-2034.  As I noted in that post, this year’s CMO is consistent with last year’s figures, i.e., the larger share of the forecasted market corresponds to small wide-bodies (787s from Boeing’s perspective). Recall the numbers:

  • small wide-bodies: 4,500 a/c in CMO2015 (passenger aircraft only),
  • medium wide-bodies: 2,990 a/c in CMO2015 (same figure as in CMO2014).

In the sub-segment of the medium wide-bodies passenger aircraft figures for  have remained constant and there is a slight increase in freighters (60 a/c); whereas for small wide-bodies the main increase is seen in the passenger aircraft (+230 a/c).

Since I keep a collection of CMOs from many years, I will include again a comparison going 17 years back…

Twin-aisle mix distribution (Boeing CMO 1998-2015, includes both passenger and freighter aircraft).

Twin-aisle mix distribution (Boeing CMO 1998-2015, includes both passenger and freighter aircraft).

Seeing at the graphic, made using Boeing’s forecasts’ figures:

  • During the first 5 years (1998-2003) the trends are quite constant, seeing medium wide-bodies a slightly higher demand.
  • From 2003 to 2007, the mix is reverted, possibly to favour the launch of the 787.
  • In 2008 the CMO did not provide the split.
  • From 2009 to 2013, you can see that both trends in the forecasts are erratic… why? Only Boeing knows. (2)
  • From 2013 to 2015, it seems that the trends are stabilized again in a higher demand for 787-size aircraft.

(1) Last year, I made an update of that post with the consolidated view of the last 16 years, find it here.

(2) A speculation: a Boeing-internal need to sell the concept of the 777X?

Leave a comment

Filed under Aerospace & Defence

Boeing list prices increases vs. discounts increases (update for 2014)

In a previous post I updated the estimate of what is the average discount Boeing applies when selling its commercial airplanes using 2014 data of list prices, deliveries and reported revenues. The figure I came up with was a 47% discount. I included the following graphic showing the discount evolution:

Boeing Average Discount Evolution, through 2014.

Boeing Average Discount Evolution, through 2014.

Last year, seeing the increasing trend of average discount together with knowing the fact that Boeing regularly increases list prices triggered the following question: Have Boeing airplane discounted prices increased, decreased or stayed constant in the recent years? I set out to answer this question using the estimated average discount of each year (1) from the graphic above.

The Boeing list prices (LP) (2) can be found here. I have been recording those prices for years and thus have a table with the evolution of list prices for each model year by year. The following step is to apply the average discount estimated for each year to then-year list prices, to get the estimated discounted prices (EDP) (2) per model. Thus, a table can be built for the last 6 years.

You can find below the result for the best-selling aircraft during previous years: 737-800, 737-900ER, 777-300ER and 787-8. Together these 4 models amounted to over 640 deliveries in 2014 or 89% of the total 723 airplanes Boeing delivered in 2014.

Boeing List and discount Prices evolution table, 2008-2014.

Boeing List and discount Prices evolution table, 2008-2014.

In the table above I included in black figures what have been Boeing list prices of these models in the past years (as reported in their website) while I marked in blue the figures which are estimated, using as a departure point the calculated averages discounts per year (also included in blue in the table). I included as well the list prices year-on-year change as a % of the previous year list prices, per model.

The average list price increase included at the bottom line is computed with the information of all Boeing models (19 in 2008 and 20 in 2014, though different ones (e.g. last year addition of 777-8X and 777-9X), a total of 26 different models along this period), not only the 4 included in this table.

You may see in the table above that after not increasing prices in 2009, Boeing has steadily increased them in 2010 (6.3%), 2011 (4.7%), 2012 (6.7%), 2013 (1.9%) and 2014 (3.1%). However, if you take a look at the blue figures in the same table you will notice that prices of 2014 are between 2010 and 2011 price levels for all 4 models! That is, the widely announced yearly list prices increase has been yearly offset by a discreet (not-announced) increase in the discounts applied to the sales of airplanes. Thus, the pricing power of Boeing has remained barely constant during the last 5 years. You may see it better in the graphic below:

Boeing List & discount Prices evolution graphic vs. inflation in USA (through 2014).

Boeing List & discount Prices evolution graphic vs. inflation in USA (through 2014).

The graphic shows the price evolution for each of the 4 airplane models selected, taking as a reference their list and estimated discounted prices in 2008 (indicated as 100%) and also the evolution of inflation in the USA (3) in purple, to reflect the evolution of real prices (i.e. accounting for inflation). List prices are shown with straight lines, versus dashed lines used for estimated prices. Each pair of prices for each aircraft is presented in the same color for easier identification. Some comments to the graphic:

  • Through continuous increases, 2014 list prices were between 21% (737 and 777) and 31% (for the 787) higher than in 2008.
  • However, due to increasing discounts from 38% in 2008 to 47% in 2014, the increase in list prices is almost entirely offset (especially for 737 and 777, just 4% above 2008 levels).
  • 2014 discounted prices are below 2011 discounted prices for all models except 787.
  • If compare the evolution of prices vs. the US inflation (general prices in 2014 being 10% higher than in 2008), we see that:
    • Boeing actually lost pricing power in both the 737 and 777, which are cheaper in real (inflation-adjusted) discounted terms in 2014 than they were in 2008 (about 6% cheaper).
    • Only the 787 has been able to keep up the pace of discount escalation and inflation.

(1) There is no way to know the real price and discount that Boeing applies in each sale, as it will depend from customer to customer (American Airlines -AMR- or Fedex) and from model to model (737-800 or 787-8). There where competition is tougher, discounts will be higher. However, the estimates I have made are an average of all Boeing aircraft sold in a given year.

(2) Both list prices (LP) and estimated discounted prices (EDP) are expressed in then-year dollars.

(3) US inflation series since 2008: -0.4% (2009), 1.6% (2010), 3.2% (2011), 2.1% (2012), 1.5% (2013) and 1.6% (2014).

1 Comment

Filed under Aerospace & Defence

Wide-body mix in 16 years of Boeing CMOs

Last year I wrote a post showing the puzzling change in Boeing’s predicted mix of twin-aisle sales, between small and medium wide-bodies (“Wide-body mix in 15 years of Boeing CMOs”). A few days ago I wrote a post about the publishing by Boeing of its Current Market Outlook for 2014-2033. This year’s CMO is more consistent with last years figures, i.e., the larger share of the forecasted market corresponds to small wide-bodies (787s from Boeing perspective). Recall the numbers:

  • small wide-bodies: 4,270 a/c in CMO2014 (passenger aircraft only),
  • medium wide-bodies: 2,990 a/c in CMO2014.

However, the trend is changed again in this year’s CMO in comparison with last year’s one: small wide-bodies market decreases while the medium wide-bodies’ one increases again. Since I keep a collection of CMOs from years back, I will include again a comparison going 16 years back…

Twin-aisle mix distribution (Boeing CMO 1998-2014).

Twin-aisle mix distribution (Boeing CMO 1998-2014).

Seeing at the graphic (made using Boeing figures):

  • During the first 5 years (1998-2003) the trends are quite constant.,
  • From 2003 to 2007, the mix is reverted, possibly to favour the launch of the 787.
  • In 2008 the CMO did not provide the split.
  • From 2009 to 2014, you can see that both trends in the forecasts are erratic… why? Only Boeing knows.

4 Comments

Filed under Aerospace & Defence

Boeing list prices increases vs. discounts increases…

In a previous post I updated the estimate of what is the average discount Boeing applies when selling its commercial airplanes using 2013 data of list prices, deliveries and reported revenues. The figure I came up with was a 47% discount. I included the following graphic showing the discount evolution:

Boeing Average Discount Evolution, 2013.

Boeing Average Discount Evolution, 2013.

Seeing the increasing trend of average discount together with knowing the fact that Boeing regularly increases list prices triggered the following question: Have Boeing airplane real prices increased, decreased or stayed constant in the recent years? I set out to answer this question using the estimated average discount of each year (1) from the graphic above.

The Boeing list prices (LP) can be found here. I have been recording those prices for years and thus have a table with the evolution of list prices for each model year by year. The following step is to apply the average discount estimated for each year to then-year list prices, to get the estimated discounted prices (EDP) per model. Thus, a table can be built for the last 5 years.

You can find below the result for the best-selling aircraft during previous years: 737-800, 737-900ER, 777-300ER and 787-8. Together these 4 models amounted 560 deliveries in 2013 or over 86% of the total 648 airplanes Boeing delivered in 2013.

Boeing List and discount Prices evolution table, 2008-2013.

Boeing List and discount Prices evolution table, 2008-2013.

In the table above I included in black figures what have been Boeing list prices of these models in the past years (as reported in their website) while I marked in blue the figures which are estimated, using as a departure point the calculated averages discounts per year (also included in blue in the table). I included as well the list prices year-on-year change as a % of the previous year list prices, per model.

The average list price increase included at the bottom line is computed with the information of all Boeing models (19 in 2008 and 18 in 2013, though different ones, a total of 24 different models along this period), not only the 4 included in this table.

You may see in the table above that after not increasing prices in 2009, Boeing has steadily increased them in 2010 (6.3%), 2011 (4.7%), 2012 (6.7%) and 2013 (1.9%). However, if you take a look at the blue figures in the same table you will notice that prices of 2013 are between 2008 and 2010 price levels for all 4 models! That is, the widely announced yearly list prices increase has been yearly offset by a discreet (not-announced) increase in the discounts applied to sales of airplanes. Thus, the pricing power of Boeing has remained barely constant during the last 5 years. You may see it better in the graphic below:

Boeing List and discount Prices evolution graphic, 2008-2013.

Boeing List and discount Prices evolution graphic, 2008-2013.

The graphic shows the price evolution for each of the 4 airplane models selected, taking as a reference their list and estimated discounted prices in 2008 (indicated as 100%) . List prices are shown with straight lines, versus dashed lines used for estimated prices. Each pair of prices for each aircraft is presented in the same color for easier identification. Some comments to the graphic:

  • Through continuous increases, 2013 list prices were between 18% (737 and 777) and 27% (for the 787) higher than in 2008.
  • However, due to increasing discounts from 38% in 2008 to 47% in 2013, the increase in list prices is almost entirely offset.
  • 2013 discounted prices are below 2010 discounted prices for all models.
  • 2013 discounted prices are almost back at 2008 levels for the 737 and 777, only the 787 seems to have stayed at 2010 levels.

(1) There is no way to know the real price and discount that Boeing applies in each sale, as it will depend from customer to customer (American Airlines -AMR- or Fedex) and from model to model (737-800 or 787-8). There where competition is tougher, discounts will be higher. However, the estimates I have made are an average of all Boeing aircraft sold in a given year.

3 Comments

Filed under Aerospace & Defence

Wide-body mix in 15 years of Boeing CMOs

A couple of days ago I wrote about the publishing by Boeing of its Current Market Outlook for 2013-2032. In that post I made a very brief review of it, and mentioned that I was puzzled by the change in the predicted mix of twin-aisle sales, between small and medium wide-bodies. To recall the numbers:

  • small wide-bodies: from 2,720 a/c in CMO2012 to 4,320 a/c in CMO2013, whereas,
  • medium wide-bodies: from 4,490 a/c in CMO2012 to 2,810 a/c in CMO2013.

Since I keep a collection of CMOs from years back, I decided to compare the figures of this wide-bodies mix along the last 15 years…

Twin-aisle mix distribution (Boeing CMO 1998-2013).

Twin-aisle mix distribution (Boeing CMO 1998-2013).

Seeing at the graphic (made using Boeing figures):

  • During the first 5 years (1998-2003) the trends are quite constant.,
  • From 2003 to 2007, the mix is reverted, possibly to favour the launch of the 787.
  • In 2008 the CMO did not provide the split.
  • From 2009 to 2013, you can see that both trends in the forecasts are erratic… why? Only Boeing knows.

9 Comments

Filed under Aerospace & Defence

Ray Conner on pricing and Boeing discounts

Reading in Leeham News and Comment aerospace blog about the appearance of Ray Conner, CEO of Boeing Commercial Airplanes, at JP Morgan aerospace conference I picked the following lines:

Joe Nadol (JN) of JP Morgan: Is there pricing pressure?

Ray Conner (RC): I think margin will be OK [for 737NG]. Some initial launch deals for MAX can be a little more aggressive, but we’re seeing that become more stable.

JN: MAX–I thought pressure would be more on late NGs than on the MAX.

RC: We were a little late getting into the marketplace with MAX and there was pricing pressure on NGs. We were about a year late so we were more aggressive than we would have been had we not been late.

For the last years I have been trying to estimate averages for the discounts Boeing applies to its commercial aircraft using as departing information Boeing year-end financial results, list prices, net orders, deliveries and services revenues. You can see the results for 2012, 2011, 2010 and 2009. In each of the posts you can see a detailed explanation of the methodology I followed.

Why do I comment this? Since 2009 I have noticed that the average discount has gone from ~38% (2009), 39% (2010), 41% (2011) to 45% (2012)!!

Find below the explanation I could find for that hike in the discount:

The explanation I can find for that increase shall be linked the built-in penalties for 787 (net orders for 2012 being -12 a/c) and 747 delays (1 single net order) into revenues plus the launch of a new aircraft, 737 MAX (forced by A320neo sales success in 2011).

How does it compare to Conner’s words?

6 Comments

Filed under Aerospace & Defence