Monthly Archives: July 2017

Airbus vs. Boeing, comparison of market forecasts (2017)

Two weeks ago, during Le Bourget air show in Paris, both Airbus and Boeing released their market forecasts for the following 20 years: Airbus’ Global Market Forecast (GMF, PDF 3.6 MB) and Boeing’s Current Market Outlook [PDF, 3.8 MB].

In previous years, I have published comparisons (1) of both Airbus’ and Boeing’s forecasts. You can find below the update of such comparison with the latest released figures from both companies.

Forecast2017

Comparison of Airbus GMF and Boeing CMO 2017-2036.

Some comments about the comparison:

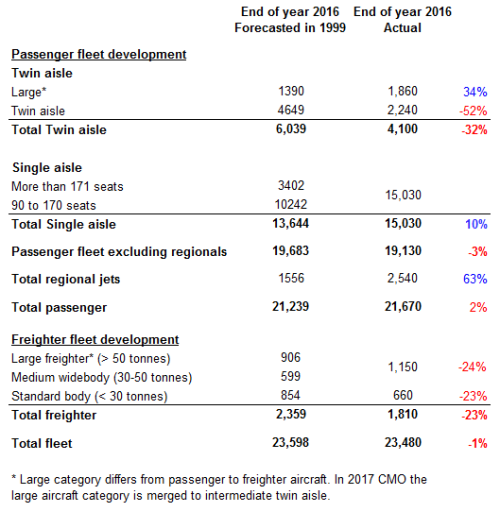
  • The main comment for this year CMO is that after years of Boeing dowplaying the demand for the segment of the large aircraft (seen as mainly 747, A380 and some other high capacity aircraft, depending on the manufacturer), it has finally stopped to consider them a category by themselves and has merged that category with the “intermediate twin-aisle” (i.e. 777, A350…).
  • Excluding the large aircraft, both companies’ forecast for the twin aisle segment is nearly identical: ~8,175-8,210 aircraft (we may assume that about 100 of those 8,210 from Boeing’s CMO correspond to large aircraft, thus comparing apple to apples would be ~8,175-8,100). The mix between small and intermediate twins varies, ~400 units up and down.
  • On the other hand, Boeing forecasts about 4,700 single-aisle more than Airbus (the gap has widened in 100 units this year). Boeing doesn’t provide the split between more or less than 175 pax capacity airplanes since its 2015 CMO, nor does Airbus since 2016.
  • Alltogether, Boeing sees demand for 10% more passenger aircraft (excluding regional a/c and freighters) with a 9% more value. The gap is slightly lower than in 2016.
  • In relation to last year’s studies, Airbus has increased demand by ~1,700 aircraft (and ~ 190 Bn$) whereas Boeing has increased it by 1,400 (and ~ 130 Bn$).
  • In relation to traffic, measured in terms of RPKs (“revenue passenger kilometer”), that is, the number of paying passenger by the distance they are transported, they see a similar future: Airbus forecasts for 2036 16.5 RPKs (in trillion, 4.4% annual growth from today) while Boeing forecasts 17.8 RPKs (4.7% annual growth).

Some lines to retain from this type of forecasts:

  • Passenger world traffic (RPK) will continue to grow about 4.5% per year. This is, doubling every ~15 years.
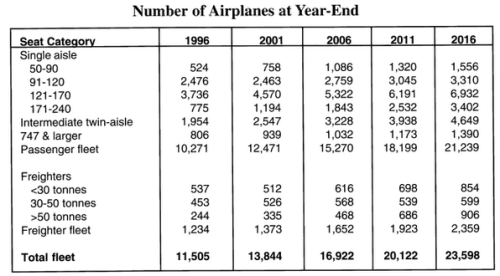
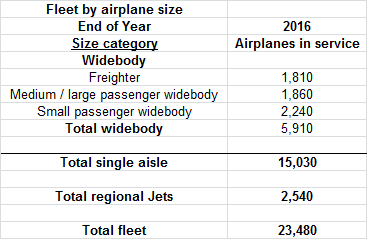
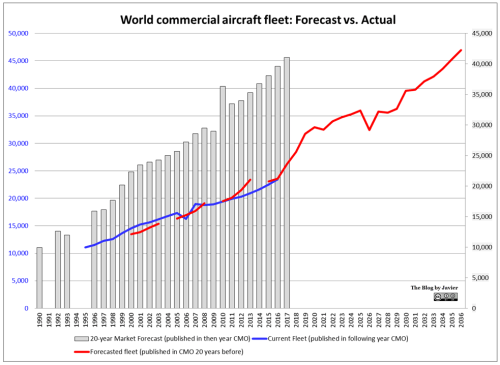
  • Today there are about 18,890 passenger aircraft around the world (according to Airbus; 19,130 in Boeing’s CMO), this number is about 800 a/c more than the year before (5% increase) and will more than double over the next 20 years to 40,120 a/c in 2036 (41,320 as seen by Boeing, excluding regional jets).
  • Most deliveries will go to Asia-Pacific, 42% or ~17,000 passenger aircraft (according to Airbus).
  • Domestic travel in China will be the largest traffic flow in 2036 with over 2,000 bn RPK (according to Boeing, an annual growth of 6.1%), or 11.6% of the World’s traffic.
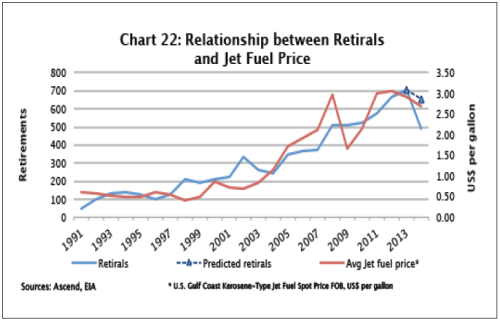
  • Nearly 13,000 aircraft will be retired to be replaced by more eco-efficient types.
Middle_Class

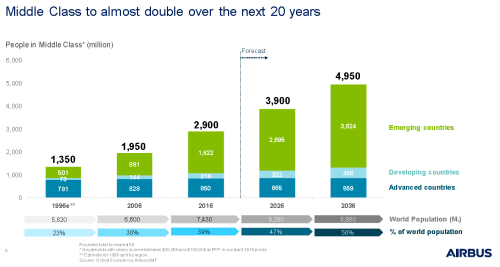
The doubling of the world’s middle class over the next 20 years will fuel air traffic growth and new airplanes demand.

As I do every year, I strongly recommend both documents (GMF and CMO) which provide a wealth of information of market dynamics.


(1) Find here the posts with similar comparisons I made with the forecasts of previous years: 201020112012, 2013, 2014, 20152016.

2 Comments

Filed under Aerospace & Defence

Boeing vs. Airbus: CEO compensation (2016)

For the last 3 years I have been writting a small series of posts comparing the compensation of Airbus and Boeing CEOs (1). This series started out of conversation with colleagues and I keep it to have a record of the evolution and for quick reference in other conversations (2). Thus, this post is just the update with the information for the 2016 fiscal year.

As both Boeing and Airbus are public companies, the information about their CEOs compensation is public and can be found in the annual report and proxy statement from each one. I just share the information and sources below for comparison and future reference.

Airbus CEO, Tom Enders’ 2016 compensation (financial statements here, PDF, 1.0 MB, page 59):

Enders_2016

Airbus CEO Tom Enders 2016 compensation.

Enders saw its base salary increased in 100 k€ after 3 years at 1.4 M€. Variable pay also increased substancially, but share-based remmuneration decreased in a bigger amount. The overall compensation (6.25 M€) decreased, as it has been the case for the last 3 years.

Boeing CEO, Dennis Muilenburg’s 2016 compensation (proxy statement here, PDF, 4.2 MB, page 30):

Muilenburg_2016

Boeing’s CEO Dennis Muilenburg 2016 compensation.

Dennis Muilenburg saw its base salary increased in 50 k$, after a decrease of 330 k$ last year in the transition between McNerney and him. Incentive percentages were kept constant, has been the case in the last 4 years. The total compensation (15.18 M$) increased in relation to 2015 but it is still bellow the 2014 levels (17.8 M$).

Comparison. It is interesting to note that while the base salary is nearly the same, 1.5 m€ vs 1.65 m$ (more so taking into account average exchange rates in 2016 (~ 0.90 EUR/USD)), the incentive schemes at Boeing end up with a total remuneration for the CEO about the double (x2.2) of that in Airbus.


(1) See the previous comparisons for the years 2013, 2014 and 2015.

(2) From what I see in the stats of the visits to this blog, other people are having similar conversations as these posts with the compensation comparison have ranked among the top 10 most read ones the last years.

1 Comment

Filed under Aerospace & Defence

Aircraft market forecasts accuracy (update 2017)

About three years ago I wrote a post in which I analyzed the accuracy of commercial aircraft market forecasts. In particular, Boeing’s series of yearly Current Market Outlook (CMO). In that comparison, between the CMOs from 1999 and 2014, we could compare the predicted and the actual world fleets at 2013 year-end.

In this post, I just wanted to provide an update with the figures from the latest CMO (2017), released a couple of weeks ago, in comparison with 1997’s CMO. In that CMO from 1997, we find the following chart showing Boeing’s forecasted fleet size and distribution for 2001, 2006, 2011 and 2016 year-ends.

Fleet at year end - forecast 1997

1997 Boeing CMO year-end fleet forecasts for 2001, 2006, 2011 & 2016.

In 2017’s CMO, Boeing offered figures of 2016 year-end fleet.

Fleet at year end 2016 - Boeing 2017 CMO

Fleet at year-end 2016 – Boeing 2017 CMO.

Along these years, Boeing has simplified the segmentation with which it provides the fleet and aircraft demand. Single aisle segment is not divided in up to 4 sub-segments. Twin aisle aircraft have gone from two categories (747 and the rest) to three (small and intermediate widebody and large aircraft) and back to two (small widebody and larger), but slightly different. Freighters come with less sub-segments, too.

Despite of the difference in the presentation of the fleet we can try to make a comparison:

Comparison Fleet at year end 2016

Comparison of aircraft fleet at year-end 2016: 1997 forecast vs. actual (sources: Boeing CMO 1997 and 2017).

Some reflections:

  • The overall size of the fleet was quite well predicted, with a difference of 1%.
  • The forecasts for small aircraft was too conservative: both single aisle and regional fleets are today larger than forecasted.
  • The forecasts for larger aircraft was too optimistic: both widebody and freighter fleets are today smaller than forecasted.

This year’s Boeing’s CMO presentation includes a couple of slides on the accuracy of 1997 CMO in relation to what would be the demand for new airplanes vs. what it has turned out to be 20 years later.

CMO_1997_2017

More aircraft have been delivered in relation to what had been forecasted. Retirement of aircraft also increased its pace with increases of oil price in the 2000s. See the chart below from Avolon’s paper “Aircraft retirement and storage trends” [PDF, 2 MB].

Retirement_vs_oil_Avolon.png

Now, having seen all this information, I can update this other graphic which I shared 5 years ago in a blog post titled “World commercial aircraft fleet: forecast vs. actual“:

Fleet evolution - forecast vs actual - 2017 CMO

World commercial aircraft fleet: past forecast vs. actual, and future demand (data source: Boeing CMOs up to 2017). Fleet (blue and red lines) in the left axis; market forecast (grey columns) in the right axis.

As you can see, actual fleets, forecasted fleets and forcasted fleet demand have all been increasing year by year . The compounded annual growth rate (CAGR) for each one has been:

  • Actual fleet growth: 3.65% from 1995 to 2016 (3.04% from 2000 to 2016).
  • Forecasted (15-20 years before) fleet growth: 3.52% from 2000 to 2036 (3.55% from 2000 to 2016).
  • 20-year market forecast: 4.82% from 1992 to 2017 (3.56% from 2001 to 2017).

The 20-year market forecasts have grown at a higher rate (4.82%) than fleets (3.65%), it is mainly because the first sets of data that I could retrieve come from the economic crisis of the beginning of the 1990’s, when Boeing trimmed down its forecasts. From the 2000’s the figures for market forecast have grown at a similar rate (3.56%) than those of fleets (3.04%). And so will be the growth of forecasted fleet from 2016 to 2036: 3.52%.


Notes:

  • 1990 CMO long-term market forecast is made for 15 years, not 20.
  • Forecast of fleet for the periods 2000-2003, 2005-2008 and 2010-2013 does not come from CMOs published 20 years before, but from 5, 10 and 15-year fleet forecasts included in the CMOs of 1996, 1997, 1998 and 1999.
  • Boeing does not publish 5, 10 and 15-year fleet forecasts anymore.
  • It would be interesting to have a per-segment graphic, however there is not consistent data to produce it for the same time span. Boeing has made different changes to the way it reports fleet and market segments.

Leave a comment

Filed under Aerospace & Defence