
About two years ago I wrote a post in which I analyzed the accuracy of commercial aircraft market forecasts. In particular, Boeing’s series of yearly Current Market Outlook (CMO). In that comparison, between the CMOs from 1997 and 2012, we could compare the predicted and the actual world fleets at 2011 year-end. Except for the twin-aisle segment and especially the large aircraft sector, the accuracy was remarkable, as the estimated global fleet only exceeded the actuals in 1%.
In this post, I just wanted to provide an update with the figures from the latest CMO (2014), released a few weeks ago, in comparison with 1999’s CMO. In that CMO from 1999 [PDF, 1.5MB], we find the following chart showing Boeing’s forecasted fleet size and distribution for 2003, 2008, 2013 and 2018 year-ends.
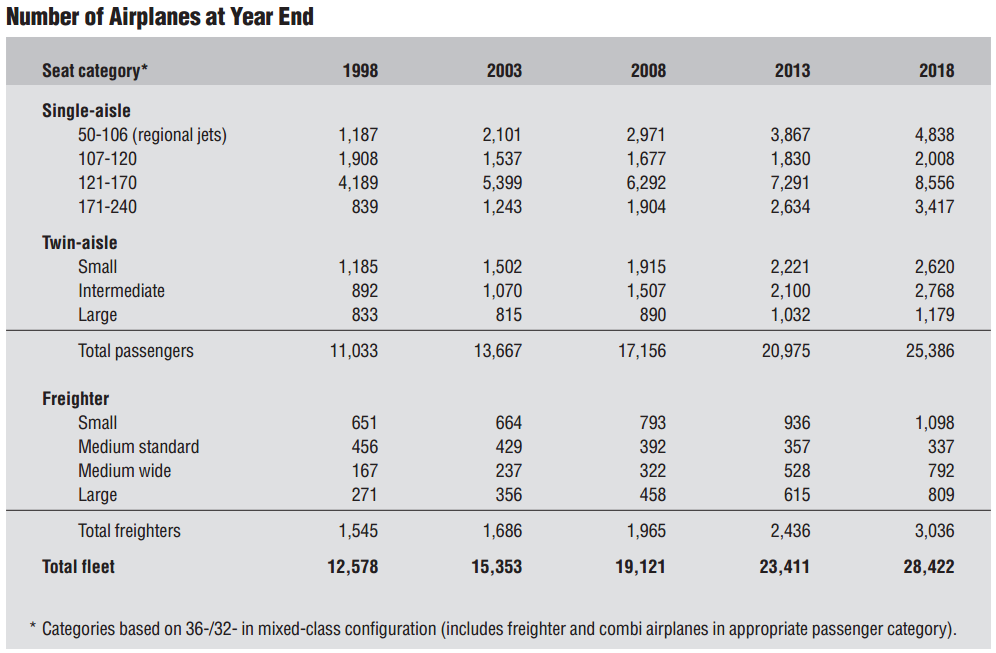
1999 Boeing CMO year-end fleet forecasts for 2003, 2008, 2013 & 2018.
In 2014 CMO, Boeing offered figures of 2013 year-end fleet (1).
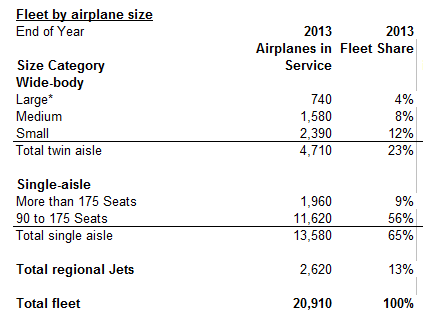
Fleet at year-end 2013 – Boeing 2014 CMO.
And now, the comparison is immediate:
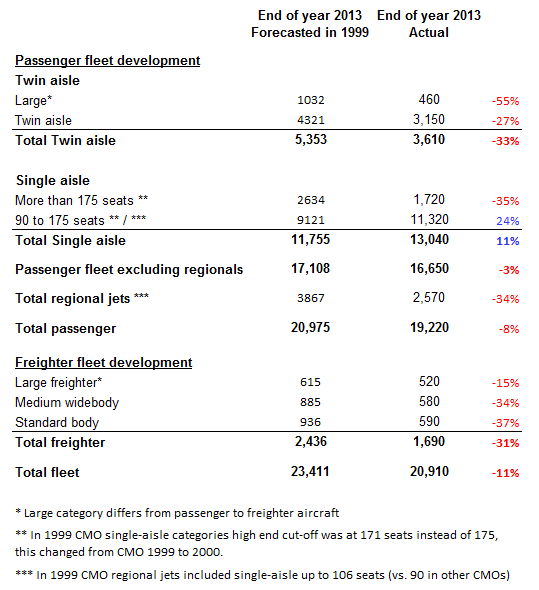
Comparison of aircraft fleet at year-end 2013: 1999 forecast vs. actual (sources: Boeing CMO 1999 and 2014).
Some reflections:
- The forecasts for all segment except for single-aisle (737-800) predicted higher numbers of aircraft in the fleet than the actuals have shown 15 years later (2).
- The total fleet figure was missed by 11%, a larger deviation than the 1% from two years ago.
- The 737 has been the model outselling the forecasts, offsetting partially the lower demand in all other segments. In particular, even if deviations per segment have been higher, the global forecasted figure for passenger aircraft has been missed by only 3%.
- The forecast is especially off mark the twin-aisle, where there are over 1,700 less aircraft in the current fleet than forecasted (3).
For the next such comparison we will need to wait some years, as from the year 2000 Boeing provided CMOs in a different fashion, offering a view of the forecasted fleet only 20 years from the date in question, instead of a view every 5 years. Therefore, we will have to wait until 2017, when we will be able to compare the 20-year forecast from 1997 CMO with the actuals of 2016 to be provided in 2017 CMO.
—
(1) In order to see the detailed split per segment differentiated between passenger and freighter aircraft, until the released of the full CMO, it is needed to use the exploring data tool offered in Boeing’s site.
(2) The differences in accuracy between the lower and higher end of the small-aisle segment should not be taken into account, as they are influenced by the different consideration of the cut off number of seats between a CMO and the other.
(3) Possibly a reason why Boeing plays down on the 747-8I and A380 segment.


I think the 737 is starting to get outdated, in terms of technology and cabin comfort, compared to the A320 series…
Were any predictions made on the amount of travel, for example revenue passenger kilometres? Those predictions could be correct, but the plane numbers wrong (eg two 150 seat planes provide the same APK as one 300 seat plane).
Good point Roger.
CMO 1999 forecast for 2013: 6,078 billions RPKs.
CMO 2014 actuals from 2013: 5,898 billions RPKs.
That is, 3% less traffic than forecasted (vs. 11% smaller fleet). Meaning that there is indeed the effect of what you suggested.
But it is puzzling that the fleet is smaller in numbers than what the smaller traffic suggests and however there are more single-aisle and less wide-bodies than forecasted. That should point at a larger average size of aircraft in each of the segment, but Boeing claimed the contrary 2 years ago (https://theblogbyjavier.com/2013/10/18/is-the-average-aircraft-size-decreasing-or-increasing-by-25/).
Pingback: Twin-aisle aircraft deliveries 20-year forecast (update 2015) | The Blog by Javier