
About three years ago I wrote a post in which I analyzed the accuracy of commercial aircraft market forecasts. In particular, Boeing’s series of yearly Current Market Outlook (CMO). In that comparison, between the CMOs from 1999 and 2014, we could compare the predicted and the actual world fleets at 2013 year-end.
In this post, I just wanted to provide an update with the figures from the latest CMO (2017), released a couple of weeks ago, in comparison with 1997’s CMO. In that CMO from 1997, we find the following chart showing Boeing’s forecasted fleet size and distribution for 2001, 2006, 2011 and 2016 year-ends.
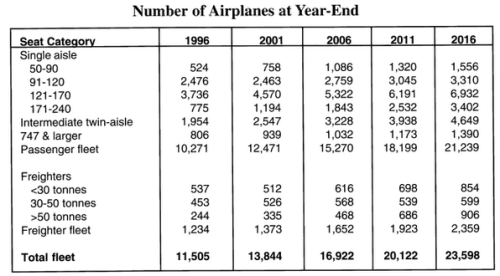
1997 Boeing CMO year-end fleet forecasts for 2001, 2006, 2011 & 2016.
In 2017’s CMO, Boeing offered figures of 2016 year-end fleet.
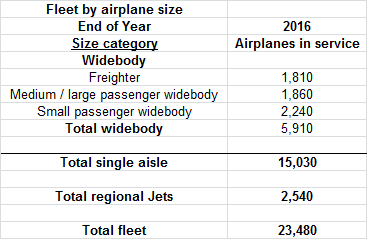
Fleet at year-end 2016 – Boeing 2017 CMO.
Along these years, Boeing has simplified the segmentation with which it provides the fleet and aircraft demand. Single aisle segment is not divided in up to 4 sub-segments. Twin aisle aircraft have gone from two categories (747 and the rest) to three (small and intermediate widebody and large aircraft) and back to two (small widebody and larger), but slightly different. Freighters come with less sub-segments, too.
Despite of the difference in the presentation of the fleet we can try to make a comparison:
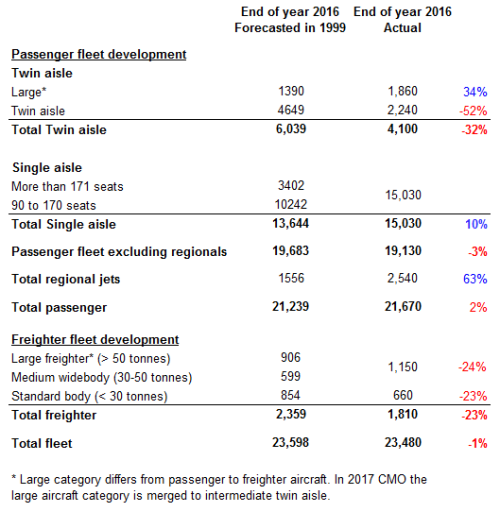
Comparison of aircraft fleet at year-end 2016: 1997 forecast vs. actual (sources: Boeing CMO 1997 and 2017).
Some reflections:
- The overall size of the fleet was quite well predicted, with a difference of 1%.
- The forecasts for small aircraft was too conservative: both single aisle and regional fleets are today larger than forecasted.
- The forecasts for larger aircraft was too optimistic: both widebody and freighter fleets are today smaller than forecasted.
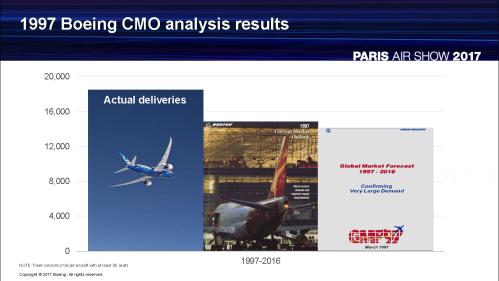
This year’s Boeing’s CMO presentation includes a couple of slides on the accuracy of 1997 CMO in relation to what would be the demand for new airplanes vs. what it has turned out to be 20 years later.
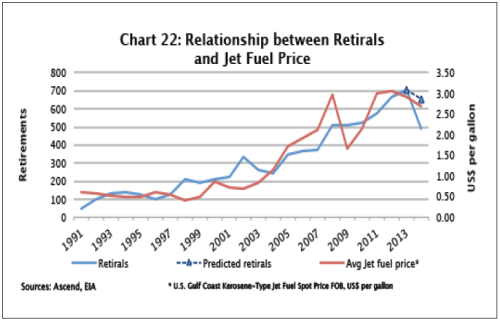
More aircraft have been delivered in relation to what had been forecasted. Retirement of aircraft also increased its pace with increases of oil price in the 2000s. See the chart below from Avolon’s paper “Aircraft retirement and storage trends” [PDF, 2 MB].
Now, having seen all this information, I can update this other graphic which I shared 5 years ago in a blog post titled “World commercial aircraft fleet: forecast vs. actual“:
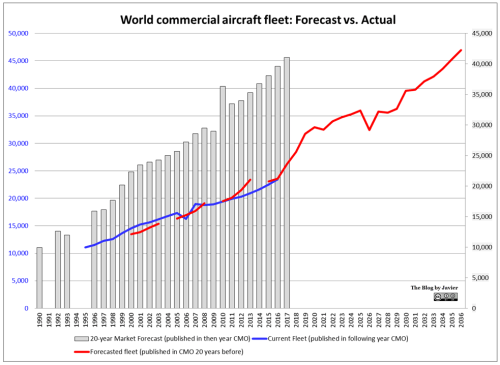
World commercial aircraft fleet: past forecast vs. actual, and future demand (data source: Boeing CMOs up to 2017). Fleet (blue and red lines) in the left axis; market forecast (grey columns) in the right axis.
As you can see, actual fleets, forecasted fleets and forcasted fleet demand have all been increasing year by year . The compounded annual growth rate (CAGR) for each one has been:
- Actual fleet growth: 3.65% from 1995 to 2016 (3.04% from 2000 to 2016).
- Forecasted (15-20 years before) fleet growth: 3.52% from 2000 to 2036 (3.55% from 2000 to 2016).
- 20-year market forecast: 4.82% from 1992 to 2017 (3.56% from 2001 to 2017).
The 20-year market forecasts have grown at a higher rate (4.82%) than fleets (3.65%), it is mainly because the first sets of data that I could retrieve come from the economic crisis of the beginning of the 1990’s, when Boeing trimmed down its forecasts. From the 2000’s the figures for market forecast have grown at a similar rate (3.56%) than those of fleets (3.04%). And so will be the growth of forecasted fleet from 2016 to 2036: 3.52%.
Notes:
- 1990 CMO long-term market forecast is made for 15 years, not 20.
- Forecast of fleet for the periods 2000-2003, 2005-2008 and 2010-2013 does not come from CMOs published 20 years before, but from 5, 10 and 15-year fleet forecasts included in the CMOs of 1996, 1997, 1998 and 1999.
- Boeing does not publish 5, 10 and 15-year fleet forecasts anymore.
- It would be interesting to have a per-segment graphic, however there is not consistent data to produce it for the same time span. Boeing has made different changes to the way it reports fleet and market segments.

