Few weeks ago, the Toulouse-based aircraft manufacturer ATR (Avions de Transport Régional) published a press release reporting some of its numbers for the year 2014 (being a private company, owned by Airbus and Alenia, it does not publish a complete financial annual report). Some of the key figures were:
- Revenues increased 10% to 1.8bn$.
- A new record of 83 deliveries (+12%).
- A new record of sales with 160 firm aircraft orders (plus 120 options). (1)
- A record backlog at year-end with 280 firm aircraft in the order book.
About 4 years ago, I wrote a post, “Turboprops market different dynamic“, in which I discussed:
[…] how civil turboprop market is unrelated to the larger and more known turbofan civil aircraft market and how its dynamics are completely unrelated to World GDP growth and thus world air traffic growth. […]
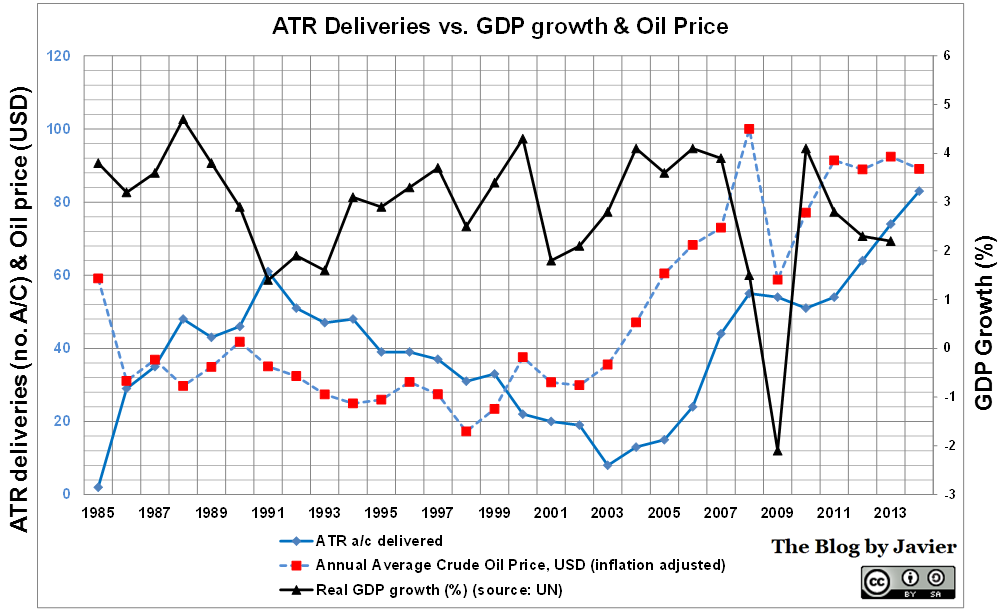
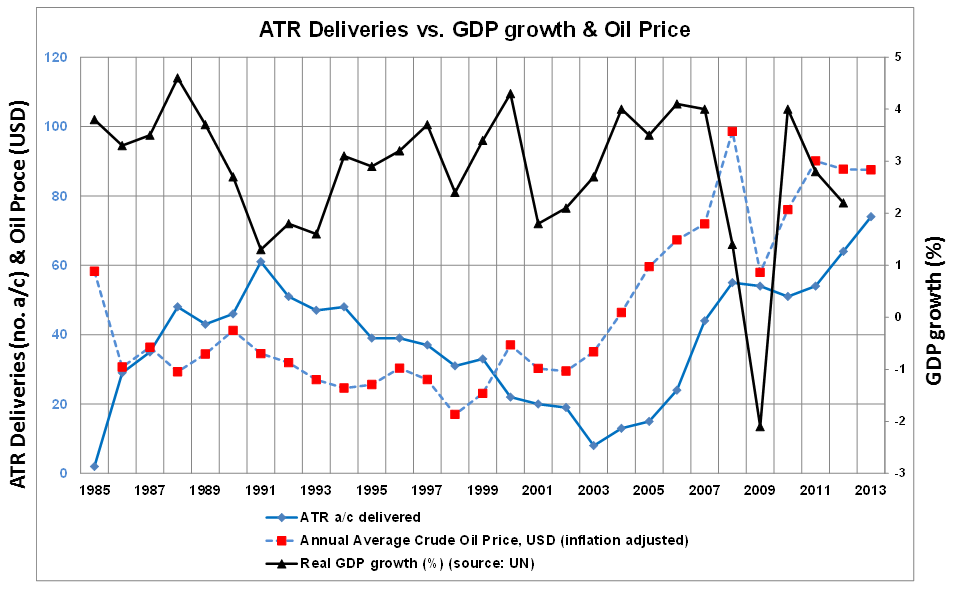
When calculating correlation between the different variables, I discovered that the correlation between GDP and deliveries is rather low, despite of the time lag applied (be it 2, 3, 4 years…). However I found that the oil prices and deliveries did correlate very well with a lag of 5-6 years, yielding coefficients of 0.55-.65, which are rather high.
I wanted to update the calculations I made then and last year, with the information of the 2014 exercise.

ATR deliveries vs. GDP growth and oil price (2014 update).
With the last years’ data, correlations are similar:
- Between oil prices and deliveries: high, above 0.54 from 1 year time lag, increasing through 6 years time lag (when it reaches a maximum of 0.82).
- Between GDP growth and deliveries: low, not more than 0.34, and negative correlations up from 1 to 5 years time lag.
If there was causality, we could infer that the from the moment that oil prices are computed, till they are taken into regional airlines’ models, the fleet planners identify the need for new turboprops, the case is approved by airlines’ management, discussions start with ATR, negotiations are closed between the airline and the manufacturer, the aircraft are built and delivered to the airline… it takes about 6 years. (2)
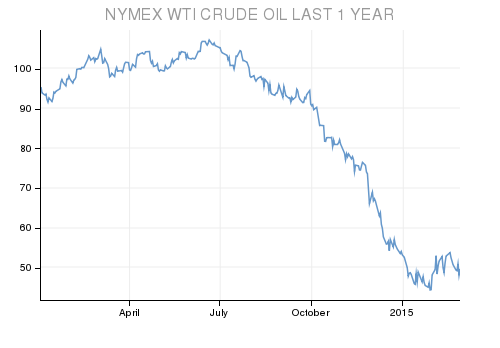
This year the prices of oil have abruptly decreased in the last quarter:

Oil prices drop Q4 2014.
However, this large drop is not yet fully noticed in the comparison made before as the historical database I use (here) only reflects prices up to the end of November and thus the 2014 average is still 89$ vs. 92.4$ in 2013. Even so, taking into account the figures from December (~55$) the year average will drop only to about 86$, not changing much the result.
It would be interesting though to see if oil prices stay low (50-60$) for the full 2015 year. If so, we could check whether the correlation stands and ATR starts to notice it in the form of lower orders (more cancellations?) and this is translated into lower amount of deliveries in about 3 years time (2018?).
—
(1) Some 18 cancellations that took place in 2014 go untold in the press release, though they are easily deduced from the information of orders, and backlog from 2014 and 2013.
(2) About 3 of those 6 years are consumed from placing the firm order to getting the aircraft delivered, as we can see by the current figures of backlog (280 a/c) and yearly deliveries (83 a/c).