Tag Archives: stocks

Our investment fund in 2013

It is 5 years now since Luca and I started investing together. This is the 4th year publishing this post in which I explain how our investments fared along the year (1). In previous years’ post I had explained how we had adopted for our personal investments the same approach mutual open-ended funds have.

Brief recap for newcomers:

As I explained last year, we had to define a net asset value per share (valor liquidativo de la participación) at the beginning of the period. This net asset value per share rises and decreases as the aggregate share prices of the stocks in the portfolio rise or decrease. When an investment fund informs about its yearly results it is referring to the performance of this net asset value per share.

Each time that there is an addition of capital (new investments, in this case by Luca or me) it is treated as an issue of new shares to ourselves. It doesn’t matter that we are the only “shareholders”. Depending on whether the net asset value has increased or decreased we are acquiring the new shares at a higher or lower price than we acquired the previous ones. Exactly as it works in a fund.

Let’s go to this years results: How did the year 2013 go? In line with 2013 good year for stock markets it wasn’t a bad one.

In 2013 we have not been very active investors, not doing many transactions nor adding lots of funds to the investments (with a wedding in sight for mid year and a baby to come we had a preference for cash). We mainly held previous investments and sold a couple of positions which already earned what we expected (2).

During 2012 I took note of the fund value about 22 times, so we could get an idea of how the fund evolved. As you may see in the graphic below, the net asset value per share at the beginning of 2013 was 44.63€ while at the end it increased to 51.03€, that is +14.34%. That was the performance of the fund in 2013 (not good enough to sell subscriptions to the fund! :-) ).

J&L investment fund performance during 2013.

J&L investment fund performance during 2013.

How does it compare with the main indexes?

  • S&P 500, +29.6% in $ terms [+23.9% in € terms, after taking into account F/X (3)] (this is the target index)
  • Dow Jones, +26.5% in $ terms [+20.9% in €]
  • NASDAQ, +38.2% in $ terms [+32.1% in €]
  • IBEX 35, +21.4% 
  • Euro Stoxx 50, +18%

The gains of the fund since its creation in January 2009 have been+66.51%, with a compounded annual gain of +10.85% (remember this always refers to the net asset value per share – marked by the first 2 positive years – and cash gains cannot be directly derived from the net asset value performance times the total assets).

Two years ago, I introduced the comparison with leading Spanish value investing fund managers from Bestinver (4). Let’s do the exercise again:

  • Bestinfond, +31.82%;
  • Bestinver Internacional, +32.54%;
  • Bestinver Bolsa, +29.72%.

All in all, 2013 has been a good year to present results, though it would had been even better if we had a bigger stake in Bestinver ;-).

I’ll keep you informed next year of this year’s results.

—–

(1) See previous posts showing 2012, 2011 and 2010 results.

(2) Unhappily among others we are not any longer shareholders of Metlife (will miss the iconic view of its landmark building in NY) and GE (will miss the good feeling when seeing a GE truck anywhere)…

(3) Since our investments account is based in the Euro zone, it is important to take into account dollar-euro exchange fluctuations for good and bad. Take a look at this website for interesting graphics, perpe. The USD gained 4.70% against the EURO in 2013 (or the EURO lost a 4.49%)

(4) Disclaimer: Since sometime in 2011, we have also positions in Bestinver, though I don’t get any fees for promoting it in the blog. (Our positions with Bestinver are excluded from the calculations of “J&L” fund to allow for clean comparisons).

NOTE: “J&L fund” numbers are pre-tax of capital gains realized, include dividends (twice taxed) and are net of transaction costs & brokerage commissions.

Leave a comment

Filed under Investing

Our investment fund in 2012

It is 4 years now since Luca and I started investing together. This is the 3rd year publishing this post in which I explain how our investments fared along the year. In previous years’ post I had explained how we had adopted for our personal investments the same approach mutual open-ended funds have.

Brief recap for newcomers:

As I explained last year, we had to define a net asset value per share (valor liquidativo de la participación) at the beginning of the period. This net asset value per share rises and decreases as the aggregate share prices of the stocks in the portfolio rise or decrease. When an investment fund informs about its yearly results it is referring to the performance of this net asset value per share.

Each time that there is an addition of capital (new investments, in this case by Luca or me) it is treated as an issue of new shares to ourselves. It doesn’t matter that we are the only “shareholders”. Depending on whether the net asset value has increased or decreased we are acquiring the new shares at a higher or lower price than we acquired the previous ones. Exactly as it works in a fund.

Let’s go to this years results: How did the year 2012 go? As last year, this is going to be a humbling exercise :-).

In 2012 we have not been very active investors, not doing many transactions nor adding lots of funds to the investments (with a wedding in sight we had a preference for cash). We mainly held previous investments and sold a couple of positions which already earned what we expected (1).

During 2012 I took note of the fund value about 30 times, so we could get an idea of how the fund evolved. As you may see in the graphic below, the net asset value per share at the beginning of 2012 was 47.28€ while at the end it fell to 44.63€, that is -5.6%. This was the performance of the fund in 2012 (again not good enough to sell subscriptions to the fund! :-) ).

"J&L" investment fund 2012 performance (built in Google spreadsheet linked to Google Finance data, thanks to a friend's invaluable suggestion).

How does it compare with the main indexes?

  • S&P 500 ~ +13.41% (this is the target index)
  • Dow Jones ~ +7.26%
  • NASDAQ ~ +15.91%
  • IBEX 35 ~ -4.6% 
  • Euro Stoxx 50 ~ +13.65%

The gains of the fund since its creation in January 2009 have been+53.69%, with a compounded annual gain of +11.3% (remember this always refers to the net asset value per share – marked by the first 2 positive years – and cash gains cannot be directly derived from the net asset value performance times the total assets).

Two years ago, I introduced the comparison with leading Spanish value investing fund managers from Bestinver (2). Let’s do the exercise again:

  • Bestinfond ~ +16.52%;
  • Bestinver Internacional ~ +16.89%;
  • Bestinver Bolsa ~ +14.88%.

All in all, 2012 has been a good year to present general results, except in Spain and for us, due to some shipping and mining stocks that didn’t fare well in 2012. Let’s see how they go in the coming years.

I’ll keep you informed next year of this year’s results.

—–

(1) Unhappily we are not any longer shareholders of Pzifer, with its bluish star pill

(2) Disclaimer: Since sometime in 2011, we have also positions in Bestinver (which we increased in 2012), though I don’t get any fees for promoting it in the blog. (Our positions with Bestinver are excluded from the calculations of “J&L” fund to allow for clean comparisons).

NOTE: “J&L fund” numbers are pre-tax of capital gains realized, include dividends (twice taxed) and are net of transaction costs & brokerage commissions.

1 Comment

Filed under Investing

Stocks & media hype

Last Friday after US stock markets closed I went to check the performance of the portfolio and meanwhile saw some headlines for business and general online papers: “Worst day of 2012“.

I didn’t feel that the day had been especially bad regarding stock markets. Both the Dow Jones and S&P 500 fell -0.69%, which indeed had been the worst day so far in 2012, but so far both indices had returned over 7.5% and 5.5% in the first 5 weeks of the year. So, I guess that what wasn’t the norm was the positive trend with only about 3-4 bad days so far.

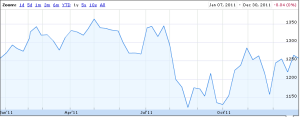
S&P 500 in 2012 through February 10.

I went further and compared the -0.69% to 2011 numbers, in this case only with S&P 500.

How many days did the index go below -0.69% in 2011?

64 days out of 252 trading days, that is 25% of the time. The index went up more than +0.69% for other 67 days (27% of the time). It went down but less than -0.69%, 51 days and up but less than +0.69%, 70 days. Quite an even distribution.

So, compared to 2011, a market move of 0.69%, up or down, was rather the average. During the whole year the S&P 500 returned barely 0%, so it’s true that 2011 wasn’t a particular good year, and it was as well especially volatile, indeed the average move along the year was ~1.04% and the median was 0.74%, either positive or negative.

S&P 500 in 2011.

This is just to point something not new: Mr. Market’s moves coupled with media hype aren’t good companions for taking investing decisions.

1 Comment

Filed under Investing

Our investment fund in 2011

Luca and I have been investing together for 3 years. Last year I wrote a post in which I explained how we had adopted for our personal investments the same approach mutual open-ended funds have.

As I explained last year, we had to define a net asset value per share (valor liquidativo de la participación) at the beginning of the period. This net asset value per share rises and decreases as the aggregate share prices of the stocks in the portfolio rise or decrease. When an investment fund informs about its yearly results it is referring to the performance of this net asset value per share.

Each time that there is an addition of capital (new investments, in this case by Luca or me) it is treated as an issue of new shares to ourselves. It doesn’t matter that we are the only “shareholders”. Depending on whether the net asset value has increased or decreased we are acquiring the new shares at a higher or lower price than we acquired the previous ones. Exactly as it works in a fund.

And why do we go through all this hassle? So we can now handily compare how our investments fare in relation to broad market indexes or specific investment funds.

How did the year 2011 go?

Let’s start with the humbling exercise :-). I had taken along the year above 50 samples, so we could get an idea of how the fund evolved. As you may see in the graphic below, the net asset value per share at the beginning of 2011 was 57.19€ while at the end it fell to 47.28€, that is -17.3%. This was the performance of the fund in 2011 (not good enough to sell subscriptions to the fund! :-)).

"J&L" investment fund 2011 performance (built in Google spreadsheet linked to Google Finance data, thanks to a friend's invaluable suggestion).

How does it compare with the main indexes?

  • S&P 500 ~ +0.07% (this is the target index)
  • Dow Jones ~ +5.5%
  • NASDAQ ~ -2.3%
  • IBEX 35 ~ -13.1% 
  • Euro Stoxx 50 ~ -18%

The gains of the fund since its creation in January 2009 have been+57.8%, with a compounded annual gain of +16.6% (remember this always refers to the net asset value per share – I will come back to this point in a future post, as cash gains or losses cannot be directly derived from the net asset value performance).

 Last year I introduced the comparison with the leading Spanish value investing fund, Bestinver (*). Let’s do the exercise again:

  • Bestinfond ~ -10.3%;
  • Bestinver Internacional ~ -10.1%;
  • Bestinver Bolsa ~ -12.7%.

All in all, 2011 hasn’t been a good year to present general results (for us, Bestinver or some indexes) however from the value investing perspective it hasn’t been that bad for buying (we performed 18 buy operations, while we only sold shares of 4 companies).

As any investment fund would do, prior to buying shares of a specific company we calculate the range in which we believe the target price shall be for us to sell the stock (and if the margin of safety is wide enough we buy). Taking the conservative values for each of the shares in our portfolio, we believe the target net asset value per share should be around 159€, thus having an estimated potential upside of about x3.3.

The latest factsheet of Bestinfond [PDF, November  2011] informed about a potential upside of x2.3. We may be optimistic; time will tell. And precisely that, time, being long-term value investors, we have plenty of :-).

I’ll keep you informed next year of this year’s results.

(*) Disclaimer: Since sometime in 2011, we have also positions in Bestinver, though I don’t get any fees for promoting it in the blog. (Our positions with Bestinver are excluded from the calculations of “J&L” fund to allow for clean comparisons).

NOTE: “J&L fund” numbers are pre-tax of capital gains realized, include dividends (twice taxed) and are net of transaction costs & brokerage commissions.

3 Comments

Filed under Investing

Ask octopus Paul to invest for you

By now, everybody probably has heard about the octopus Paul picking winners of World Cup football matches. So far, it got right all the results of Germany. Today it picked Spain as winner of the final next Sunday. See the video of its memorable performance in CNN.

First thought: what a monumental charade this is! Second thought I had today at work: what if Paul was picking stocks for an investment fund?

The thought is not that out of the box: Burton G. Malkiel in his 1973 book, “A Random Walk Down Wall Street” (which I strongly recommend), suggested that a blindfolded monkey throwing darts to select stocks wouldn’t do worse than professional fund managers.

The Wall Street Journal went a step further and tried to prove the point. They did so organizing the 6-months Dartboard contest in 1988, a contest that continued along 14 years in more than a hundred 6-months periods. They didn’t use a monkey but the newspaper staff and they weren’t blindfolded. Nevertheless, the stock picks were quite random. See the explanation of that fun story in this article from Goergette Jansen a few months before the contest was to be finished in 2002.

So, how did the “monkey” do against the pros? Dartboard picks won the contest 39% of the times while pros won 61% of them. So, the pros got better results the majority of the time. Nevertheless, think that 39% of the times you would have been better off leaving your investments decisions to the darts, a monkey or octopus Paul (call it the way you want) than professional managers who get paid to maximize your returns… uh.

After those 14 years, pros racked up an average of 10.2% gain while the darts got a 3.5% gain (this is way better than my company-sponsored BBVA pension fund…).

So, next time you jokingly comment on Paul, think that you might as well ask him where to put your money and even get better results than when listening to the advice of the broker of your bank…

2 Comments

Filed under Books, Investing

Stocks vs. Bonds, 200 years

Some weeks ago I had two different conversations with friends. The issue: whether Greek bonds would be a good investment given the yields they are being offered at. I then argued that I didn’t think it was a safe investment, that many countries had defaulted payments, and as a value investor in the making I tried to explain that a much better investment would be to find out there some great stocks at a big discount.

I was also looking for some graphics to send them to prove the point. I had seen those graphics at the annual investors’ forum of the asset management firm Bestinver in different years. They represented how different the outcome of an investment would be for a person living either in Germany in the 1920-30’s or in Argentina in the last 15 years in case this person had invested in the stock market or in government bonds, supposedly safer.

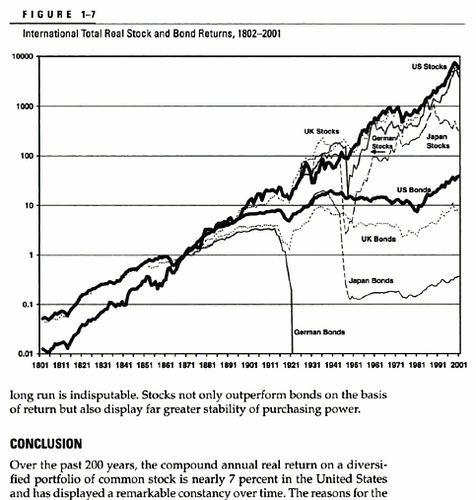
In both cases the investment is much better off when it’s composed of stocks, as they represent a portion of a real company that continues to operate after the crisis and the currency devaluation/hyperinflation period that typically follows. The value of the investment in bonds is suddenly reduced to nearly zero… At that time I didn’t find any of those graphics in the Net, but the other day I found a similar one. Here it goes (note the scale is logarithmic):

Stocks vs. Bonds, 200 years comparison.

Please, note the difference especially between German and Japanese bonds and stocks. But also with US and UK stocks and bonds the difference persists.

The managers of Bestinver year after year repeat the same example: in those situations is much better to be invested in real assets, be it portions of an enterprise (stocks), chairs, and pencils, even houses… all these are assets that once the crisis is over will retain the value they have. However the paper money has no value once the nominal value is devalued.

2 Comments

Filed under Economy, Investing