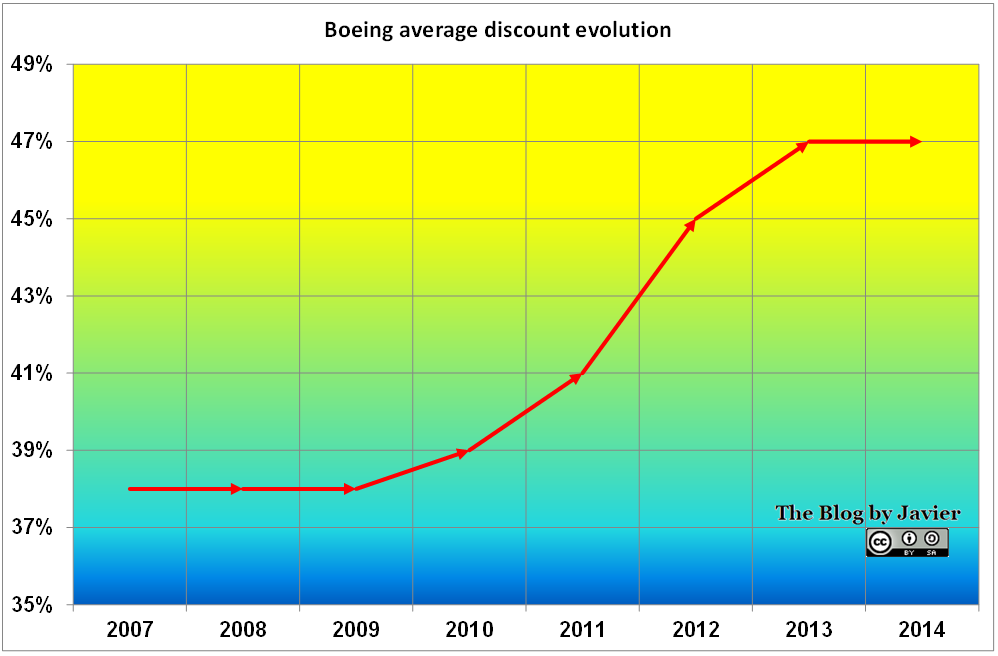
In a previous post I updated the estimate of what is the average discount Boeing applies when selling its commercial airplanes using 2014 data of list prices, deliveries and reported revenues. The figure I came up with was a 47% discount. I included the following graphic showing the discount evolution:

Boeing Average Discount Evolution, through 2014.
Last year, seeing the increasing trend of average discount together with knowing the fact that Boeing regularly increases list prices triggered the following question: Have Boeing airplane discounted prices increased, decreased or stayed constant in the recent years? I set out to answer this question using the estimated average discount of each year (1) from the graphic above.
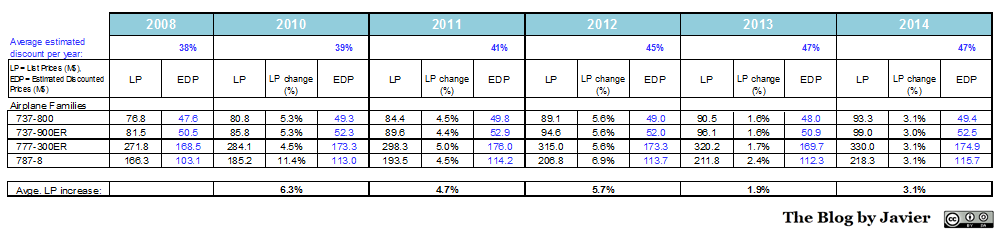
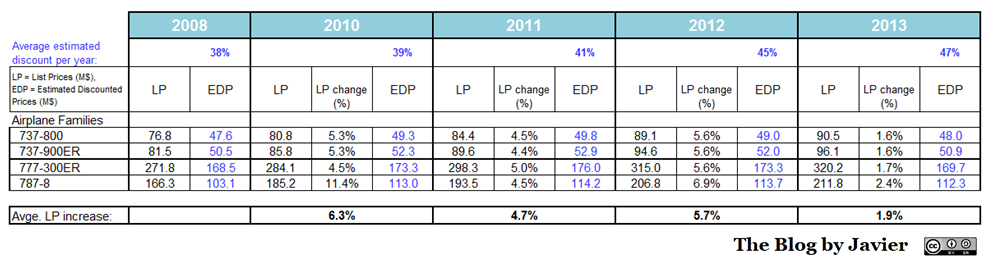
The Boeing list prices (LP) (2) can be found here. I have been recording those prices for years and thus have a table with the evolution of list prices for each model year by year. The following step is to apply the average discount estimated for each year to then-year list prices, to get the estimated discounted prices (EDP) (2) per model. Thus, a table can be built for the last 6 years.
You can find below the result for the best-selling aircraft during previous years: 737-800, 737-900ER, 777-300ER and 787-8. Together these 4 models amounted to over 640 deliveries in 2014 or 89% of the total 723 airplanes Boeing delivered in 2014.

Boeing List and discount Prices evolution table, 2008-2014.
In the table above I included in black figures what have been Boeing list prices of these models in the past years (as reported in their website) while I marked in blue the figures which are estimated, using as a departure point the calculated averages discounts per year (also included in blue in the table). I included as well the list prices year-on-year change as a % of the previous year list prices, per model.
The average list price increase included at the bottom line is computed with the information of all Boeing models (19 in 2008 and 20 in 2014, though different ones (e.g. last year addition of 777-8X and 777-9X), a total of 26 different models along this period), not only the 4 included in this table.
You may see in the table above that after not increasing prices in 2009, Boeing has steadily increased them in 2010 (6.3%), 2011 (4.7%), 2012 (6.7%), 2013 (1.9%) and 2014 (3.1%). However, if you take a look at the blue figures in the same table you will notice that prices of 2014 are between 2010 and 2011 price levels for all 4 models! That is, the widely announced yearly list prices increase has been yearly offset by a discreet (not-announced) increase in the discounts applied to the sales of airplanes. Thus, the pricing power of Boeing has remained barely constant during the last 5 years. You may see it better in the graphic below:

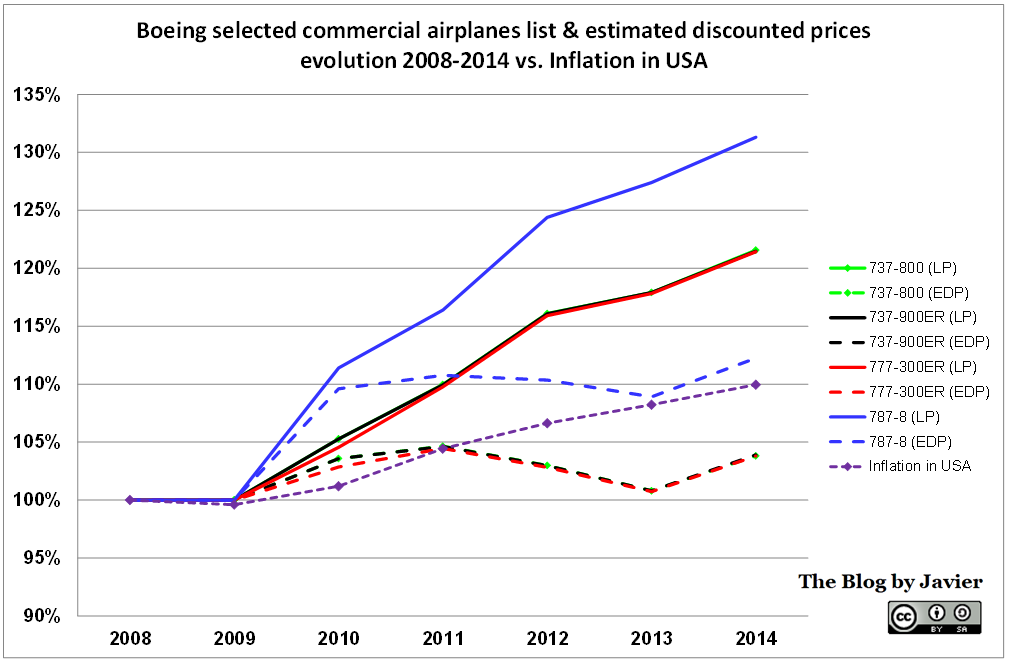
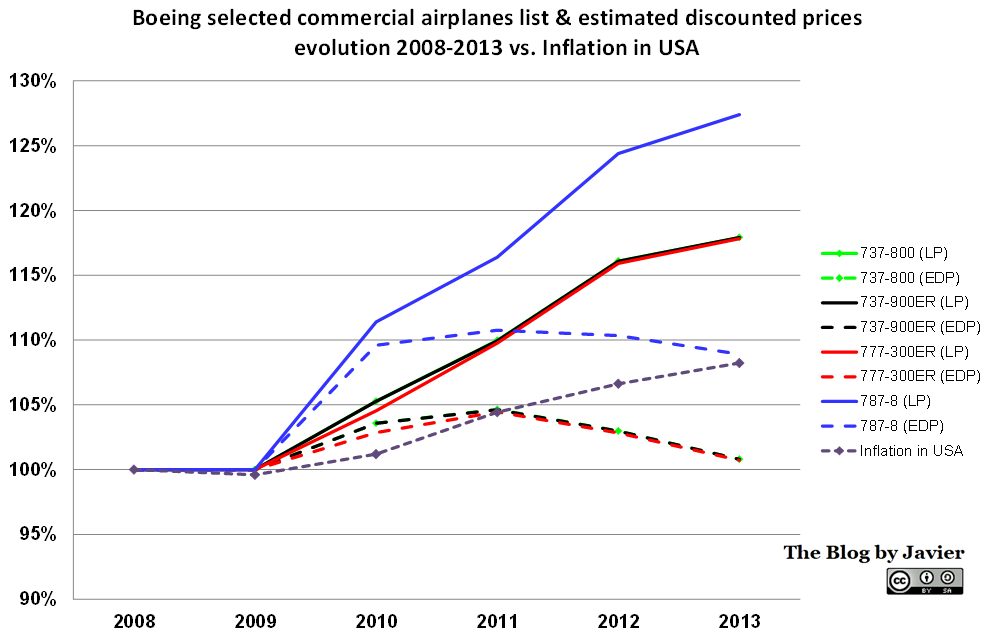
Boeing List & discount Prices evolution graphic vs. inflation in USA (through 2014).
The graphic shows the price evolution for each of the 4 airplane models selected, taking as a reference their list and estimated discounted prices in 2008 (indicated as 100%) and also the evolution of inflation in the USA (3) in purple, to reflect the evolution of real prices (i.e. accounting for inflation). List prices are shown with straight lines, versus dashed lines used for estimated prices. Each pair of prices for each aircraft is presented in the same color for easier identification. Some comments to the graphic:
- Through continuous increases, 2014 list prices were between 21% (737 and 777) and 31% (for the 787) higher than in 2008.
- However, due to increasing discounts from 38% in 2008 to 47% in 2014, the increase in list prices is almost entirely offset (especially for 737 and 777, just 4% above 2008 levels).
- 2014 discounted prices are below 2011 discounted prices for all models except 787.
- If compare the evolution of prices vs. the US inflation (general prices in 2014 being 10% higher than in 2008), we see that:
- Boeing actually lost pricing power in both the 737 and 777, which are cheaper in real (inflation-adjusted) discounted terms in 2014 than they were in 2008 (about 6% cheaper).
- Only the 787 has been able to keep up the pace of discount escalation and inflation.
—
(1) There is no way to know the real price and discount that Boeing applies in each sale, as it will depend from customer to customer (American Airlines -AMR- or Fedex) and from model to model (737-800 or 787-8). There where competition is tougher, discounts will be higher. However, the estimates I have made are an average of all Boeing aircraft sold in a given year.
(2) Both list prices (LP) and estimated discounted prices (EDP) are expressed in then-year dollars.
(3) US inflation series since 2008: -0.4% (2009), 1.6% (2010), 3.2% (2011), 2.1% (2012), 1.5% (2013) and 1.6% (2014).