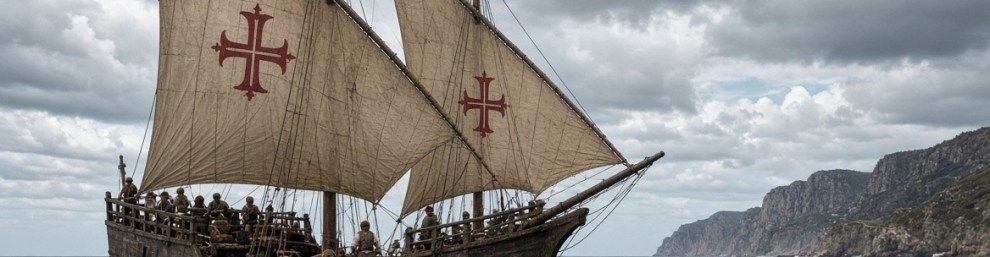
“The discovery of America, and that of the passage to the East Indies by the Cape of Good Hope, are the two greatest and most important events recorded in the history of mankind.”
“What benefits or what misfortunes to mankind may hereafter result from those great events, no human wisdom can foresee.”
Adam Smith, The Wealth of Nations (1776), Book IV, Chapter VII
I come back very often to this quote, typically around Columbus day (October 12th) or when discussing the discovery of America. In this post I wanted to focus on the passage to the East Indies by the Cape of Good Hope, who opened it, how it happened, and what the route looks like today, with some data on trade and ships.
Portuguese exploration along the African coast accelerated under Prince Henry the Navigator in the early 15th century. The goals were practical and ambitious: find a sea route to the spice markets of India, reduce dependence on Muslim-controlled land routes, and expand trade and Christian influence.
Bartolomeu Dias, the man who opened the route
Very little is known about his early years. Bartolomeu Dias was born around 1450 in Portugal, probably into a family with a maritime tradition. He served at the court of King John II (João II) as a cavalier of the royal household and superintendent of the royal warehouses, and in 1481 he is believed to have taken part in Diogo de Azambuja’s expedition to the Gold Coast (modern Ghana) to establish the fortress and trading post of São Jorge da Mina (Elmina). In October 1486 he received an annuity from the king for “services to come”.
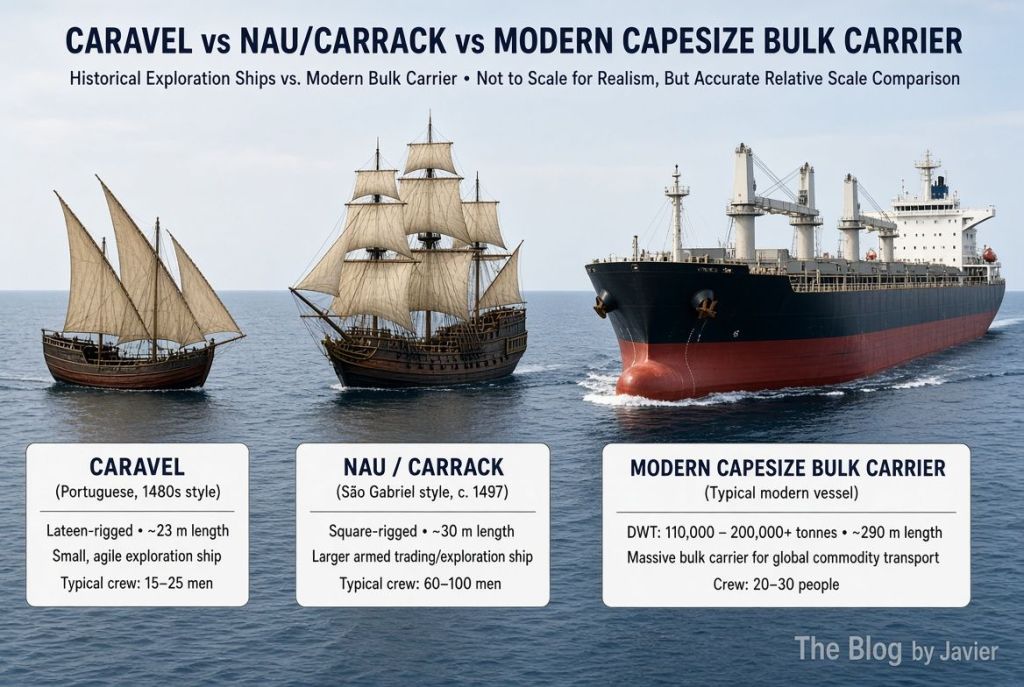
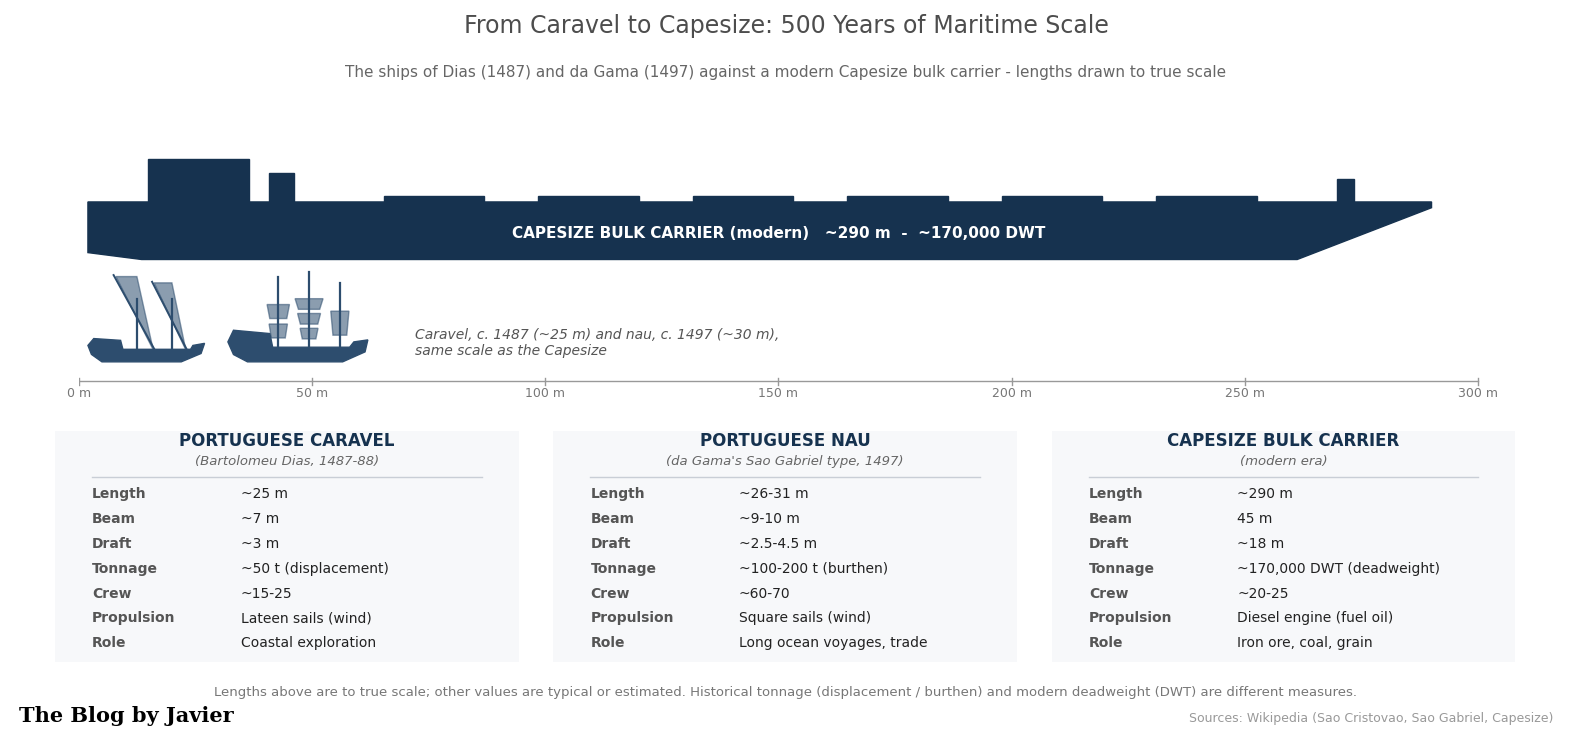
In 1487 the king commissioned him to continue the exploration of the African coast beyond the points reached by Diogo Cão, and to seek a sea route to Asia. He left Lisbon in July or August 1487 with three ships: two caravels of about 50 tons each (São Cristóvão, captained by himself, and São Pantaleão) plus a supply ship commanded by his brother Diogo. Some key points of the voyage:
- He sailed down the West African coast past Cão’s markers, reaching Walvis Bay (Namibia) around 8 December 1487.
- Driven southwest by storms (or deliberately sailing) into the open South Atlantic, he traced a wide arc well west of the African coast.
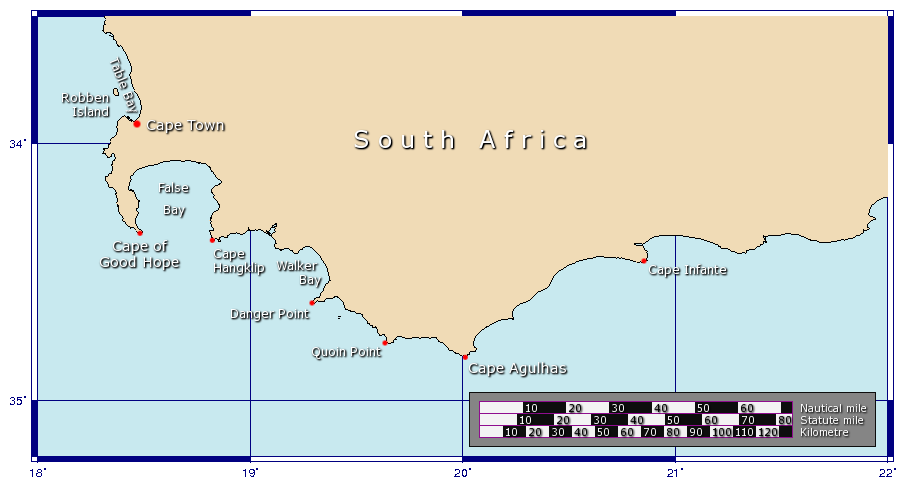
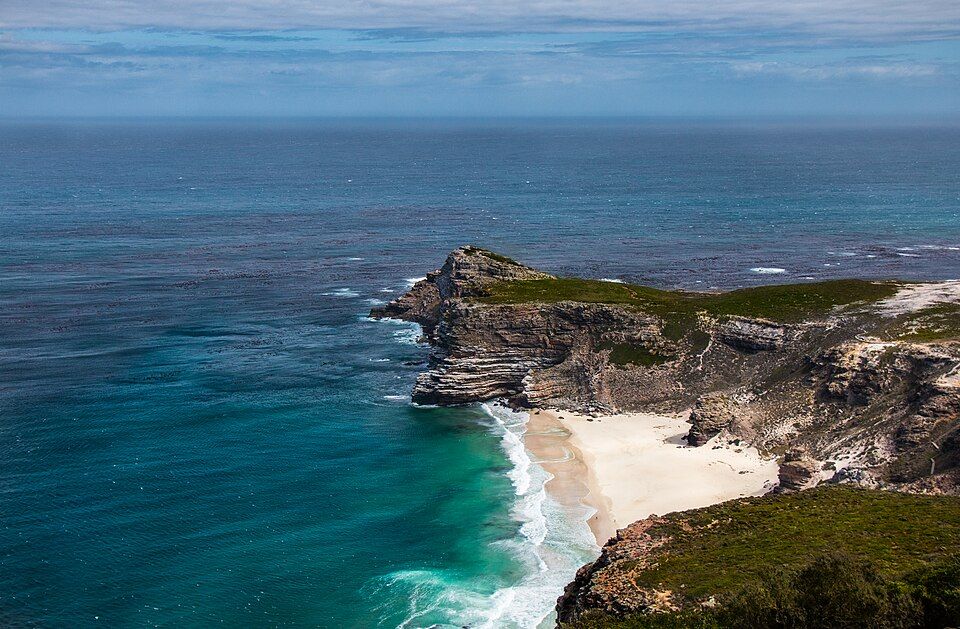
- First landfall east of the cape: around 3-4 February 1488, at what is today Mossel Bay (South Africa). Without knowing it, he had already rounded the southern tip of Africa.
- He continued east to Kwaaihoek, near the mouth of the Bushman’s River, where on 12 March 1488 the crew planted a padrão (stone pillar) dedicated to St. Gregory.
- There the exhausted crew forced the return. On the way back they finally sighted the cape itself (May 1488). Dias reportedly named it Cabo das Tormentas (“Cape of Storms”); King John II later renamed it Cabo da Boa Esperança, “Cape of Good Hope”, because it promised a route to the East.
- He arrived back in Lisbon in December 1488, some 16 months later, having charted hundreds of miles of previously unknown coast.
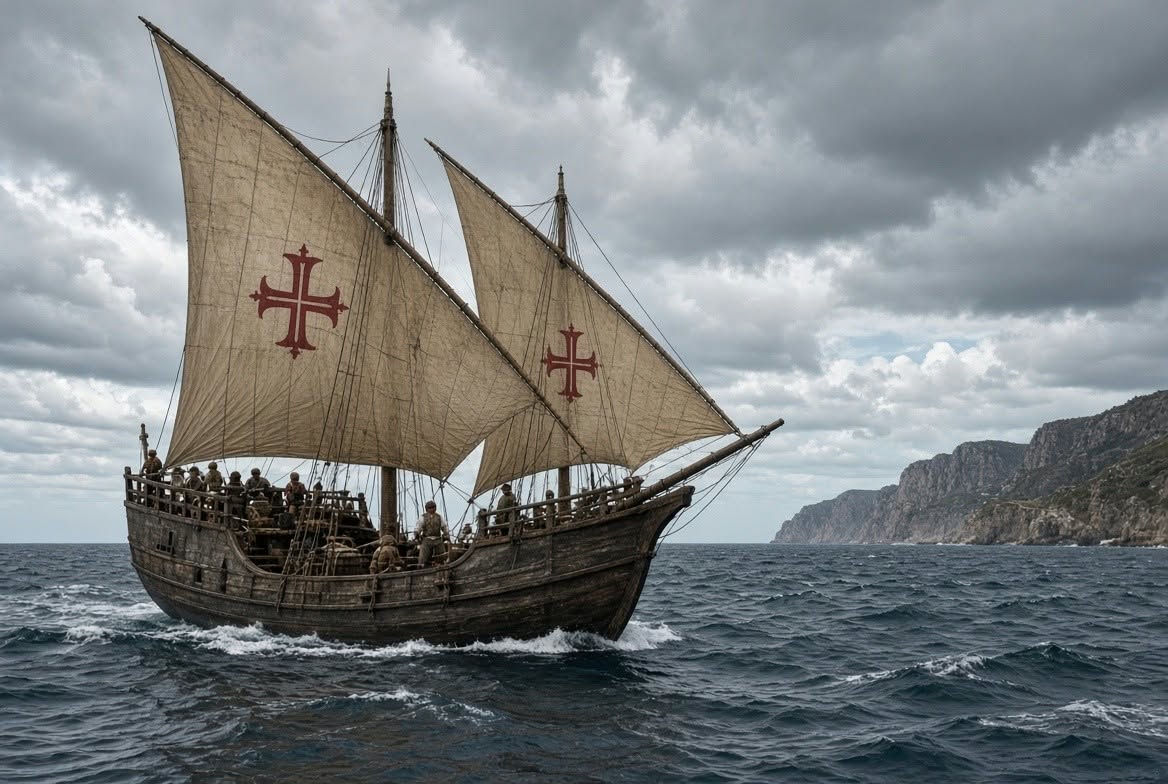
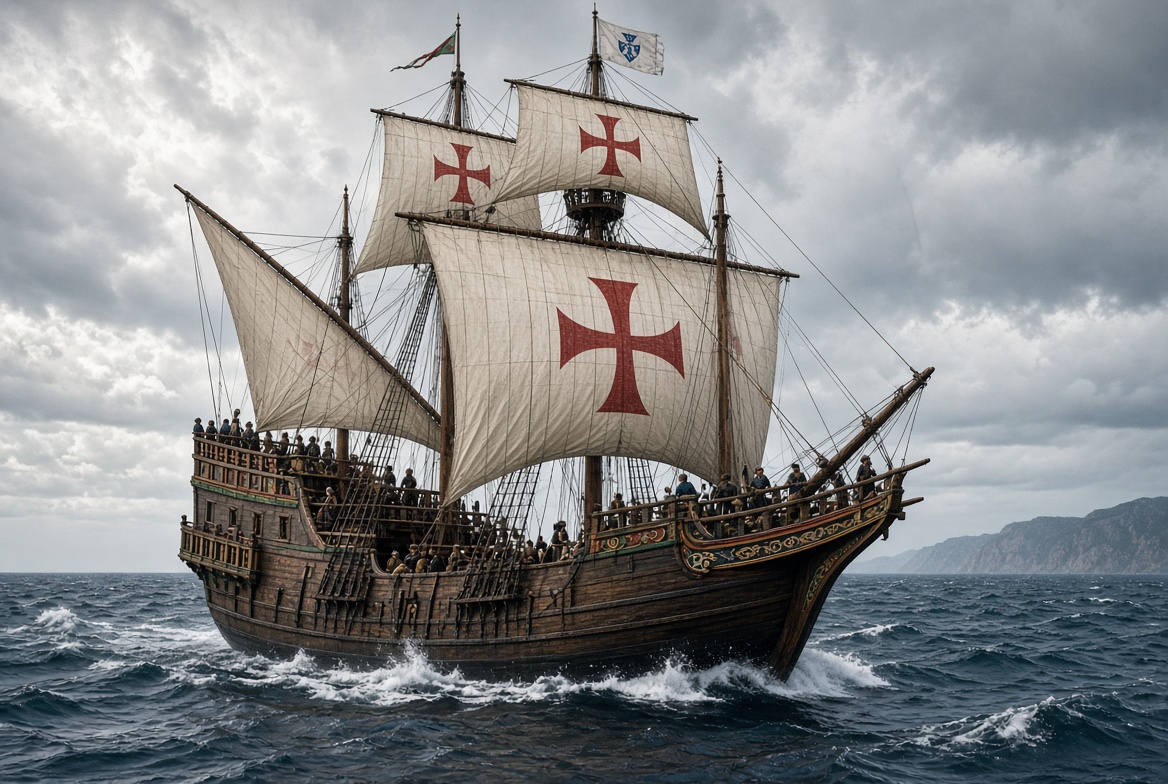
After his return he received limited recognition, but he helped design and outfit the ships (São Gabriel and São Rafael) for Vasco da Gama‘s 1497-1499 expedition to India. In 1500 he commanded a ship in Pedro Álvares Cabral’s fleet bound for India and died on 29 May 1500, when a storm sank four ships near the very cape he had first rounded twelve years earlier. Contemporary records of his voyage are scarce (many were lost in the 1755 Lisbon earthquake); much of what we know comes from later chroniclers such as João de Barros.
A school project (and a family trip)
This is a subject we know well at home, as earlier this year when my daughter Andrea (then 12 years old and studying in grade 7) had to do a school project for History class, she chose to do it about Bartolomeu Dias, as they had been studying trade routes, the Silk road, etc.
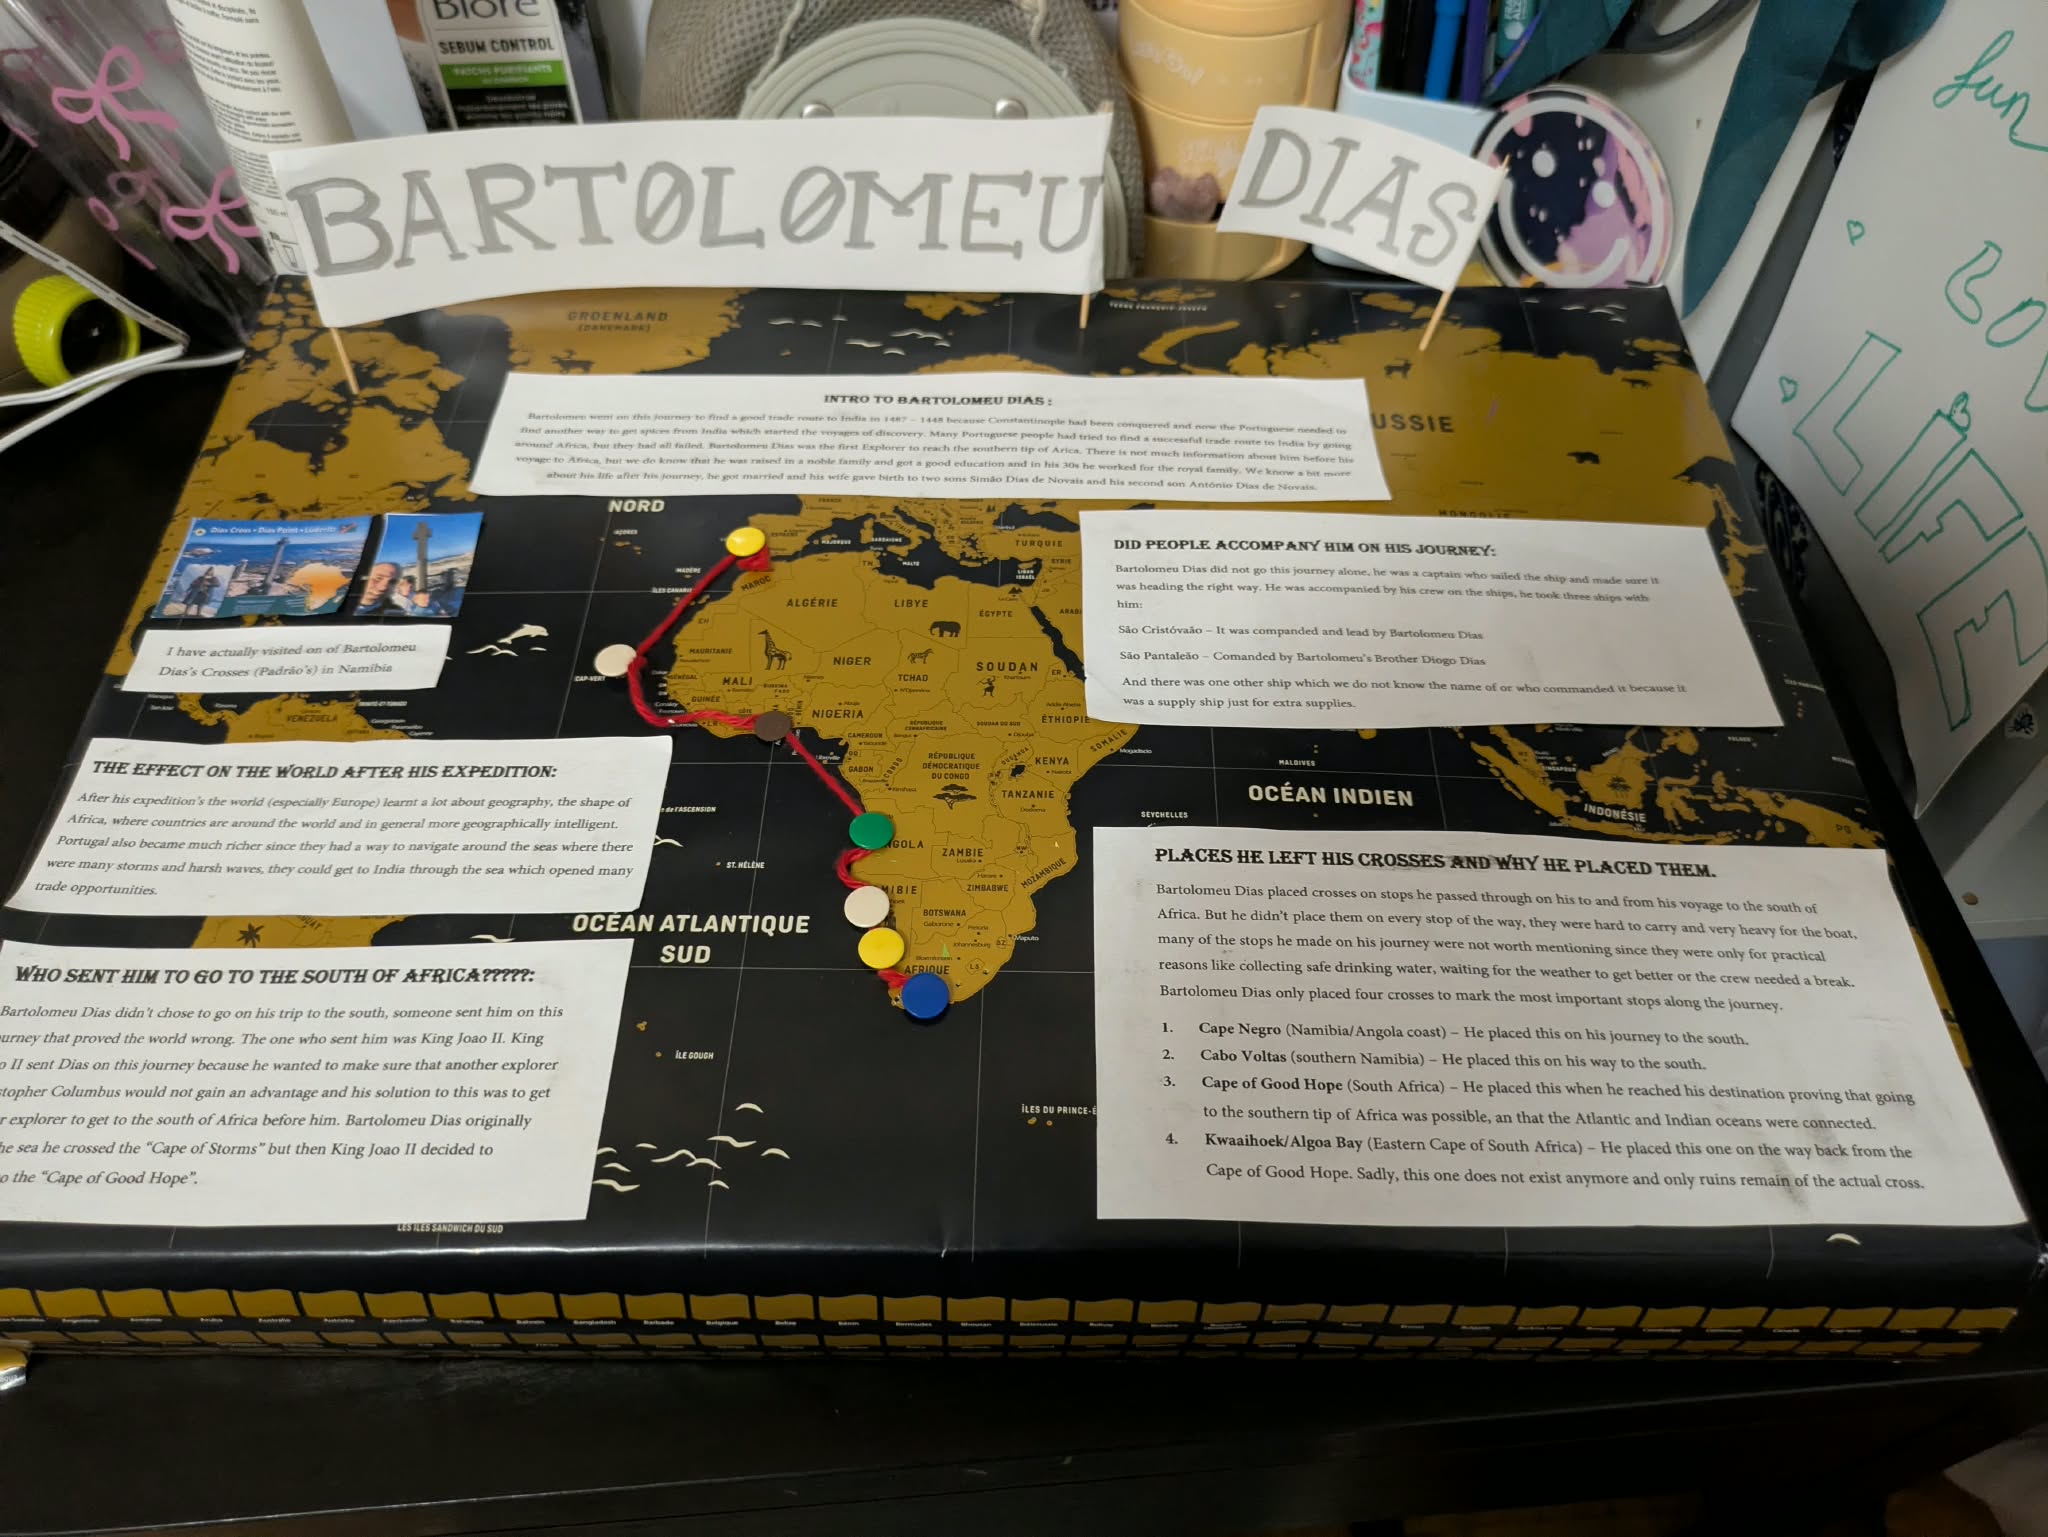
Her poster covers who sent him south (King John II), who accompanied him on the journey, the effect of the expedition on the world, and the four places where, according to her research, he left his crosses: Cape Negro, Cabo Voltas (both on the way south), the Cape of Good Hope, and Kwaaihoek / Algoa Bay on the way back. And she proudly notes: “I have actually visited one of Bartolomeu Dias’s Crosses (Padrão’s) in Namibia“.
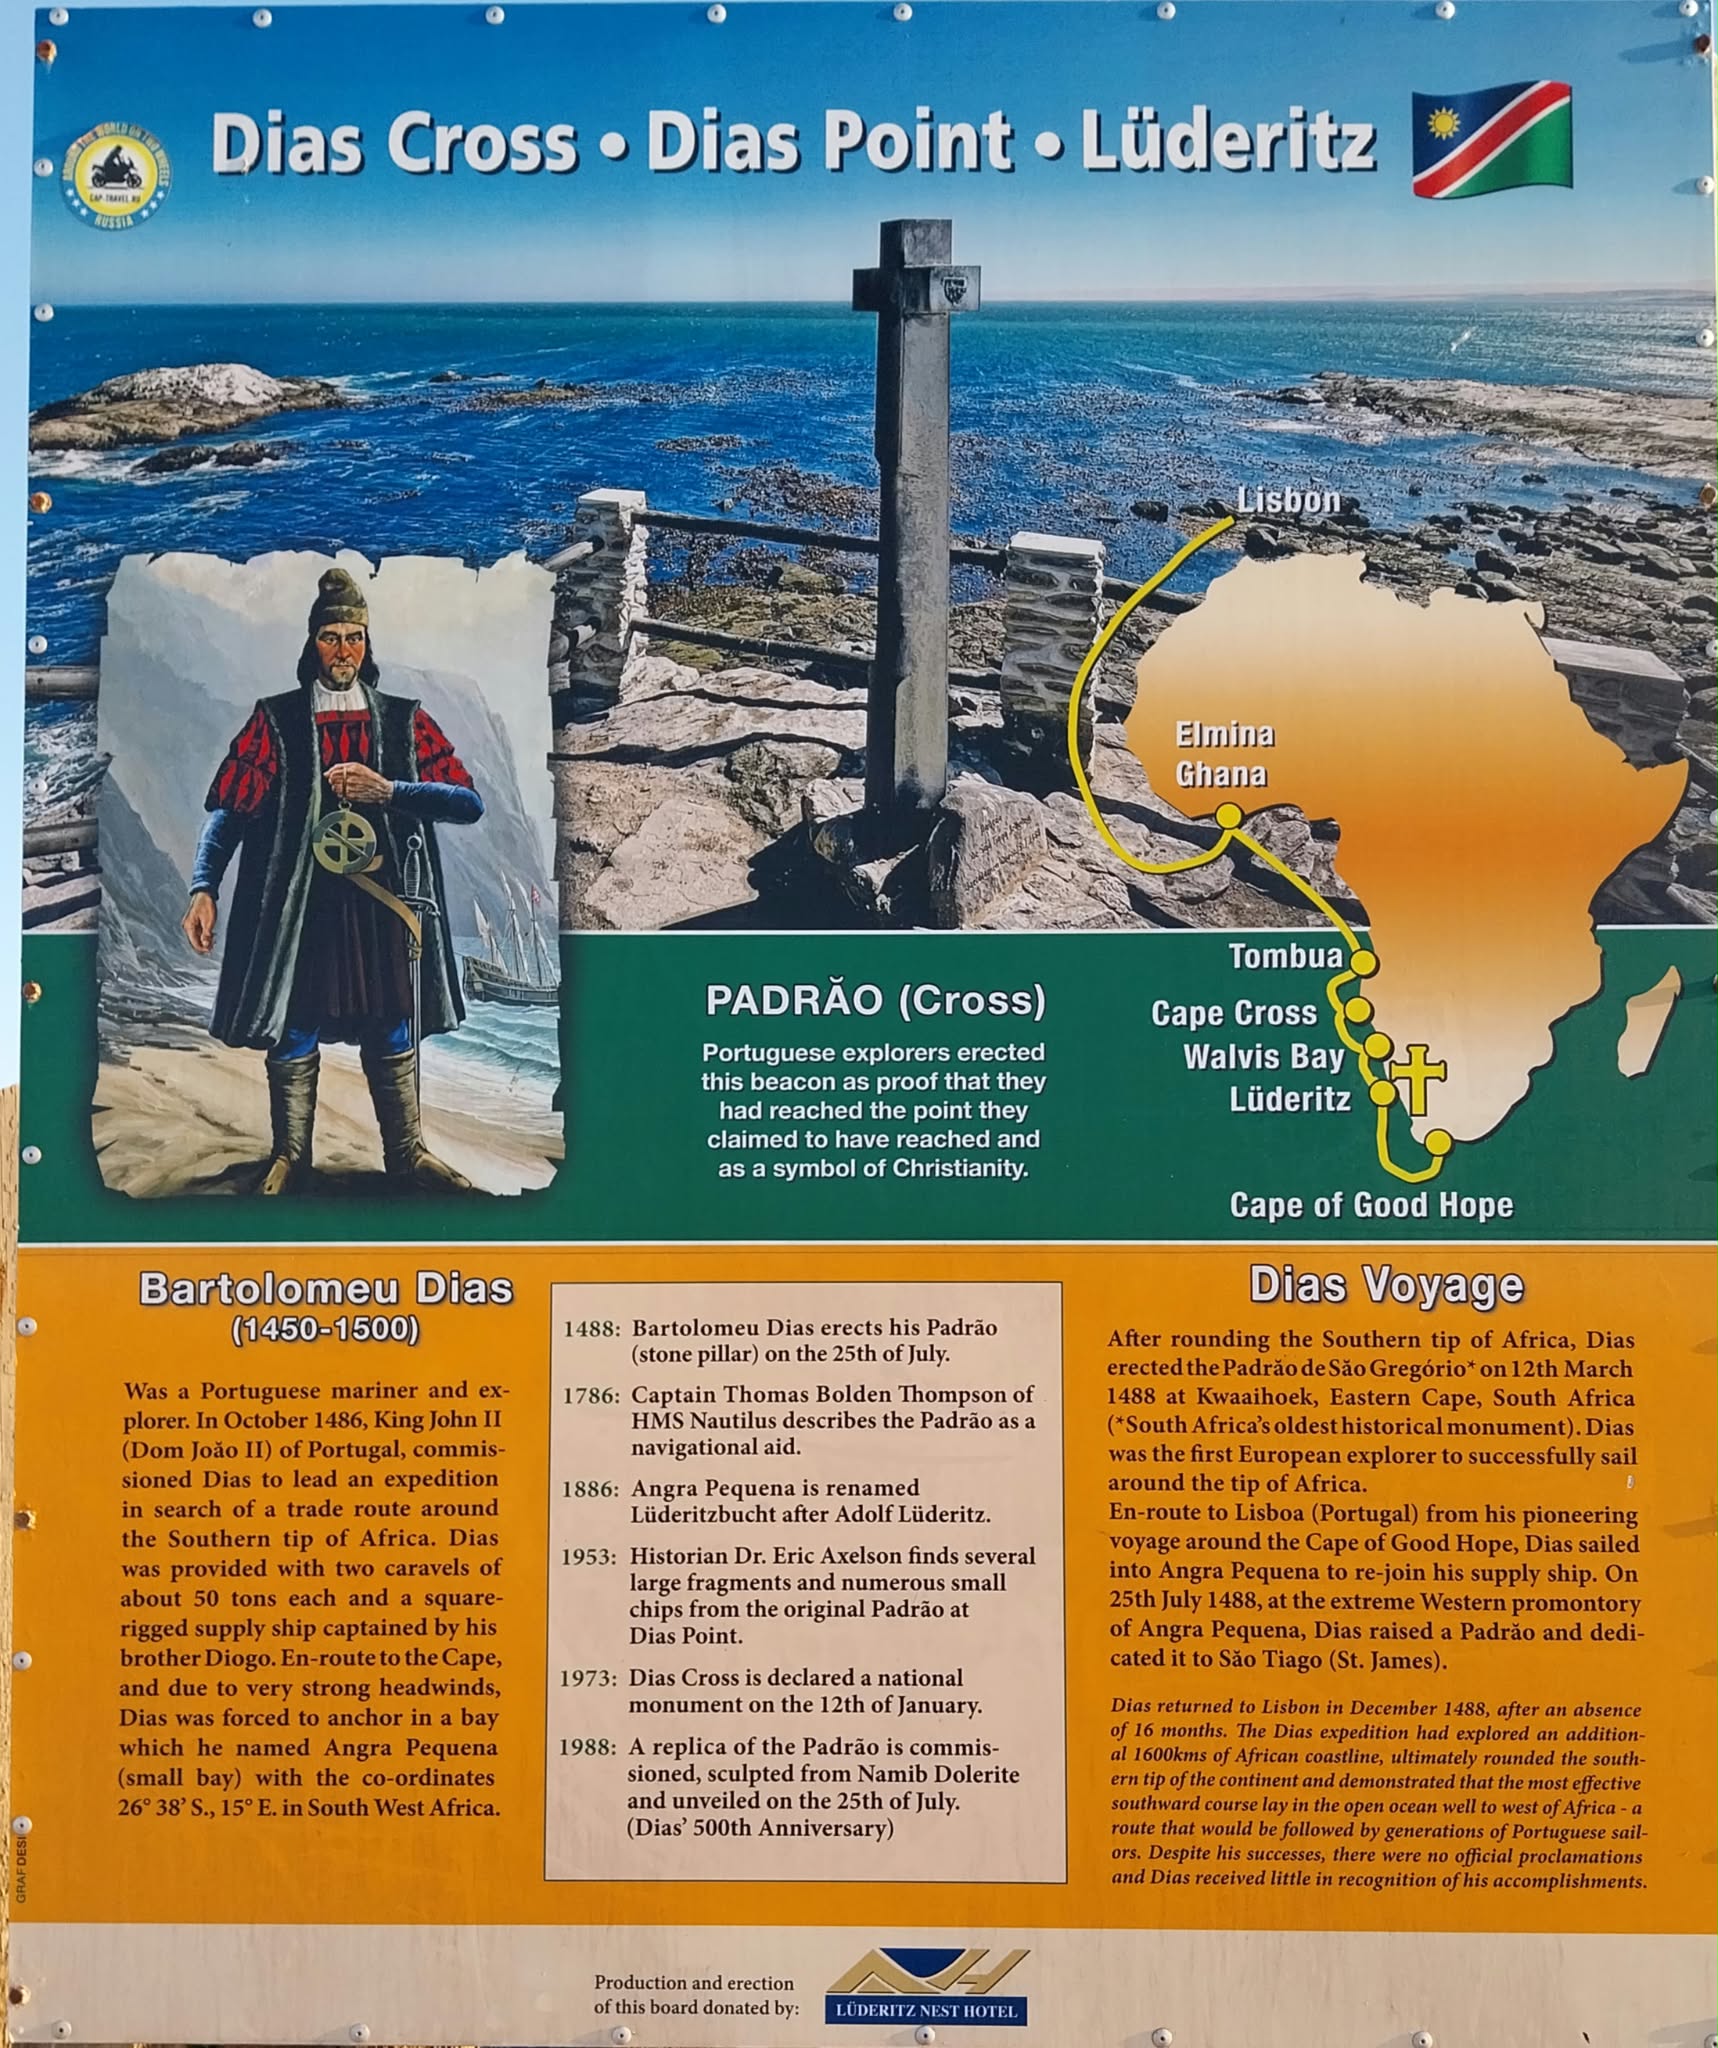
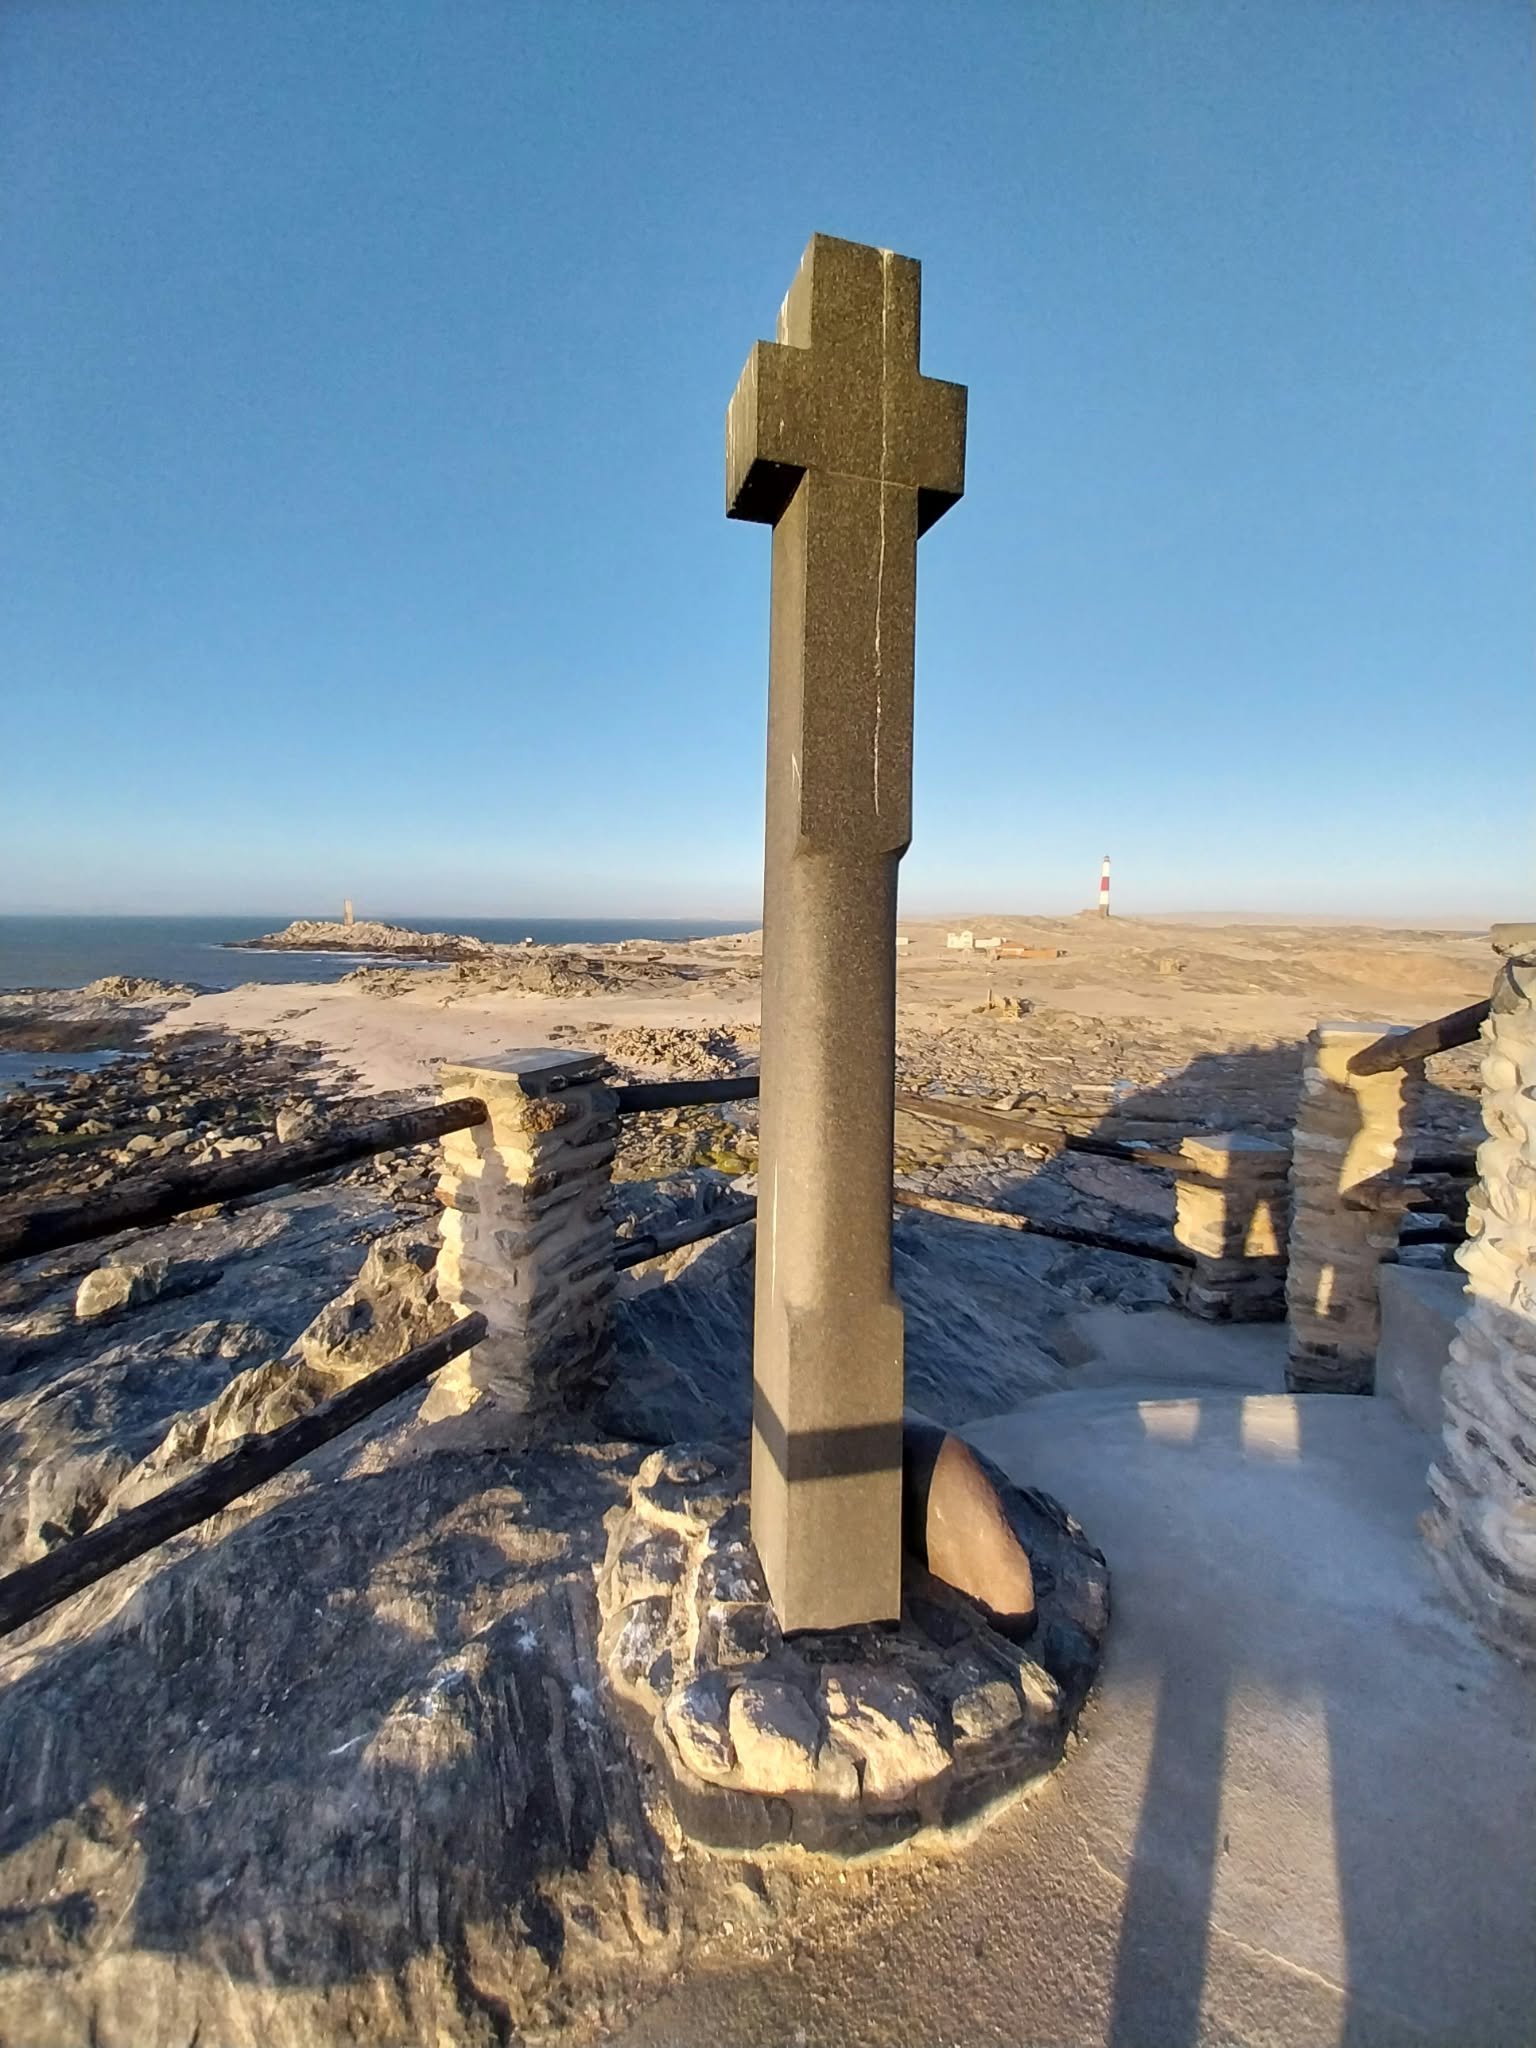
Indeed. On a family road trip around Namibia in 2024, we stopped at Dias Point, near Lüderitz, where a replica of that padrão still stands:
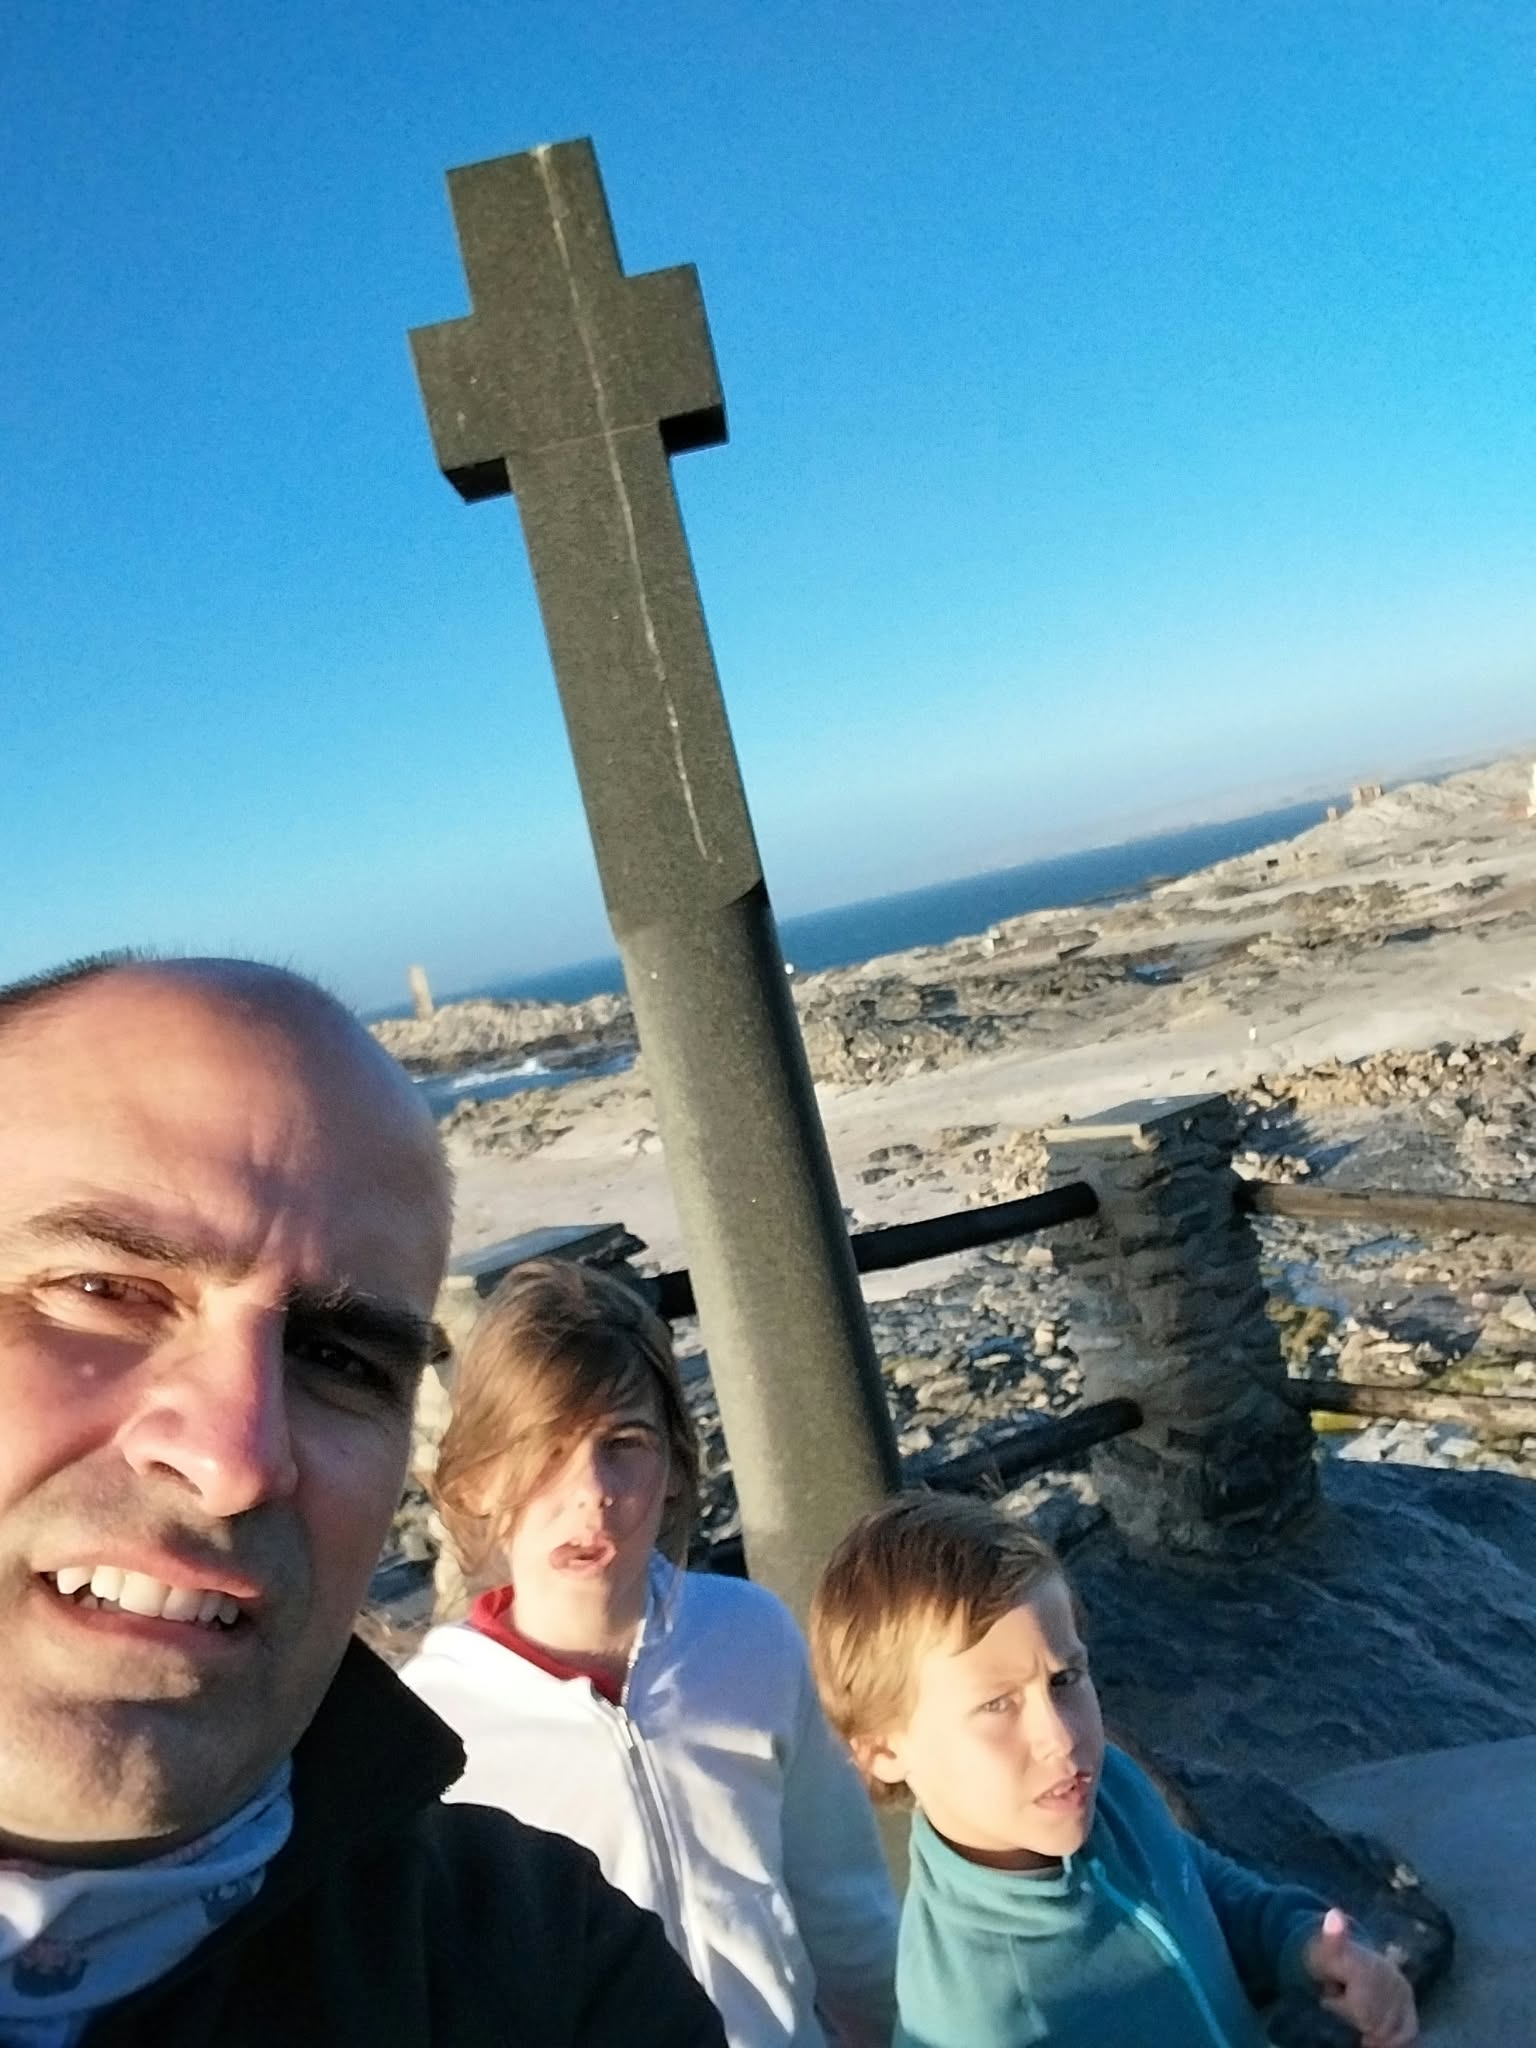
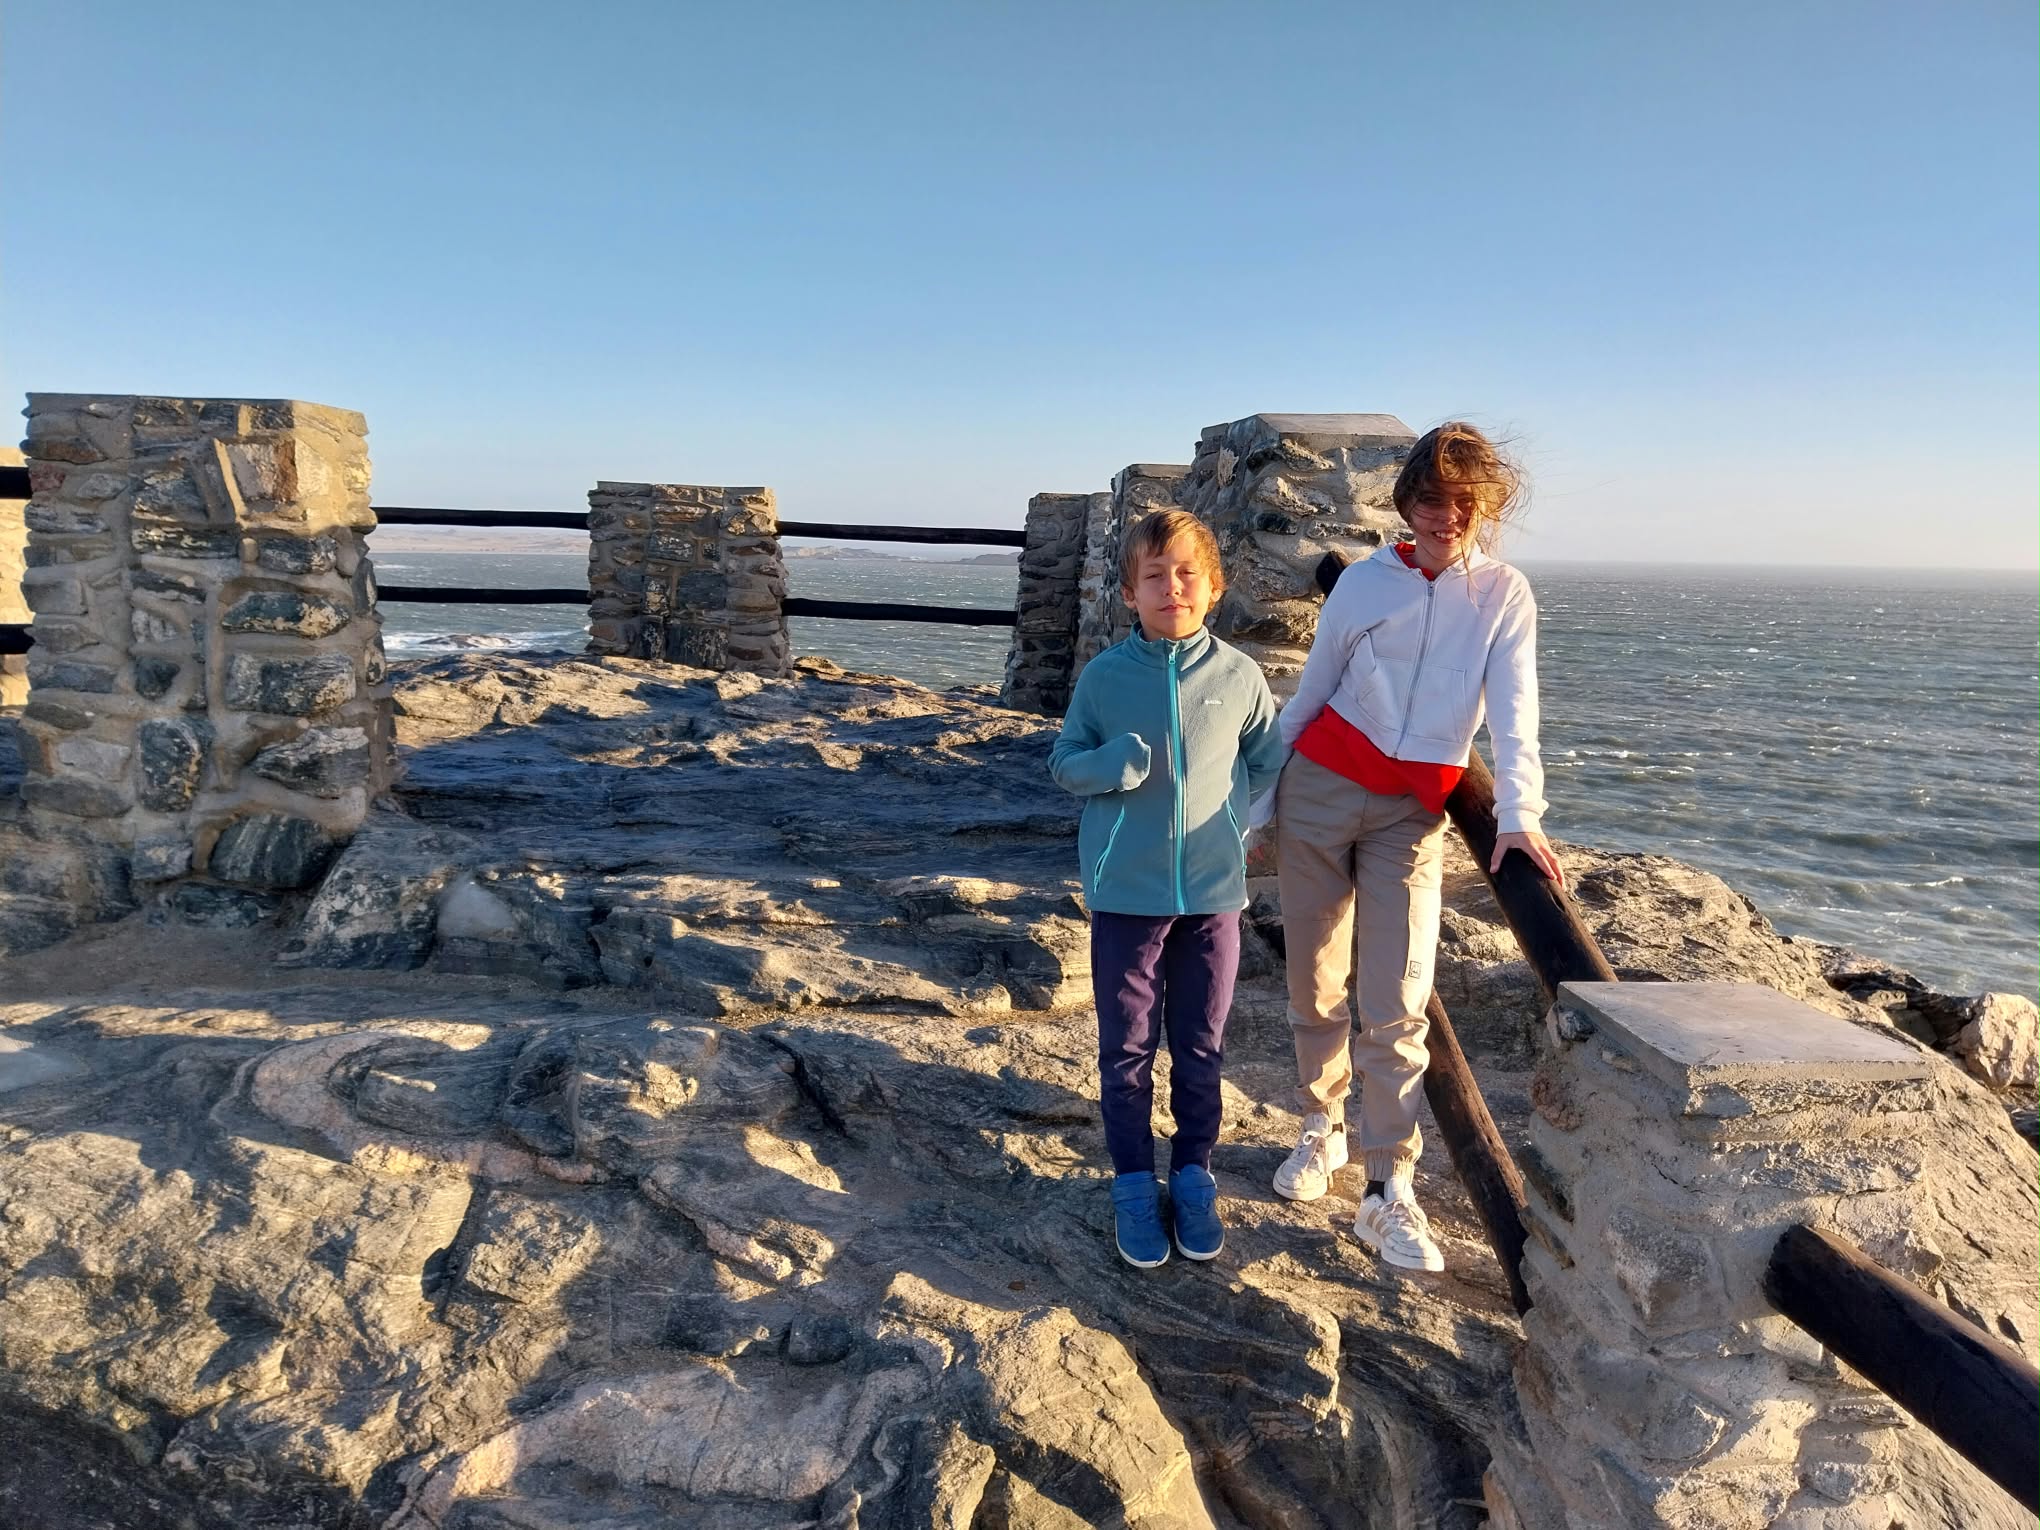
The information board at the site tells the story well: on 25 July 1488, on his way back to Lisbon, Dias was forced by strong headwinds to anchor in a bay he named Angra Pequena (26°38′ S, 15° E, today’s Lüderitz), where he raised a padrão dedicated to São Tiago (St. James). The original cross eroded away; in 1953 the historian Eric Axelson found fragments of it at Dias Point, and in 1988, for the 500th anniversary of the voyage, a replica sculpted from Namib dolerite was unveiled there.
Was Smith right? The Cape route in today’s trade
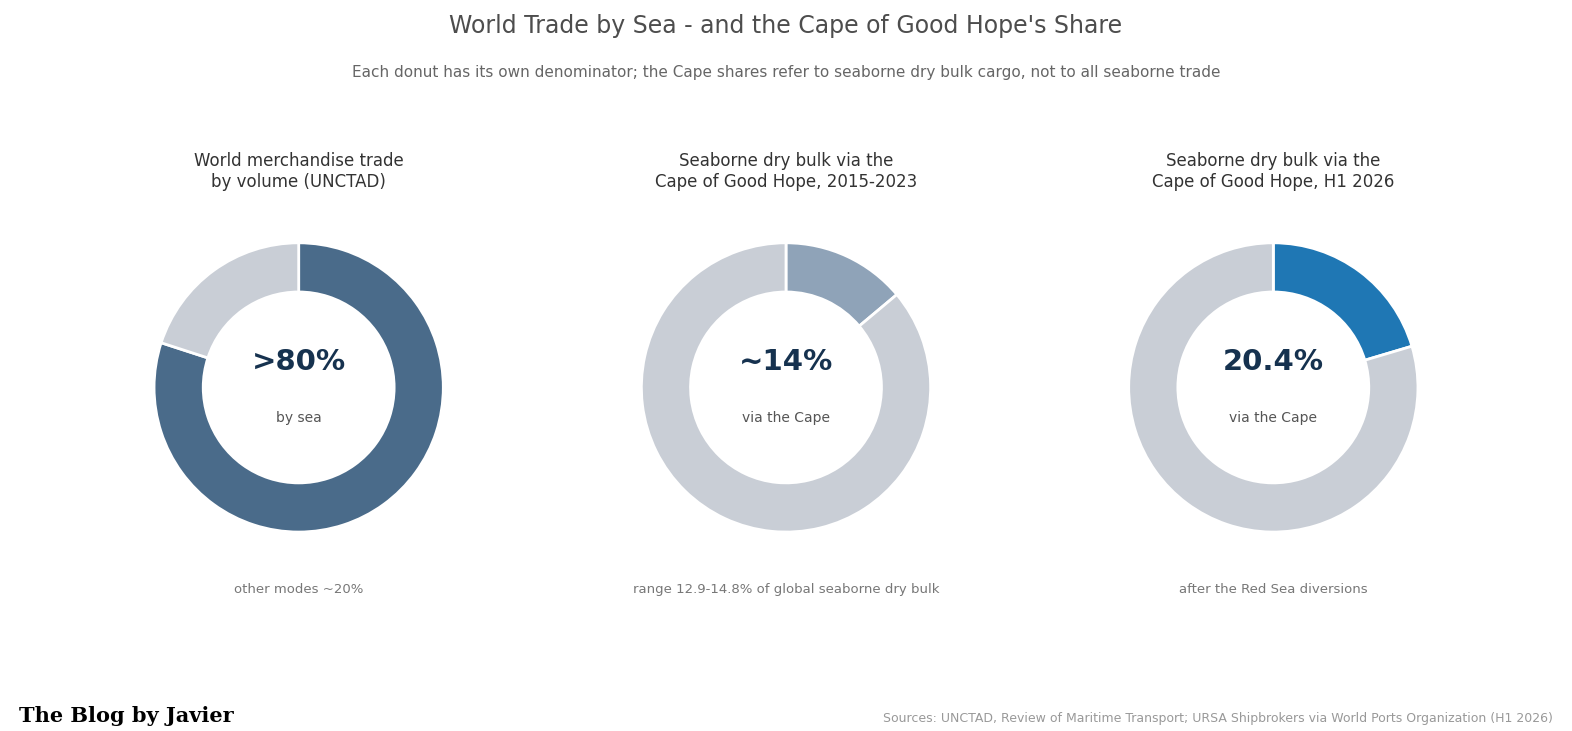
Let’s look at some data. Over 80% of world trade by volume moves by sea, according to UNCTAD. World merchandise exports were worth about $24.4 trillion in 2024 (WTO), against a world GDP of roughly $112 trillion in 2024 and some $118 trillion estimated for 2025 (IMF / World Bank). Air freight is marginal in volume, though significant in value.
And how much of that trade goes around the Cape of Good Hope?
- Between 2015 and 2023, some 12.9%-14.8% of global dry bulk cargo (iron ore, coal, grains) rounded the Cape each year, according to URSA Shipbrokers data. The Suez Canal, the northern alternative, carries about 12% of global trade and some 30% of container traffic: over $1 trillion of goods a year on around 50 ships a day.
- Since the Houthi attacks on Red Sea shipping started in late 2023, traffic diverted massively to the Cape: dry bulk cargo via the Cape rose to 19.1% of the global total in 2024 and 20.4% in the first half of 2026 (583.5 million tonnes out of about 2.86 billion).
- Oil flows around the Cape rose nearly 50% with the diversions: from an average of 5.9 million barrels per day in 2023 to 8.7 million barrels per day in January-May 2024 (EIA) (that is 6 to 8% of world oil production, see this previous post I wrote on 2025 world oil picture).
- Daily transits around the Cape averaged 42-56 ships per day in 2023 and 80-98 per day through 2025 and 2026 (86 in September 2026, the latest month available), on IMF PortWatch data: close to double the pre-crisis level.
- For a typical Asia-Europe voyage, going around the Cape adds some 3,000-3,500 nautical miles and 7-10 days (World Bank); for a tanker from the Arabian Sea to Europe, the EIA puts the extra time at about 15 days.
In dollar terms: it is hard to give a precise bake for the Cape specifically. Pre-crisis Suez traffic was often estimated at over $1 trillion in goods value per year. The diverted portion of that, plus structural Cape bulk, represents a large absolute value, though bulk commodities have lower value density than containers. Extra costs from diversions (fuel, time, higher freight rates, insurance) have been substantial—tens of billions in aggregate higher logistics costs in the peak disruption years—but the underlying cargo value itself is in the hundreds of billions to low trillions annually depending on the exact mix and period. Even $1 trillion is only around 1% of a $112 trillion world economy. The comparison is just an order of magnitude: GDP measures value added produced in a year, while trade figures count gross cross-border sales, partly double-counted along supply chains. But the key point stands: the route Dias opened 538 years ago remains the flexible open-sea alternative (no locks, no canal tolls) that keeps world trade moving when the northern chokepoints fail.
Capesize: the ships named after the cape
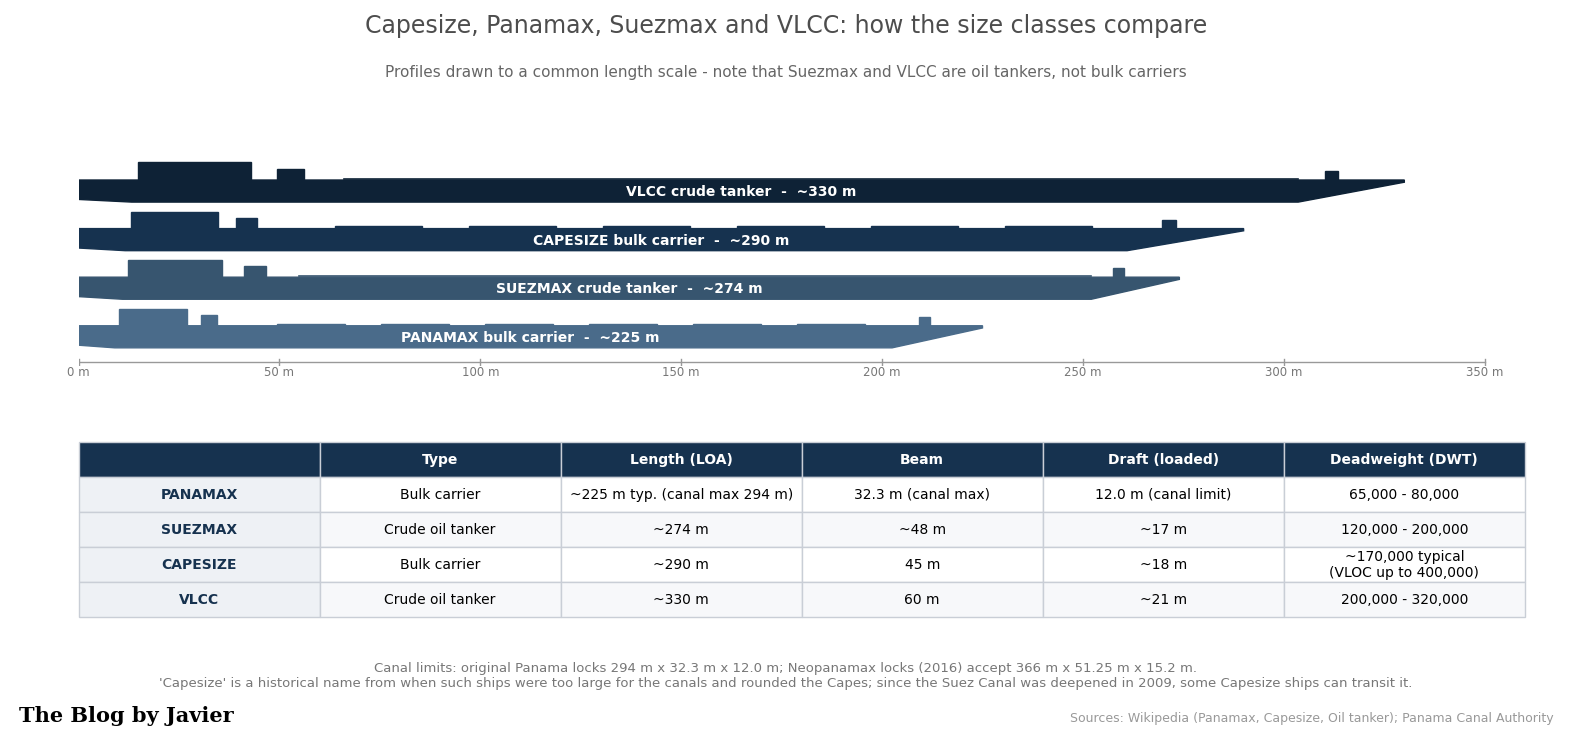
The Cape even gave its name to a whole class of ships. Capesize vessels are large dry bulk carriers of about 100,000-200,000+ deadweight tonnes (DWT), typically around 150,000-170,000: some 290 m long, 45 m of beam and 18 m of draft. They carry mostly coal, iron ore and other raw materials, and their size and deep draft mean that only the largest deep-water terminals can handle them. They were named for being too big for the canals: to move between oceans they had to go around the Cape of Good Hope (or Cape Horn). Since the Suez Canal was deepened in 2009, many Capesize ships can transit it, but the name stuck, and the Cape route remains their natural highway.
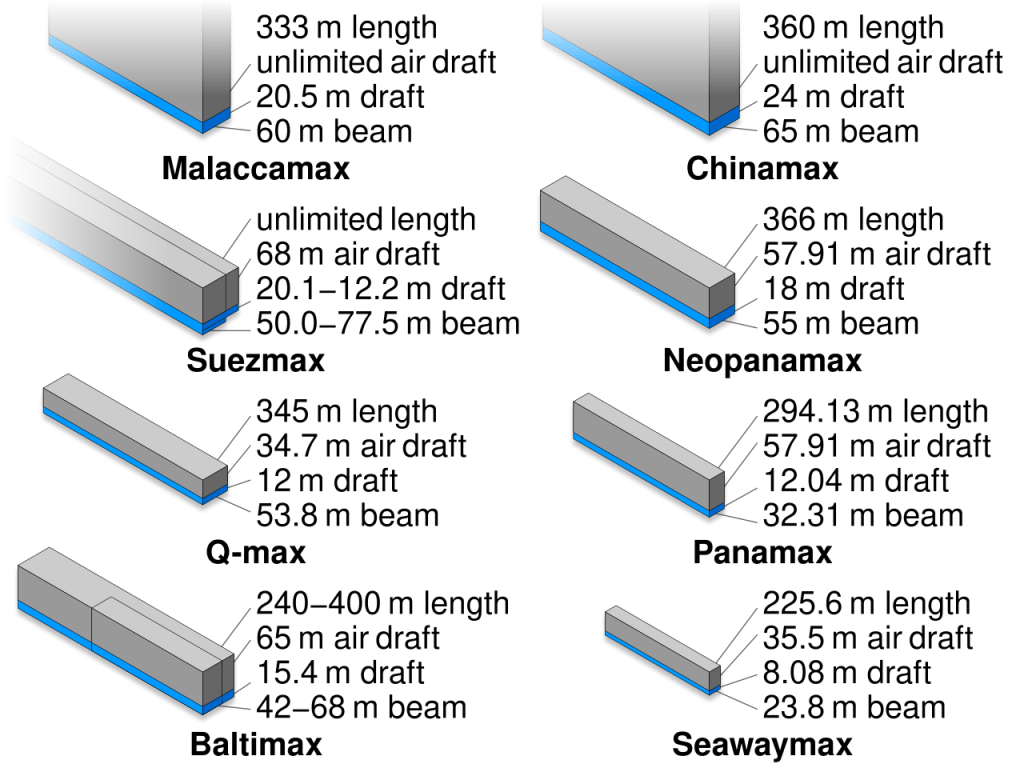
How do Capesize ships compare to other common ship classes?
| Class | Typical DWT | Main type | Key constraint / route note |
|---|---|---|---|
| Panamax | ~60-80k (up to ~120k Neopanamax) | Bulk / tanker | Sized to the Panama Canal locks |
| Suezmax | ~120-200k (typical ~160k) | Tanker | Largest tanker class transiting Suez fully laden |
| Capesize | ~100-200k+ (typical ~150-170k) | Dry bulk | Named for the Cape route; after the 2009 Suez deepening many can use the canal |
| Newcastlemax | ~185-210k | Dry bulk | Upper end of Capesize; sized to the Port of Newcastle (50 m beam) |
| VLCC | ~200-320k | Crude tanker | Very large crude carrier |
| Valemax / VLOC | ~380-400k | Ore carrier | Largest bulk carriers built; deep-water ore terminals only |
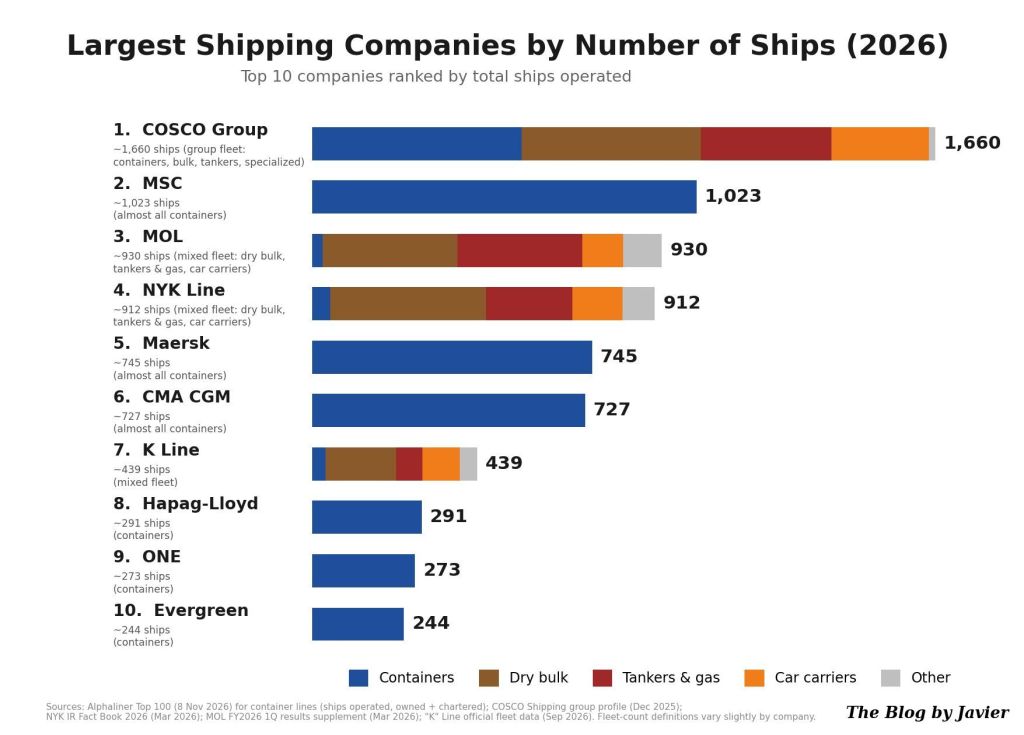
Which are the largest shipping companies in the world?
The ports that receive them
Capesize ships can only call at the largest deep-water terminals, and they usually carry iron ore, coal and other raw materials, so this trade is highly concentrated between a relatively small number of specialized ports. A few characteristic examples:
On the loading (export) side:
- Port Hedland (iron ore, Australia): one of the largest iron ore loading ports in the world and the largest in Australia. Newcastle (coal, Australia): the world’s largest coal export port, which gives its name to the Newcastlemax subclass.
On the discharge (import) side:
- The deep-water iron ore terminals of China, which takes over 70% of world seaborne iron ore imports.
Back to Adam Smith
In the quote I shortened Smith’s sentence to “No human wisdom can foresee the benefits”. In the book, the full sentence reads: “What benefits or what misfortunes to mankind may hereafter result from those great events, no human wisdom can foresee”, and Smith himself stressed that for the natives of the East and West Indies the commercial benefits had been “sunk and lost in the dreadful misfortunes” those events occasioned.
Ten years after Dias, Vasco da Gama reached India using his route and his know-how. More than five centuries later, around ninety ships a day round the Cape of Good Hope keeping the world economy supplied, and whole classes of ships and port networks exist because of that passage. Dias received little recognition in his lifetime and died at sea next to the cape he had opened. Not a bad legacy for a “Cape of Storms”.
Sources and further reading
- Adam Smith, The Wealth of Nations, Book IV, Chapter VII (Adam Smith Works).
- Bartolomeu Dias (Wikipedia), History.com and South African History Online.
- UNCTAD, Review of Maritime Transport 2024 (over 80% of world trade volume by sea).
- WTO, Global Trade Outlook 2025 (merchandise exports of $24.43 trillion in 2024).
- IMF World Economic Outlook and World Bank (world GDP: about $111.6 trillion in 2024, ~$118 trillion in 2025).
- World Ports Organization / URSA Shipbrokers (dry bulk via the Cape: 12.9%-14.8% in 2015-2023, 19.1% in 2024, 20.4% in H1 2026).
- U.S. EIA, “Red Sea disruptions increase oil flows around Cape of Good Hope” (June 2024: 5.9 to 8.7 million b/d, about 15 extra days Arabian Sea-Europe).
- World Bank blog (diversion adds 3,000-3,500 nautical miles and 7-10 days Asia-Europe).
- IMF PortWatch data via Red Sea Meridian corridor watch (monthly averages of daily transits around the Cape, through September 2026; accessed November 2026).
- New Zealand MFAT (Suez: about 12% of global trade, ~30% of containers, over $1 trillion a year).
- Ship classes and canal limits: Capesize, Suezmax and Valemax (Wikipedia), Seafarer Index (Newcastlemax).
- Infrastructure Australia (Port Hedland and Newcastle: world’s largest iron ore and coal export hubs) and Reuters (China buys over 70% of seaborne iron ore).
- Capesize, Port of Port Hedland and Port of Newcastle (Wikipedia), plus Pilbara Ports Authority (ship classes, deep-water terminals, port rankings). Reuters (China takes over 70% of world seaborne iron ore imports).
Note: figures come from the sources listed above; where estimates differ between sources or years, I give the ranges.


