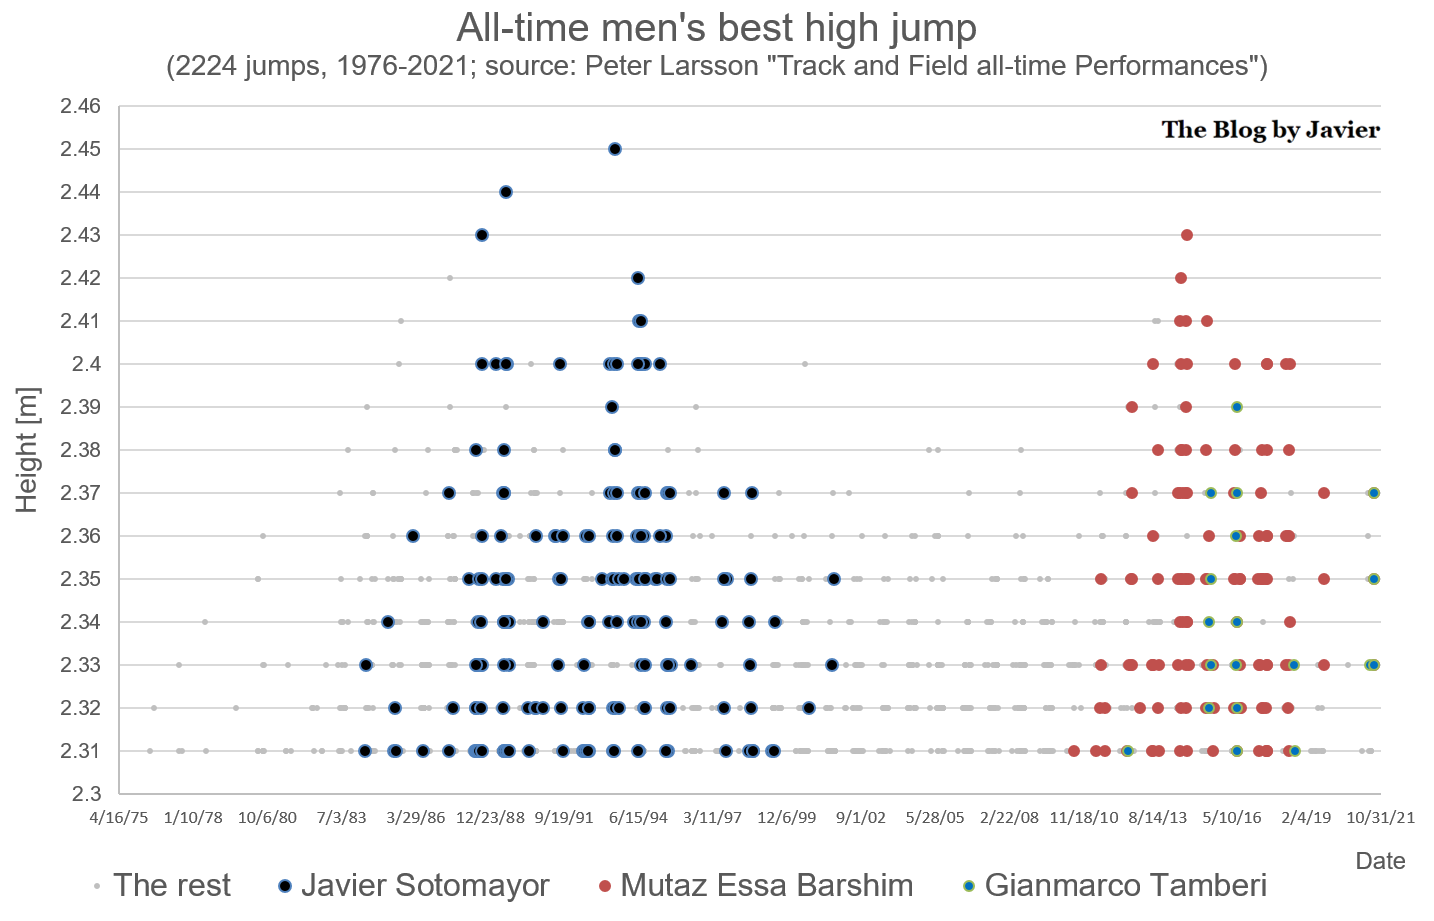
I heard about the modern Athens Classic Marathon from Antonio, a colleague at the office. Ever since, I had wanted to take part in it. Last week, two friends (Jose and Juan), my brother and I completed it.
In a previous post I wrote about the legend of Pheidippides and the origin of the modern marathon. In this post I will focus on my experience and will share some of the pictures that we took during this trip.
Training
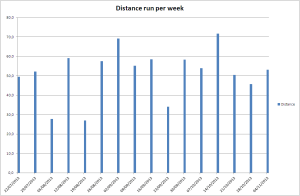
Volume of kilometres run per week.
To prepare for this marathon I followed a 16-week training plan provided by Garmin (Level II). Each week it included between 4 and 5 days of running and often 1 day of cross-training. I fulfilled most of the plan, missing not more than two or three days of running and some more of cross-training. I did not skip any series session or long run. In all, I ran over 780km in those weeks, excluding the 42km of the race (an average of just over 50km per week).
During this training season I beat my 10k and half marathon personal records. I had not experienced any serious injury that prevented me from training during whole weeks or months as it had been the case in previous years. According to a running calculator that I use sometimes, had the race been in similar conditions as those 10k and half, I should have been around 3h30′. The profile and conditions were not the same, and despite of that I started with a pace towards 3h30′ just to see how far would I reach maintaining it and if I could be under 3h45′, thus achieving a new PR.
The day before the race we went to the marathon expo which was held at the Taekwondo pavillion of the 2004 Olympic Games held in Athens. This way we also visited the beautiful small port at Piraeus close to Faros (just past the Stadio Eirinis & Filias, where Olympiakos bastketball team plays).
At the marathon expo.
Before the race

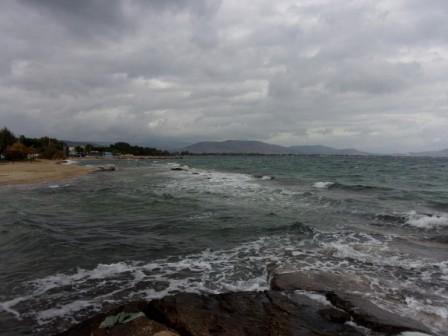
Marathon beach.
As I mentioned in the previous post, the race goes from the village of Marathon to Athens, replicating the route followed by Pheidippides to announce the victory of Athens in the Battle of Marathon. The Persians landed at the bay of Marathon in their attempt of invading Attica, thus Marathon is almost at sea level.
From Marathon, the race goes South more or less parallel to the sea-line for about 17 kilometres and then heads to the West to climb up the hills before the valley where the city of Athens is located.

Route of the Athens Classic Marathon.
The last part of the race is a descent from the hills to the centre of Athens where the Panathinaiko stadium is located. But by then, the damage is already done to the legs after a long climb.
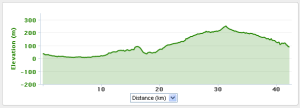
Profile of the Athens Classic Marathon.
The morning of the race, we were transported from Syntagma square to Marathon by dozens of buses early in the morning to be able to start at 9:00. Everything ran smoothly (in that and many other aspects the organization of the race was superb).
We changed clothes in Marathon, where we could take some pictures, go to the toilet, warm up and slowly get into the racing mindset.

WC panoramic view (at Marathon, picture by Jose).
We took one group picture and set for the departing line.
Pre-race group picture.
The week following to the race I went back to Marathon to visit the place with time and see the different spots (some of the pictures in the post are from those other days).
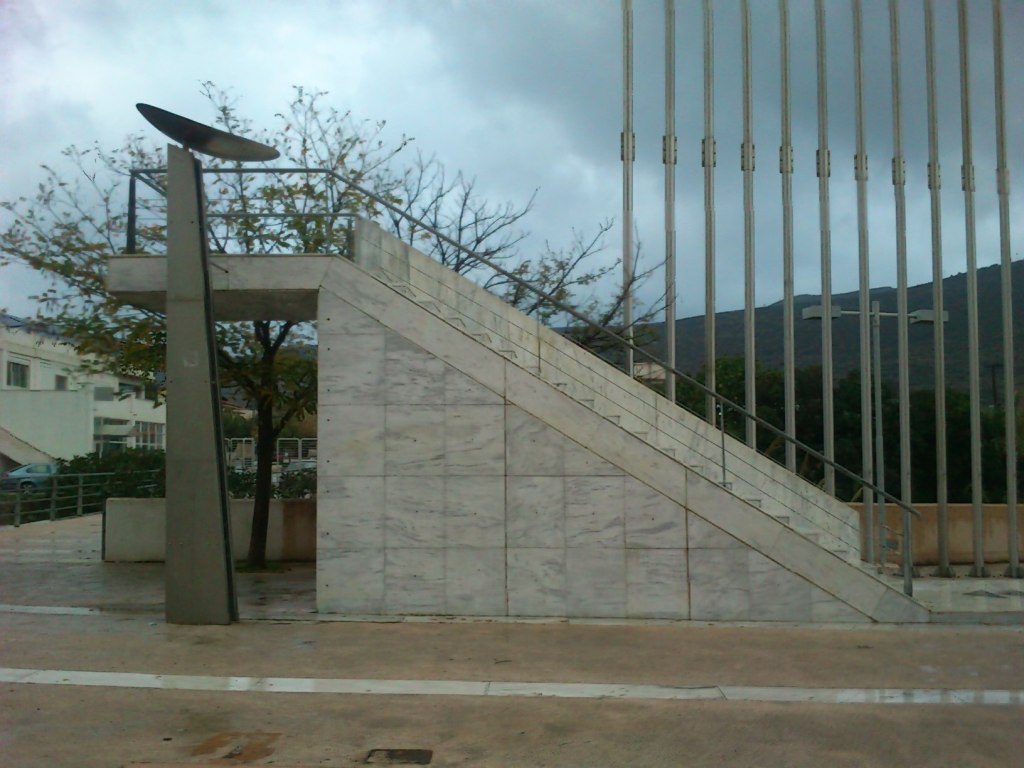
In the village of Marathon there is a small athletics stadium at the end of the national road from Athens to Marathon.
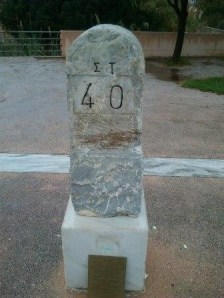
The 1896 Olympic marathon race started at “… the brigde at Marathon Plain”, or “… at the bridge near the entrance of the sacred city”, according to “Olympic Games 776 B.C. – 1896” by A. K. Bech, or “… The starting point will be at the 40th stadion on the Marathon – Athens national road”, according to the Athens daily “Olympia” on March 9, 1896 (as can be read in the milestone below). That point, the “40th stadion” of that national road, is marked by the milestone below.
Today, the Athens Classic Marathon starts a bit ahead at the mid-point of what is now a kind of majestic avenue at the beginning of which one can find a marble stone indicating the starting point of the olympic race, a milestone indicating that 40th stadion, and the tower where the Marathon Flame is lit after being brought from the Marathon Tomb (just 5km away).
1896 Athens marathon start
40th stadion milestone

Marathon flame tower.

2013 Boston marathon memorial bracelet.
Just before the race start we observed 1 minute of silence for the victims of the attack at the Boston marathon earlier this year. This minute counted with the presence of president of the Boston Athletics Association. That was the 3rd such minute I had observed as during my honeymoon trip I had taken part in two races in the USA, in San Francisco and San Diego, from which I got the memorial bracelet that I wear often lately.
The race
At 9:03 our group departed and there we went my brother and I trying to pace ourselves at a bit less than 5′ per km. That was comfortable for the flat part at the beginning. Another positive point of that beginning: with less than 10,000 runners taking part the running was possible from the start.

Milestone of the km 1 of the Athens Classic Marathon Course.
The course of the marathon race is marked, not only by ad-hoc signals for the race, but by permanent posts along the road, such as the one of the picture for the first kilometre.
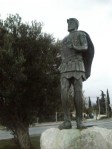
At about the km. 5 the course takes a small detour from the national road to round the commonly known as Marathon Tomb, or Marathon Tumulus, a park with a small hill where each year the Marathon flame is lit. Close to the park entrance, there is a small statue of Miltiades, credited as the one devising the tactics to defeat the Persians at the Battle of Marathon.
-

-
Marathon Tumulus
-
-
Miltiades
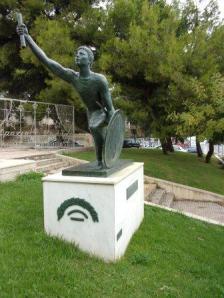
Statue of Pheidippides km. 18.
At the return from the tomb, already 6km had been passed. The road continued to be flat until about the 11th km, where the road started to pick up until km. 16, where there is a short and steep descent up until km. 17.
At the km. 18, there is a small statue of the legendary Pheidippides. From then on the road continues to climb more or less continuously until km. 31.
Up until the 20th km I was still at the pace of 3h30′, but in the beginning of the climb I was already feeling that it was going to be very tough to run kms at below 5’50”.
I have checked the Garmin records afterwards and I had already surpassed 167bpm at some points by the km 20th, which experience tells me that is the barrier that makes me feel fatigued.
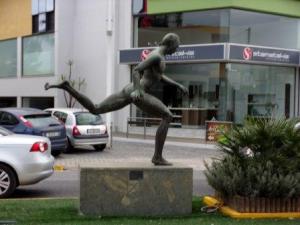
Statue of a runner at km. 21.
During the race, not having read about heart rate, just by the feelings I had I decided to forget about the time and continue the climb at a more comfortable pace. With that, the 3h30 and the sub 3h45′ were gone. In the end I completed the race in 3h53’18”, but the profile nor the day (temperatures from 14ºC to 21ºC, on the hot end) were the best to attempt a PR.
At the km. 21 there is another statue of an anonymous runner.
I crossed the half marathon at slightly over 1h47′, but knowing that the following 10km would take about a full hour and not knowing how I would be for the remainder 11km.
The heat of the day called for lots of hydration, and at that point the organization was again terrific, with water posts every 2.5km and with isotonic drinks in most of the posts, plus energetic gels in some of them.
One hour later, and having reached the top of the hill I remembered the sentence one of us had read describing the race “from km. 31 you can fly down to the end”. Well, I was not fit for flying. When I tried to speed up I felt muscles starting to cramp, thus I couldn’t run any faster than 5’45”, which I tried to keep, drinking and eating well at each supply post.

Panathinaiko stadium from Acropolis.
Once in the centre of Athens, there were still some 3-4 kilometres to cover. I kept myself just for the last kilometre where the atmosphere close to the stadium was great, starting with the descent by Irodou Attikou street.
The last turn to the left, climbing up the ramps to enter the Panathinaiko and covering the last meters inside the stadium was overwhelming. One of the best marathon endings I can recall.
See in the panoramic below a view of how the stadium looked that day.
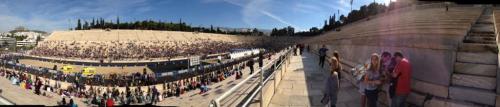
Panathinaiko stadium panoramic view (picture by Jose).
I remembered then when I first visited Athens back in 2002. That time, we visited the stadium and took some pictures as if running in those tracks. Now, 11 years later, there was I, sprinting to complete the Athens Classic Marathon (my 10th), where it all began, no less.

2013 Athens marathon medal
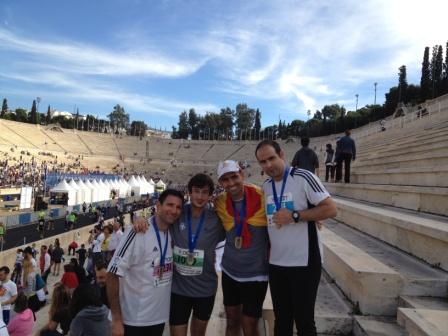
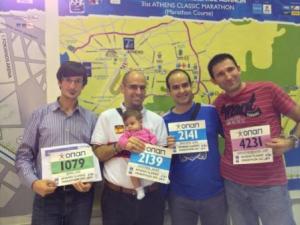
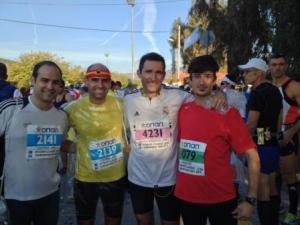
Post-race group picture with a great marathon team! Juan, Jose, me and Jaime.