Let me introduce the learning curve effect by quoting directly from the Wikipedia:
“The rule used for representing the learning curve effect states that the more times a task has been performed, the less time will be required on each subsequent iteration. This relationship was probably first quantified in 1936 at Wright-Patterson Air Force Base in the United States, where it was determined that every time total aircraft production doubled, the required labour time decreased by 10 to 15 percent.” […]
“Learning curve theory states that as the quantity of items produced doubles, costs decrease at a predictable rate.”
I used the concept of learning curve in a blog post in which I discussed whether and when the Boeing 787 would break even. In that post I referred to Boeing’s target of reaching a 75% learning curve on the 787 program, much more difficult to reach than the 84% that Boeing reportedly achieved in the 777 program.
Why is a curve of 75% more difficult to achieve than a 84% curve? The meaning of the figure “84%” attached to the learning curve is that each time that the number of units produced is doubled, the cost is reduced in 16%, or the 2*nth unit cost is 84% of the unit cost of the nth unit. Thus, a 75% curve would imply that the cost is reduced in 25%, which is a higher cost reduction than 16%, and, thus, more difficult to achieve.
On the other hand, NASA, in its Learning Curve Calculator, offers some guidance on learning curves for different industries and mixes of hand labor and machining work:
- Aerospace 85%
- Shipbuilding 80-85%
- Complex machine tools for new models 75-85%
- Repetitive electronics manufacturing 90-95%
- Repetitive machining or punch-press operations 90-95%
- repetitive electrical operations 75-85%
- Repetitive welding operations 90%
- Raw materials 93-96%
- Purchased Parts 85-88%
How is the concept of learning curve calculated? (from Wikipedia: )
Now the equation for the unit curve is given by:

where
- K is the number of direct labour hours to produce the first unit
- Yx is the number of direct labour hours to produce the xth unit
- x is the unit number
- b is the learning percentage (expressed as a decimal)
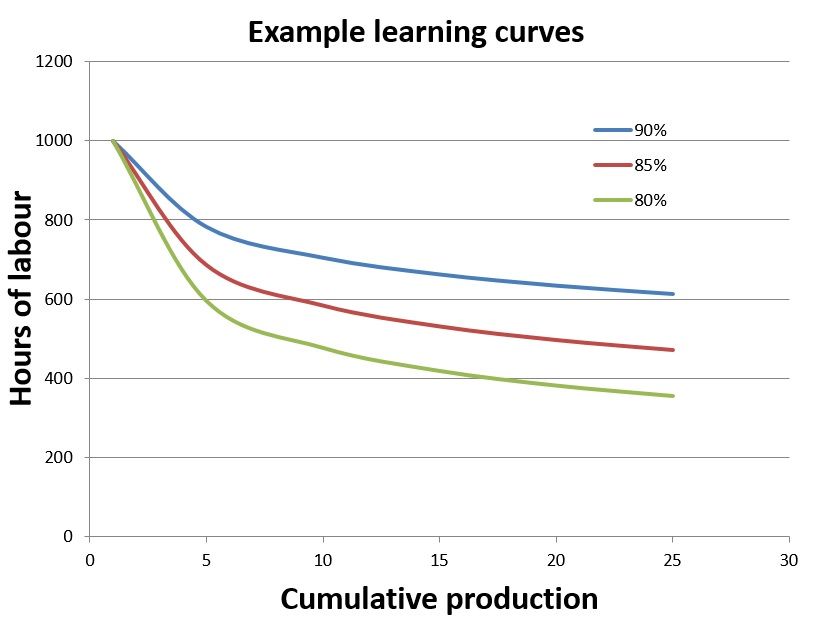
How does a learning curve look like? (from Wikipedia) Actual examples of curves in both linear and logarithmic scales would be:
The concept of learning curve is indeed used in aerospace, however, coming back to the 787 program, Boeing does not disclose outright what is the actual learning curve it is achieving in its program. Nevertheless, in its investor relations conferences it provides information here and there of cost savings achieved, etc. This can be interpreted as derived from learning curve effects, and would permit to build a model, even if based on scarce information.
See some of the hints that Boeing provides:
“We continue to see progress in key operational performance indicators and unit costs, as we further implement production efficiencies and stabilize the overall production system on the 787 program. Unit cost has improved approximately 20% over the past year on the 787-8 […]”, Greg Smith, Boeing EVP – CFO at Q4 2013 Earnings Conference.
“[…] as we continue to make improvements 787 unit cost […]”, Greg Smith, Boeing EVP – CFO at Q4 2013 Earnings Conference.
“when you look at flow-time, you look at unit cost at Charleston whether it’s final, mid, or (aft) it made great progress there. And the team has been very focused on continuing that progress going forward. We have experienced a higher number of jobs behind schedule in the mid-body section, and that’s really due to, if you think about it, you are introducing the Dash-9 at the same time going to 10 a month. […], we’ve applied additional resources. We know how to do this and we’ll get those jobs back to what we view as a more acceptable level. So we got mitigation plans.” Greg Smith, Boeing EVP – CFO at Q4 2013 Earnings Conference.
“This morning we announced plans to increase 787 production beyond the 10 per month we’re on track to achieve this year to 12 per month in 2016 and then 14 per month, before the end of the decade. […], capture productivity and learning improved profitability […]” Jim McNerney, Boeing Chairman, President and CEO at Q3 2013 Earnings Conference.
“We’ve added another line or sorry, a position within the line, where we’re doing the wing, body joint earlier in the process and this is through experience after 134 airplanes, the teams are really coming up with better ideas or improvements on how to increase flow and that’s going to require some upfront investment. But obviously in the units to come after we’ll see that improvement again in flow and productivity.” Greg Smith, Boeing EVP – CFO at Q3 2013 Earnings Conference.
“[…] the flow time reductions, we’ve had in our factories, the hours per unit, the productivity per whatever are increasing significantly on all of our programs.” Jim McNerney, Boeing Chairman, President and CEO at Q3 2013 Earnings Conference.