
In March 2024 I wrote a quick post comparing the market capitalizations of Airbus and Boeing, when I realized that Airbus had overtaken Boeing. That post compared two snapshots in time: end of 2012 and March 2024. This post shows the figures for the complete period of time since the launch of the A320neo, on December 1st, 2010, until the end of October 2026: weekly stock prices, shares outstanding, the dollar-euro exchange rate, and the resulting market capitalizations in US dollars.
Methodology in short: weekly averages of daily closing prices (Friday-ending weeks), Airbus in euros at Euronext Paris (AIR.PA), Boeing in dollars at NYSE (BA), and the FRED DEXUSEU dollar-per-euro rate. Market capitalization each week is price times shares outstanding (times the exchange rate for Airbus). Shares outstanding are forward-filled from reported figures, so early years are approximate. Sources are listed at the end.
Stock prices
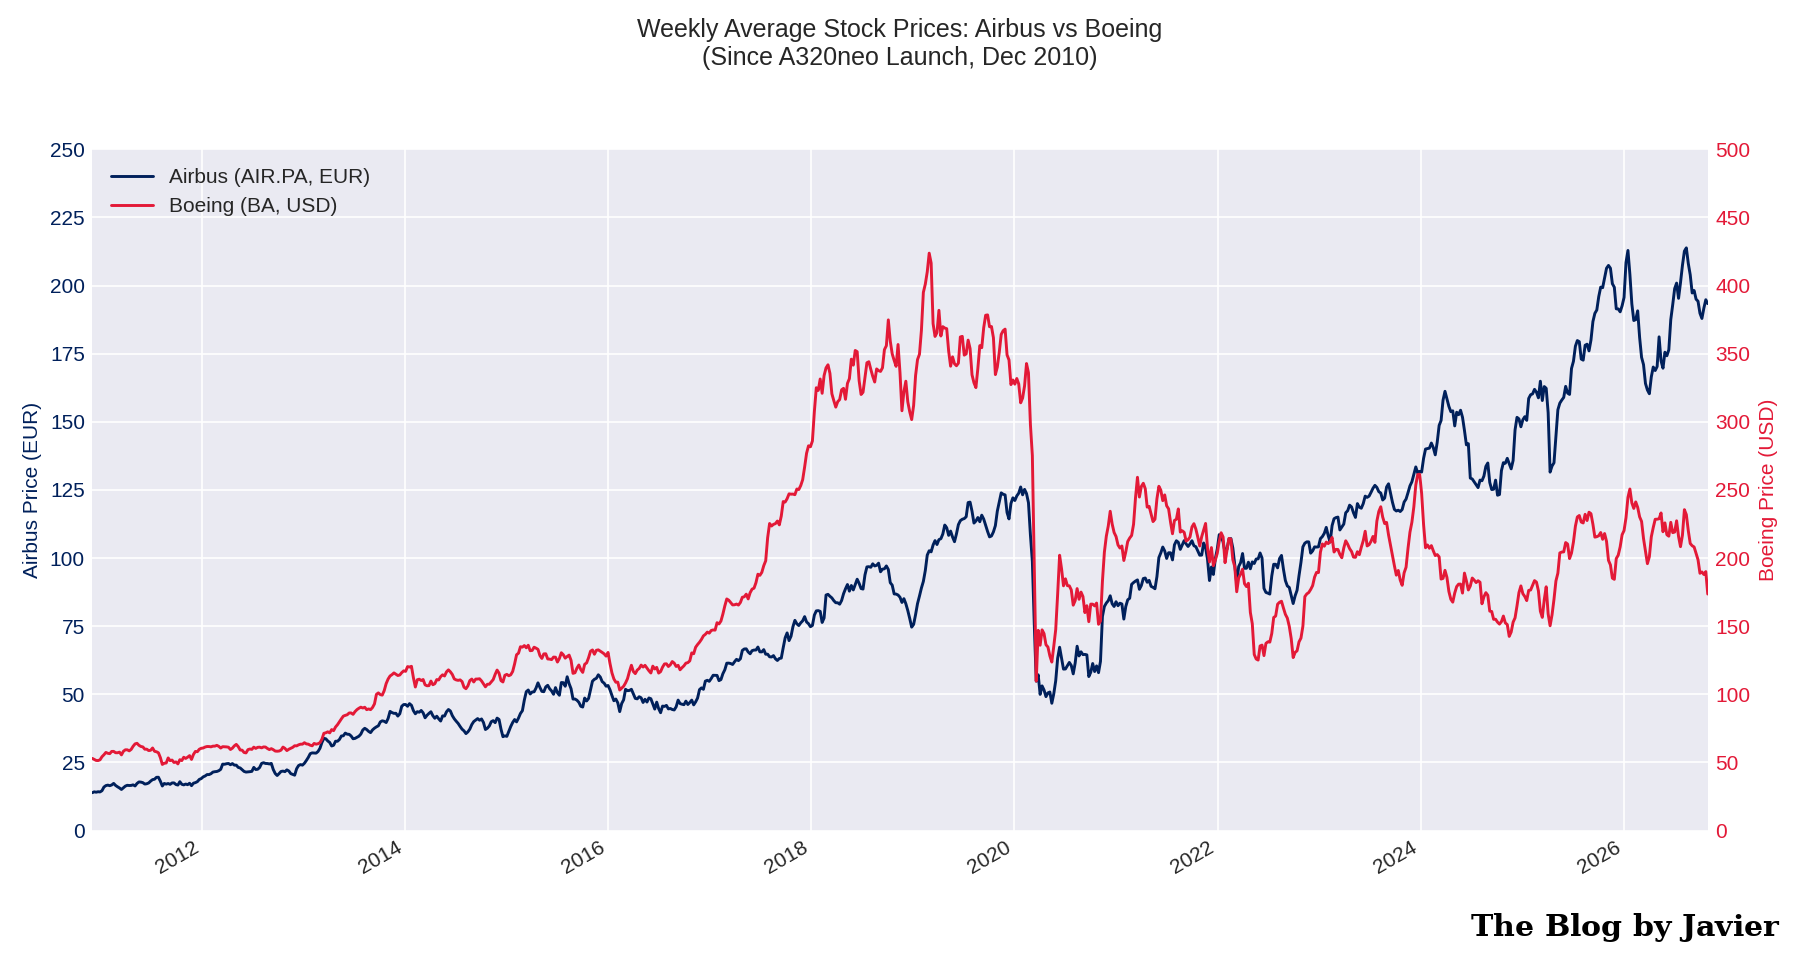
Airbus went from ~13.9€ in early December 2010 to ~193€ at the end of October 2026: multiplied by 14 (~18% compounded annual growth rate).
Boeing went from ~$53 to ~$174: multiplied by 3.3 (~7.8% CAGR).
Boeing peaked above $400 in early 2019, just before the 737 MAX grounding, and has never recovered those levels. Airbus suffered a milder COVID dip and resumed climbing to record levels above 200€ in 2026.
Shares outstanding
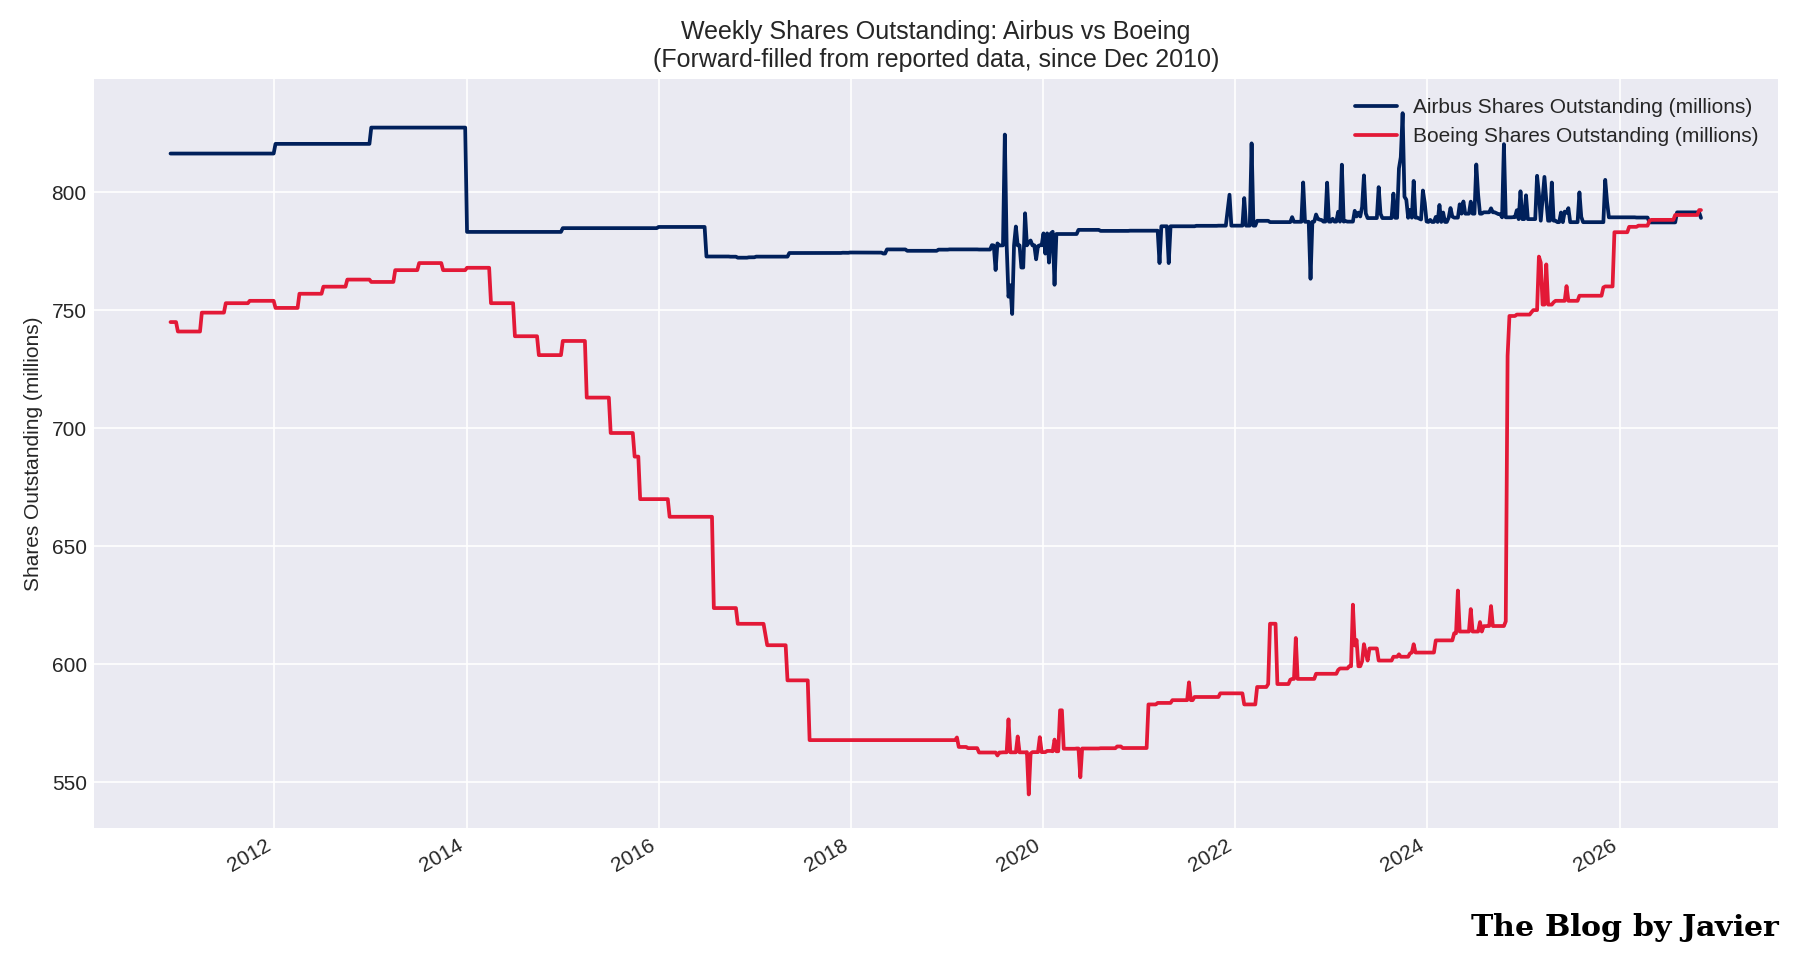
Two opposite stories.
- Airbus kept its share count roughly flat: ~816 million in late 2010, ~791 million today.
- Boeing went from ~745 million down to ~545 million by November 2019 through share buybacks, and then back up to ~792 million after the capital raises of the last years. Boeing has today more shares outstanding than when the period started. More on this below.
Dollar-euro exchange rate
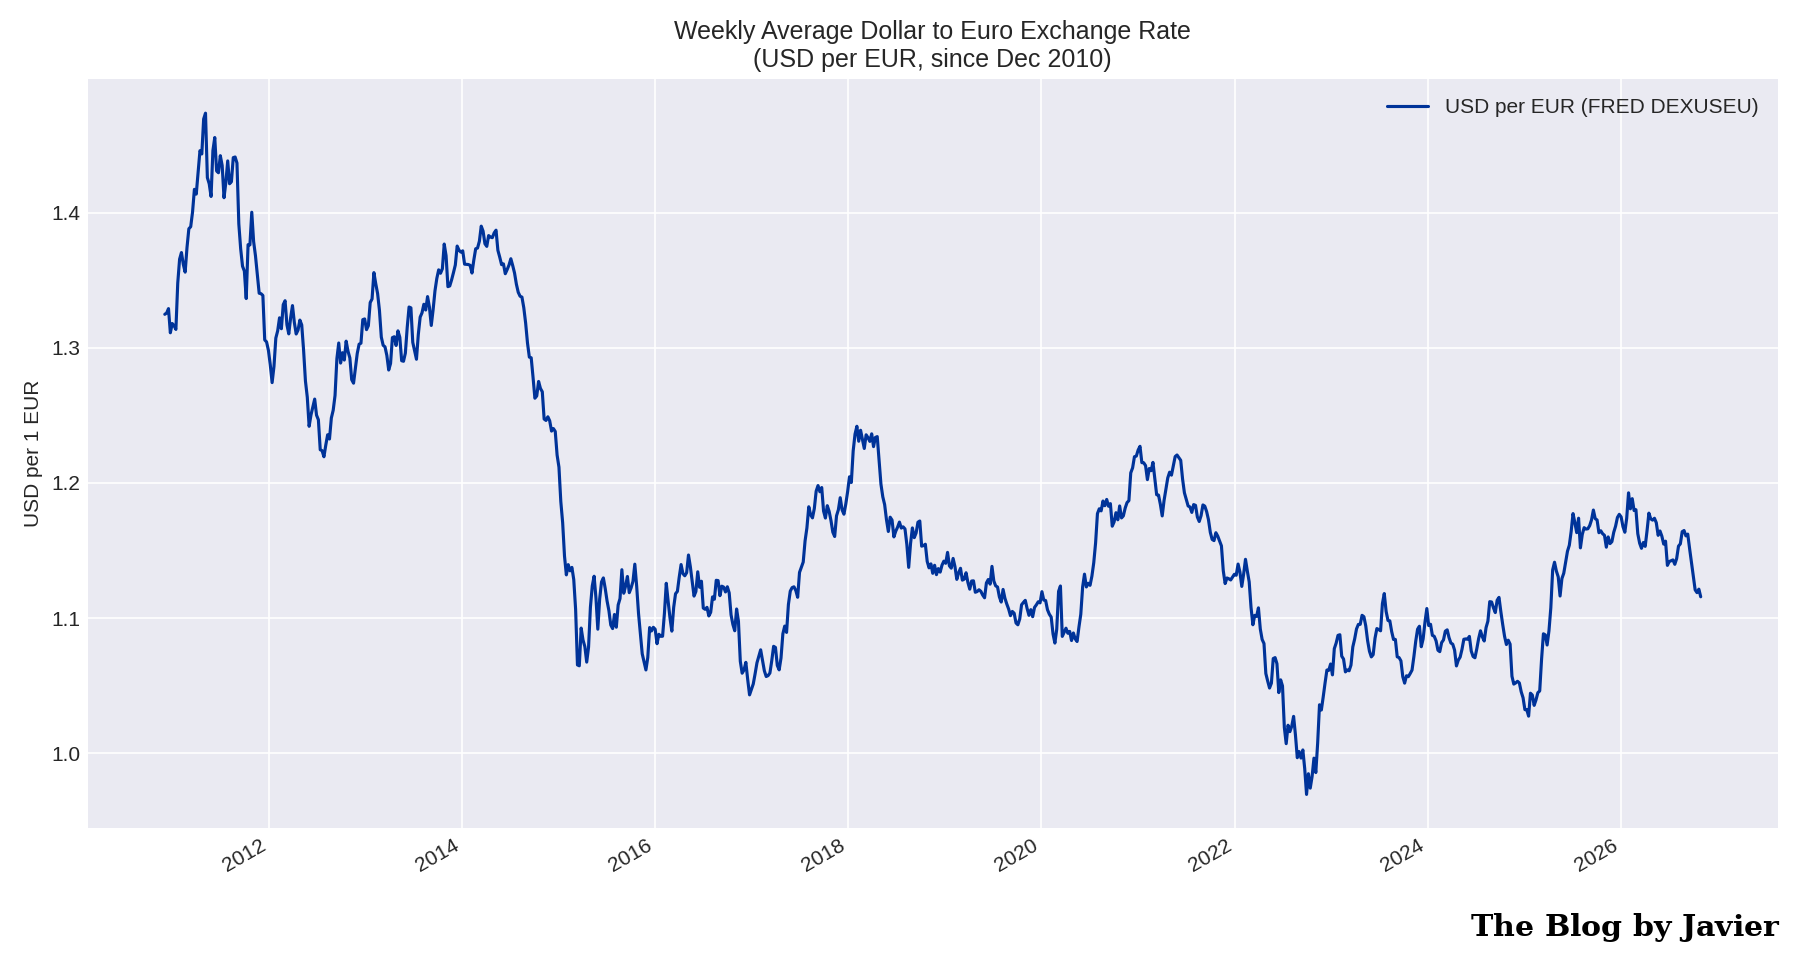
The euro went from ~1.32 dollars in December 2010 to ~1.12 at the end of October 2026, with a dip below parity in 2022. As Airbus reports in euros, the weaker euro weighs on the comparison in dollars: at a constant 2010 exchange rate, Airbus’ market capitalization in dollars would be about 15% higher than shown.
Market capitalization in US dollars
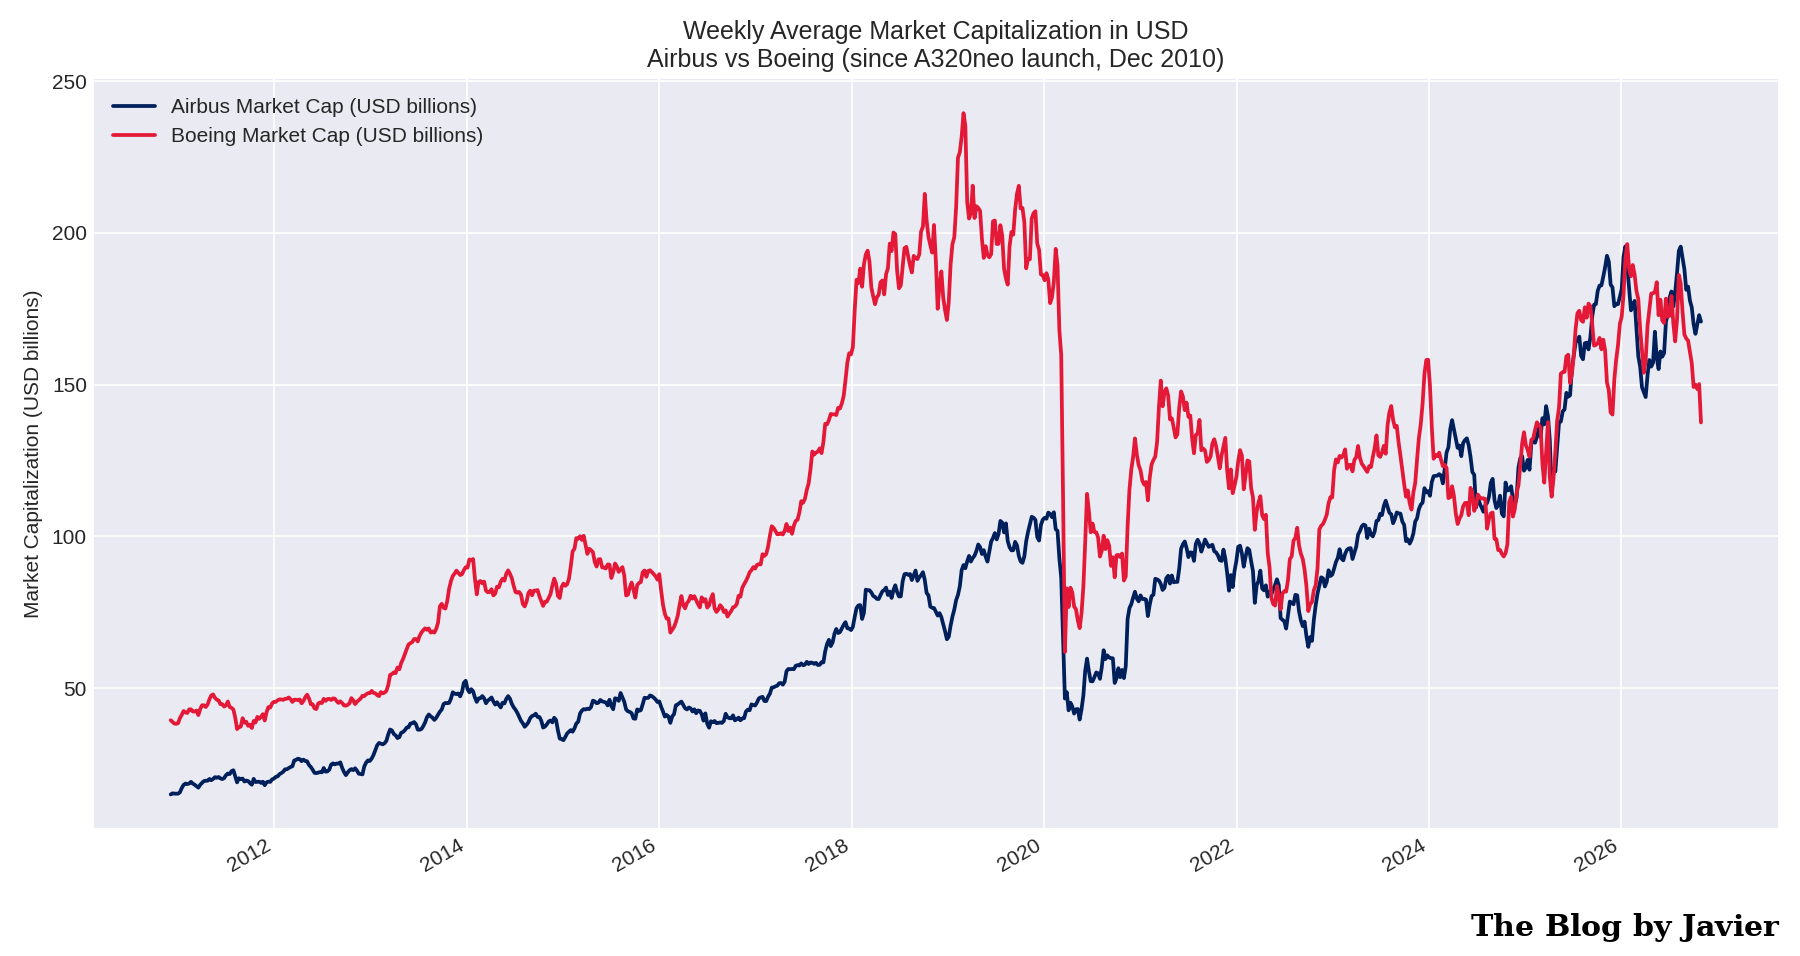
This is the chart that puts it all together.
- In early December 2010 Boeing’s market cap was ~$39bn versus ~$15bn for Airbus: Boeing was 2.6 times bigger.
- Boeing peaked at ~$239bn in March 2019, weeks before the MAX grounding.
- The first weekly close with Airbus above Boeing came in May 2022, and Airbus has been continuously ahead since late June 2026.
- On 30 October 2026 Airbus stood at ~$171bn versus ~$138bn for Boeing, about 24% higher.
- Averaged over the whole 16-year period Boeing was still the bigger company (~$113bn vs ~$75bn), which gives a sense of how large Boeing’s historical advantage was and how remarkable the reversal is.
Boeing share repurchases and dilution
As a final note of the 2024 post I left a link to a Leeham News and Analysis article with a contrarian view of Boeing’s stock buybacks. Its table of the 2013-2019 repurchase program is worth keeping here, now with the full historical context:
| Year | Shares repurchased (millions) | Value ($bn) |
|---|---|---|
| 2013 | 25.4 | 2.8 |
| 2014 | 46.6 | 6.0 |
| 2015 | 46.7 | 6.8 |
| 2016 | 55.1 | 7.0 |
| 2017 | 46.1 | 9.2 |
| 2018 | 26.1 | 9.0 |
| 2019 | 6.9 | 2.7 |
| Total | 252.9 | 43.5 |
The buybacks cut Boeing’s share count from ~745 million in 2010 to ~545 million by November 2019. Then came the 737 MAX grounding, the pandemic, the debt pile-up, and in October 2024, in the middle of a machinists’ strike, Boeing issued 129.4 million new shares at $143 (raising ~$18.2bn) plus $5bn of mandatory convertible preferred shares, as detailed in its SEC filings. The result: ~792 million shares outstanding today, more than before the buybacks began. The reduction that $43.5bn bought has been fully reversed, and then some.
Data sources
- Stock prices: Yahoo Finance (AIR.PA and BA), daily closes averaged to Friday-ending weeks.
- Shares outstanding: company-reported figures and yfinance, forward-filled to weekly frequency (approximate before ~2015).
- Exchange rate: FRED DEXUSEU, US dollars to one euro, weekly average.
- Boeing repurchase table: Leeham News and Analysis, “Pontifications: A contrarian view of Stock Buybacks” (April 2023).
- Boeing October 2024 share offering: Form 8-K, 30 October 2024 and prospectus supplement.
- Previous post: Airbus vs Boeing; market capitalization (March 2024).
- Data through the week ending 30 October 2026.


