Last week, on the first day of Farnborough air show, Boeing Commercial published its yearly update of the Current Market Outlook (CMO) for the next 20 years of commercial aircraft market (2016-2035).
I have just compared the figures for passenger aircraft of the last two years’ CMOs:
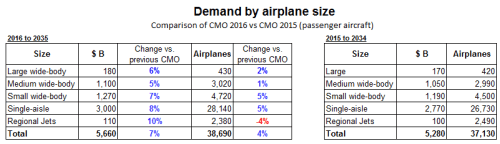
CMO 2016 vs. 2015 comparison.
Some comments to it:
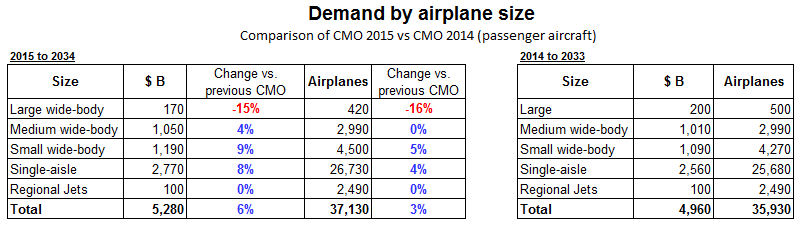
- You can see that the total number of new aircraft delivered has slightly increased from 37,130 to 38,690, a 4.2%, which is consistent with the 4.8% traffic increase (1) that Boeing predicts (2).
- The volume (Bn$) increases by a larger percentage, 7.2% (380Bn$) up to 5.66 Trn$… this is due mainly to the increase in (3):
- single-aisle aircraft expected sales in volume (8%, +230M$) and aircraft (+1,410), and
- small wide-body segment with 220 more aircraft (+5%) and an increase in volume of 80 Bn$ (+7%).
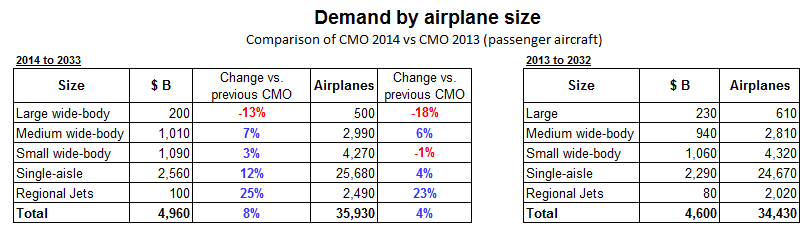
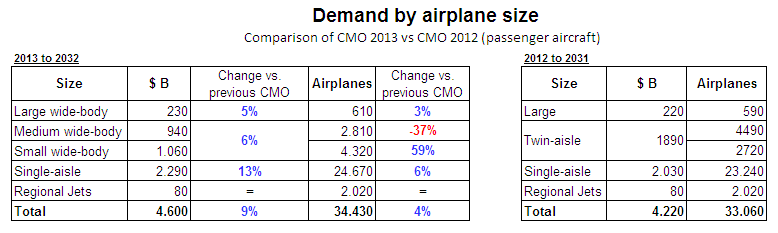
- Three years ago, I wrote about a sudden change between CMO 2013 and CMO 2012 of the mix in wide-bodies; in this respect, CMO 2015 is consistent with last year’s one, showing simply an increase in demand for both sub-segments.
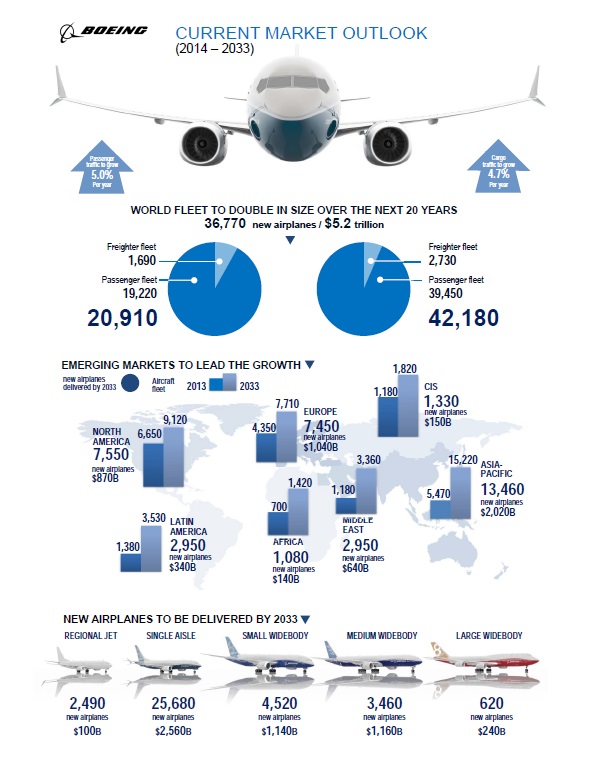
- It is interesting to note how Boeing continues to downplay the large aircraft segment at the moment when a A380 is discussed, however this year’s figures are increased in relation to CMO 2014 in terms of both aircraft and volume.
This year study’s figures and presentation focus again on single-aisle (737 MAX 8, “Medium-size aircraft are at heart of single-aisle market“) and small wide-bodies (787, “opening new markets”), the products to be pushed by the sales force.
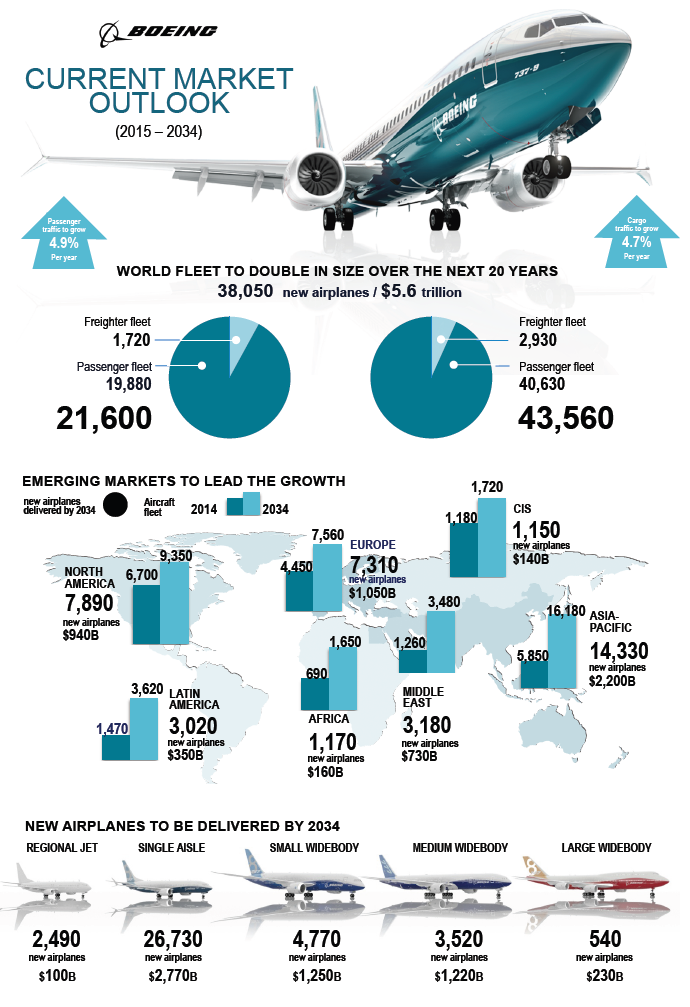
Find below the nice infographic [PDF, 464 KB] that the guys from Boeing have put up together:
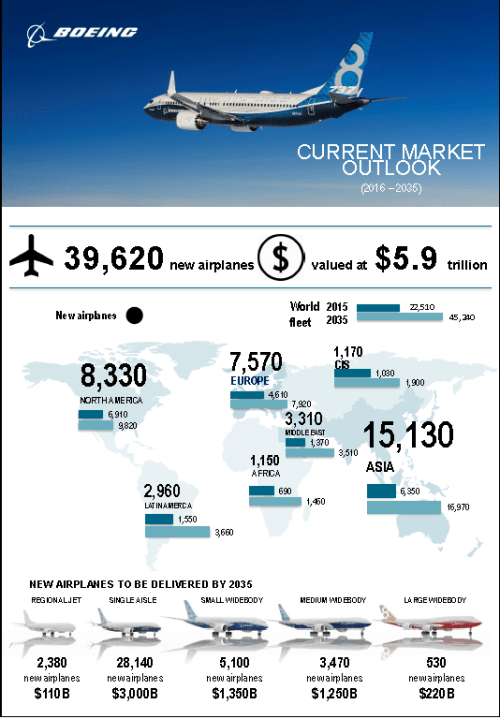
Boeing Commercial Aviation Market Forecast 2016-2035 infographic.
As always, I recommend going through the CMO, as you can learn a lot about the business: from global numbers, to growth, traffic figures, fleet distributions, forecasts, etc… You may find the presentation [PDF, 4.7 MB], a file [XLS, 0.6 MB] with all the data or the full CMO report [PDF, 4.1 MB].
This year again, together with the CMO, Boeing provides two interesting papers from a couple of years ago: “Key Findings on Airplane Economic Life“ [PDF, 0.3MB, dating from August 2013] and “A Discussion of the Capacity Supply -Demand Balance within the Global Commercial Air Transport Industry“ [PDF, 0.6MB, dating from August 2013].
—
(1) Traffic increased measured in RPKS (revenue passenger kilometers) in billions.
(2) These two ratios, 4.2% fleet demand and 4.8% traffic growth, point to an implicit increase in the average size of the aircraft in fleet and / or a higher utilization of the aircraft (higher availability).
(3) These two segments (single-aisle and small wide-body) saw as well the largest increases in number of aircraft and volumes in the CMO of 2015 in relation to 2014.
(4) Find the reviews I wrote comparing 2015 CMO with 2014 CMO, 2014 CMO with 2013 CMO and 2013 CMO with 2012 CMO.