After the post I wrote the last week with an analysis of when could Boeing 787 break even (Will Boeing 787 ever break even?), I received some feedback in the form of emails, comments in the blog and comments in Scott Hamilton’s blog (Leehamnews) as he mentioned the analysis and linked to it.
I wanted to address some of those comments in a single piece for the benefit of all. Please, find them below.
A leading aviation analyst hinted that:
“In the case of the 787, it increasingly looks like the -8 will be an up-front version with poor pricing, but the -9 (and -10) are planned to make this problem better. […] So, your assumption of a consistent 38% discount won’t happen, unless either Boeing fails to improve the 787’s performance or if the market doesn’t like the 787.”
This could be built into the model by allowing aircraft sold after the current backlog appear in the model as sold at a lower discount (e.g. 20% instead of 38%). The cash inflows due to the down payments would be increased soon, but since producing the existing backlog will take until sometime in 2019, the cash inflows from deliveries will be untouched until then. Result: that would bring break even about 2 years forward (2021 vs. 2023, in the case of 75% learning curve and 10% discount rate – what I would call “Boeing’s baseline”).
Another leading analyst suggested:
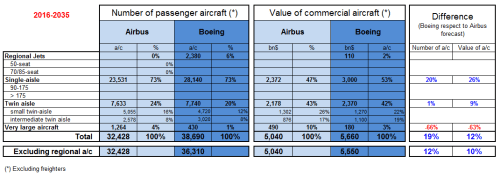
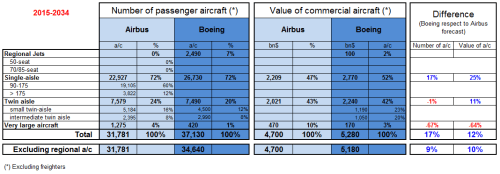
“I think the 5,000 market forecast is for the middle twin-aisle market as a whole, which includes A330, A350 and 777 (and even the almost-but-not-quite-dead 767). If I’m correct, I disagree with your figure above as too high. Clarification of the 5,000 is required for everybody.”
I reviewed Boeing’s commercial market outlook. In the next 20 years (2011-2030) Boeing sees deliveries of 6,610 twin-aisle passenger aircraft: 3,020 small and 3,590 intermediate.
In the previous post I mentioned that 2,634 were included as 787 deliveries, though that includes deliveries from 2031 to 2034, later than the period covered by this year’s CMO (480 a/c between 2031-34).
To compare apples with apples, between 2011 and 2030 I included 2,154 787s delivered, all those that 787 assembly lines could produce. That is 43% of the “addressable” 5,000 market or 33% of the 6,610 total market, including A330s, 777s (70-90 produced a year now), 767s (12-15 a year) and A350s… This figure, 2,154, could be optimistic in my opinion as well. If a lower figure should be used the situation for the break even would be worse.
I received some comments via Leehamnews blog:
The user KDX125 mentioned:
“[…] the current inventory of 18bn is distributed over 58 aircraft that are assumed to be WIP. But the amount should be limited to deferred production cost and unamortized tooling, which according to the 10-Q is ‘just’ ~11bn.”
The 10Q says (emphasis is mine):
“As of September 30, 2011 and December 31, 2010, commercial aircraft programs inventory included the following amounts related to the 787 program: $14,423 and $9,461 of work in process (including deferred production costs), $1,775 and $1,956 of supplier advances, and $1,770 and $1,447 of unamortized tooling and other non-recurring costs. As of September 30, 2011, included in work in process were deferred production costs related to the 787 program totaling $9,699.”
Those are the ~18bn$ I mentioned, which were mentioned in the conference call as well. We need to distinguish here between accounting and cash flows. For the accounting of the profit behind each aircraft, it may be true that unamortized tooling could be distributed among 1,100 aircraft, however all those are costs that have already meant an outflow of cash. What I tried to do is to see how much costs of the about 50 aircraft which are in different stages of production was included in those 18n$ in order not to double count cash outflows related to costs of aircraft delivered. In other words, if from those 18bn$, 1.8bn$ refer to tooling and shouldn’t be distributed as WIP of those ~50 aircraft, that means the cash flow profile would look even worse, not better.
Normand Hamel and others have mentioned:
“[…] not taken into account the penalties to the customers and various suppliers.”
That’s correct and I acknowledge this is a shortcoming of the model. I tried to base all assumptions in public references appearing either in Boeing’s website or reports or news in the media. I couldn’t find anything related to value and structure of those penalties and thus didn’t include them. I would welcome references regarding this point. Anyway, as it was mentioned, including penalties in the model would worsen the cash flow profile and delay break even.
Slinger raised the point:
“For the learning curves to work in this model one must now the relationship between labour cost and material cost, since the learing curve only applies to labour time. […]
I don’t know if this is factored in into the model but if not, it would make the forecast even more pessimistic.”
While it is true that generally the concept of the learning curve is applied to labour, C. Lanier Benkard (professor of Economics at Standford Graduate School of Business), in his paper “Learning and Forgetting: The Dynamics of Aircraft Production” [PDF], describes the learning process as follows:
“Learning may take on many different forms depending on the particular nature of production. In more capital-intensive industries such as chemical processing and semiconductors, learning primarily results from the fine-tuning of production techniques. In such industries, engineers and managers analyze current output and constantly make small changes to the process, with the result that productivity gradually improves. In labor-intensive industries such as aircraft and shipbuilding, learning primarily results from workers becoming more efficient at the tasks the perform through multiple repetition. Many industries may be subject to both types of learning. […]”
Since I haven’t found any source referring to different types of learning for labour and materials for the case of Boeing, I made the same simplification that professor Benkard does in his paper (emphasis is mine):
“If the Leontieff assumption in equation (2) were relaxed and instead production was assumed to be Cobb-Douglas in all inputs, the production only at the unit level would imply a labor-requirements equation similar to (4) with the addition of both the wage rate and materials prices […]”.
If this assumption was optimistic or if the learning related to the materials production was capitalized mainly by Boeing’s suppliers and not by Boeing itself, this would only make the cash flow profile worse and delay the break even date.
Finally, Garry Reinhardt in the comments section to my post asked:
“[…] is Boeing profit, going forward, being decreased or increased by each 787 delivered? And if it’s negative now, when will it reach zero (leaving out the previously paid for expenses)?”
I do not give stock recommendations. Anyway, this cash flow analysis shows that most of the cash outflows that make the case of the 787 (viewed in isolation) such difficult, were made in the past years and didn’t derailed Boeing then. The 787 development was supported by other Boeing programs. From now on what is missing is that unit production cash outflows are lower than cash inflows related to deliveries (penalties not taken into account), and that is something that should happen at sometime between 2014 and 2016, depending on the learning curve that Boeing achieves. Nevertheless, whether this is something already reflected or not in current Boeing price share, and whether this price is cheap enough or not is left to the individual investor.
Finally, thanks again for all your feedback, comments, criticism and especially to Scott Hamilton for his linking the post so that I could get more feedback.