This is an update of a post I wrote 6 years ago (here, in Spanish) explanining how UEFA weighs club honours and now sharing the current (end of 2023/24 season) ranking.
UEFA publishes various rankings of football clubs, football federations and national teams. For that purpose UEFA assigns a series of points according to results achieved in the competitions organized by UEFA itself. From those, one can see at the end of each season the club which reached the highest scoring.
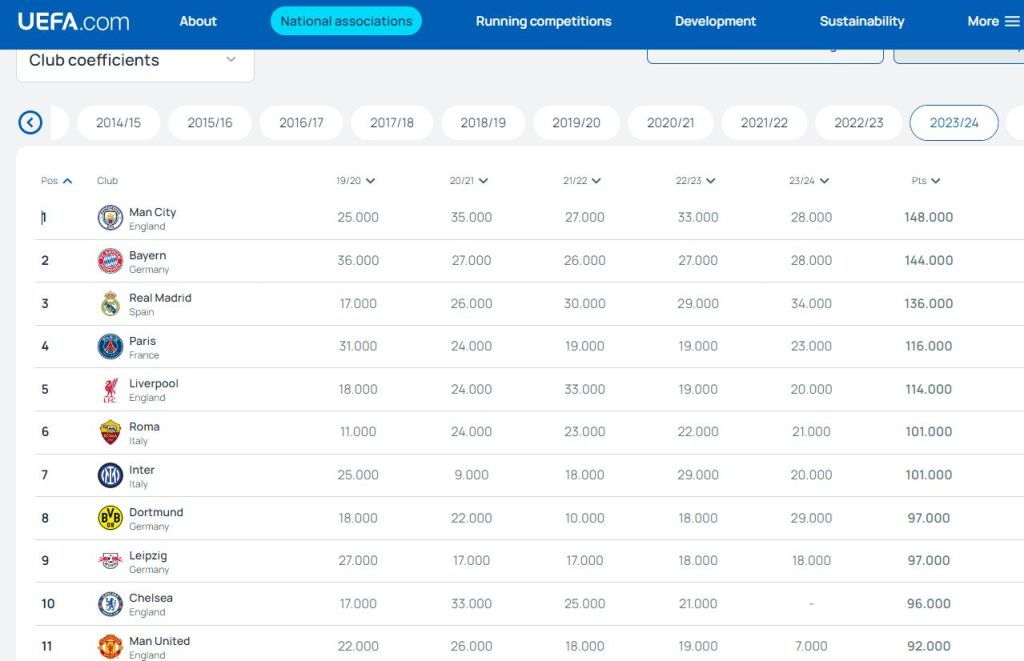
The 5-year club ranking is the one that UEFA generally employs to rank the teams (when UEFA publishes the team leading the ranking at any given point, it refers to the team leading that 5-year ranking, not the one with the highest score on that particular year). UEFA also uses the 5-year club ranking at the time of seeding the draw of the different groups of the Champions League.
5-year club coefficients (2023/24)
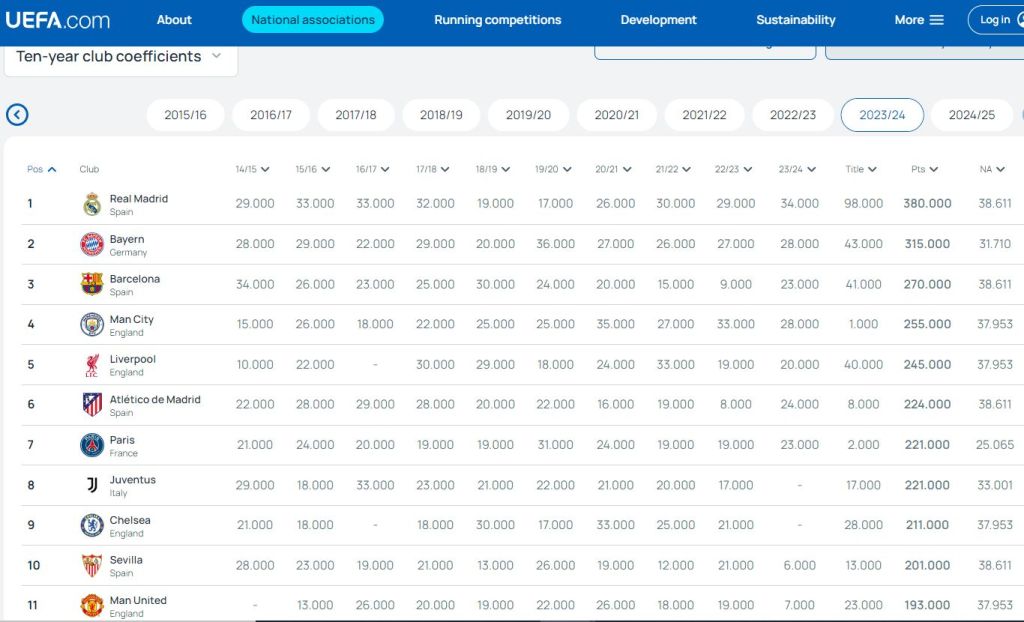
On the other hand, UEFA uses a slightly different 10-year club ranking as one of the criteria in order to distribute the money prizes among the different clubs. To compute that 10-year club ranking UEFA collects the yearly scoring of clubs in the last 10 years, and to that sum it adds another coefficient that UEFA calls “Title“, which is the coefficient I wanted to write about, and that shows the weighing that UEFA does of clubs’ honours.
10-year club coefficients (2023/24*)
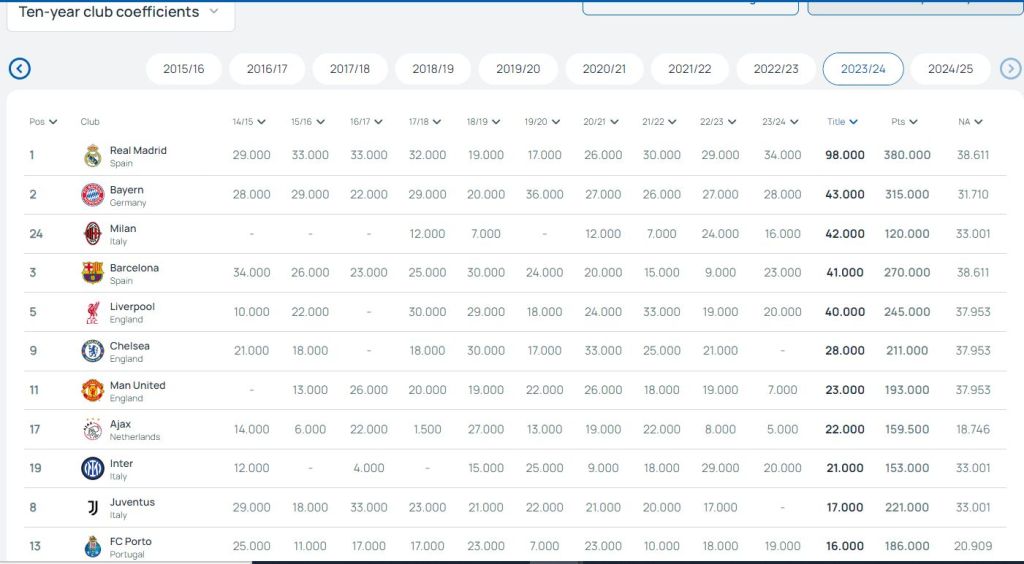
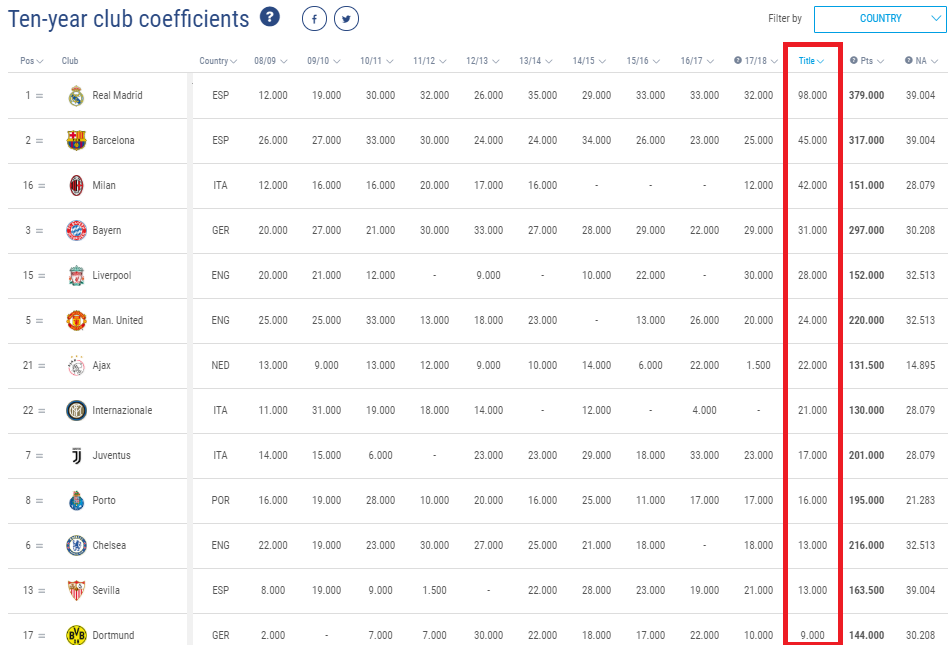
I leave below the the 10-year club ranking sorted by the column “Title“:
10-year club coefficients (2023/24*) sorted by the column Title
The table shows that Real Madrid leads the “Title” ranking with 98 points, followed by Bayern Munich with 43, AC Milan with 42 and Barcelona with 41…
How does UEFA compute that “Title” coefficient?
UEFA Champions League / European Cup:
12 points for those won in the last 5 seasons, i.e., 2019/20 to 2023/24
8 points for those won since the creation of the Champions League up to 6 seasons ago, i.e., 1992/93 to 2018/19
4 points for the European Cups won from 1955/56 to 1991/92
European Cup Winners’ Cup / UEFA Cup / UEFA Europa League:
3 points for those won in the last 5 seasons, i.e., 2019/20 to 2023/24
2 points for those won since the creation of the Champions League up to 6 seasons ago, i.e., 1992/93 to 2018/19
1 point for the Cup Winners’ Cup / UEFA Cup won from 1960/61 or 1971/72 to 1991/92
UEFA Super Cup does not compute for UEFA Title coefficient (if it did, Real Madrid leads that ranking as well with 6 titles)
Intercontinental Cup / FIFA Club World Cup do not compute for UEFA Title coefficient (if they did, Real Madrid leads that ranking as well in both of them with 3 and 5 titles, respectively)
National competitions do not compute for UEFA Title coefficient
After having gone through the explanation, some comments to it:
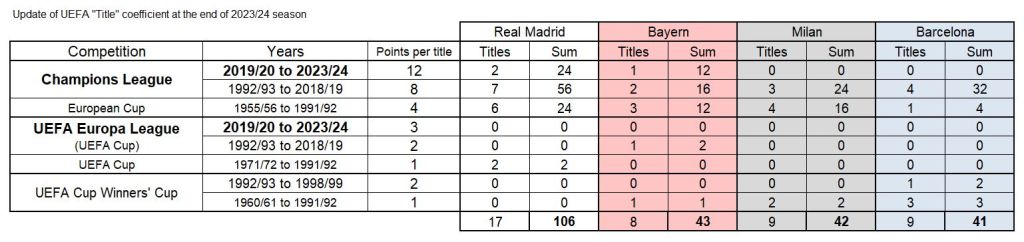
UEFA has not updated this Title since the end of 2021/22 season; you can see that Manchester City’s Title coefficient shows 1 point only, which is related to the European Cup Winners’ Cup they won in 1969/70 and does not include the 12 points for the Champions League won in 2022/23. Similarly, Real Madrid updated figure should be 106 points, as you can see in the table below
Among the competitions that UEFA organizes it weighs the Champions League as 4 times more important than either the UEFA League, or the extint UEFA Cup and European Cup Winners’ Cup
UEFA applies a time weighing as described above: titles in the last 5 seasons get a given amount of points, titles since 1992/93 to 6 years ago get 2/3 of those points and everything older than 1992 get 1/3 of those points
That time weighing makes teams having won titles more recently (Chelsea, 6 major titles) be better placed than others with older titles (Juventus, 6 major titles)
The extint Inter-Cities Fairs Cup (played between 1955 and 1971) does not compute for UEFA Title coefficient as it was not organized by UEFA and there were not qualifying criteria to take part in it. Interestingly enough, this competition is much talked about in Spain to make up for the lack of sufficient honours on the part of Barcelona when compared to Real Madrid
Which European club has the largest honours sheet?
The answer is clear, Real Madrid. So clear that the Title coefficient it has (either the outdated 98 or the updated 106, see below) is as high as the sum of the coefficients of all the other clubs that played the Champions League finals in the last 4 seasons (2020/21 to 2023/24) combined: Chelsea (27), Manchester City (13), Liverpool (36), Internazionale Milan (21) and Borussia Dortmund (9).
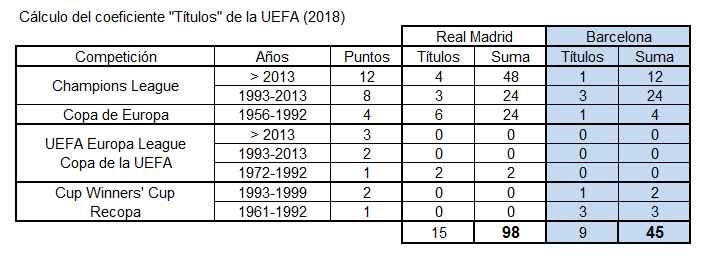
To conclude, I leave below a table where I show the computation to get the coefficients for the top 4 clubs (Real Madrid, Bayern, Milan and Barcelona) with the results up to the end of the 2023/24 season. I invite the reader to compute the updated figures for City, Chelsea or Liverpool that I referred to above.
Title coefficient computation, updated to the end of 2023/24 season for the top 4 clubs
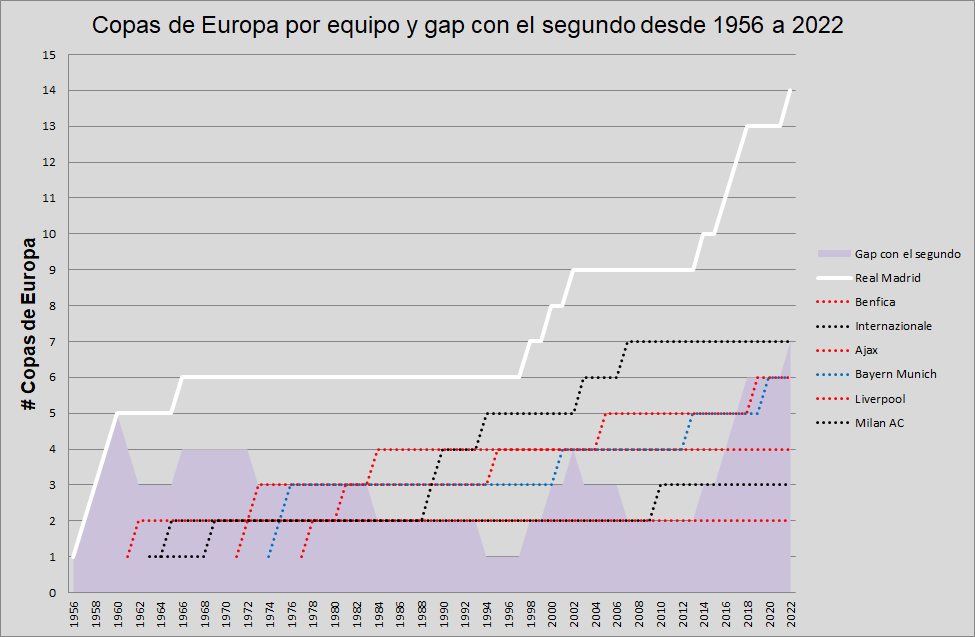
Esta es una pequeña entrada futbolera para compartir la gráfica de debajo tras la consecución de la decimoquinta Copa de Europa de fútbol por el Real Madrid.
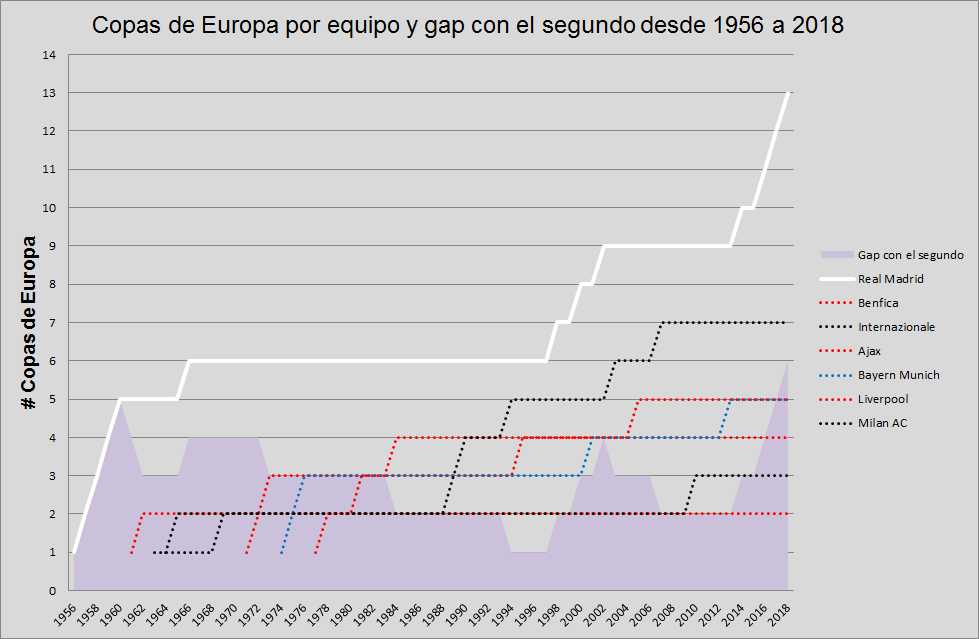
La gráfica presenta la evolución de las Copas de Europa conseguidas por el Real Madrid y todos aquellos clubes que en algún momento de la historia han sido el segundo equipo con más copas. Por orden: Benfica (Lisboa), Internazionale (Milán), Milan AC, Ajax (Ámsterdam), Bayern Munich, Liverpool y de nuevo Milan AC.
Algunas curiosidades que se observan en la gráfica:
Es ahora, en 2024, cuando con 8 la distancia, medida en Copas de Europa, entre el Real Madrid y el segundo club con más títulos es más grande.
Históricamente la distancia media ha estado en 3,1 copas.
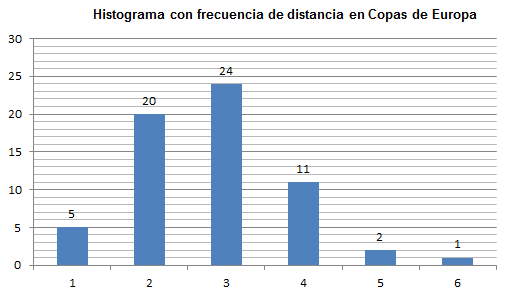
La moda, es decir la distancia más veces repetida entre el Madrid y el segundo, ha sido de 3 copas. Esa fue la distancia en 24 años, el 35% de estos 69 años de Copa de Europa (ver histograma debajo).
La distancia mínima se dio entre 1994 y 1998, tras ganar el Milan AC su quinta Copa de Europa en Atenas y hasta la consecución de La Séptima por el Real Madrid en 1998 en Ámsterdam.
A partir de esas curiosidades, me surgieron después otras tres ideas muy visuales que incluyo más abajo:
Un histograma con el número de años que se ha dado cada distancia en Copas de Europa.
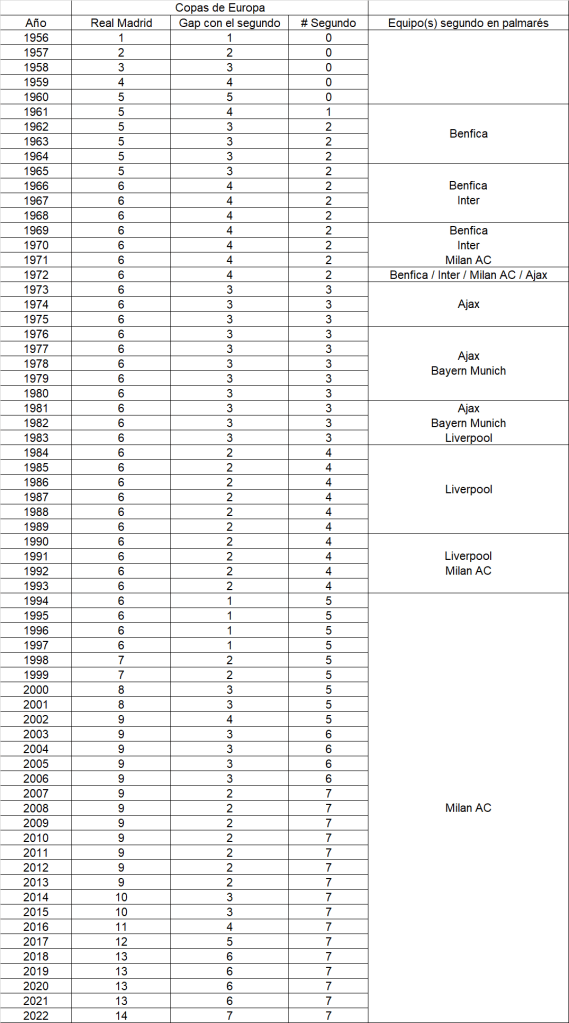
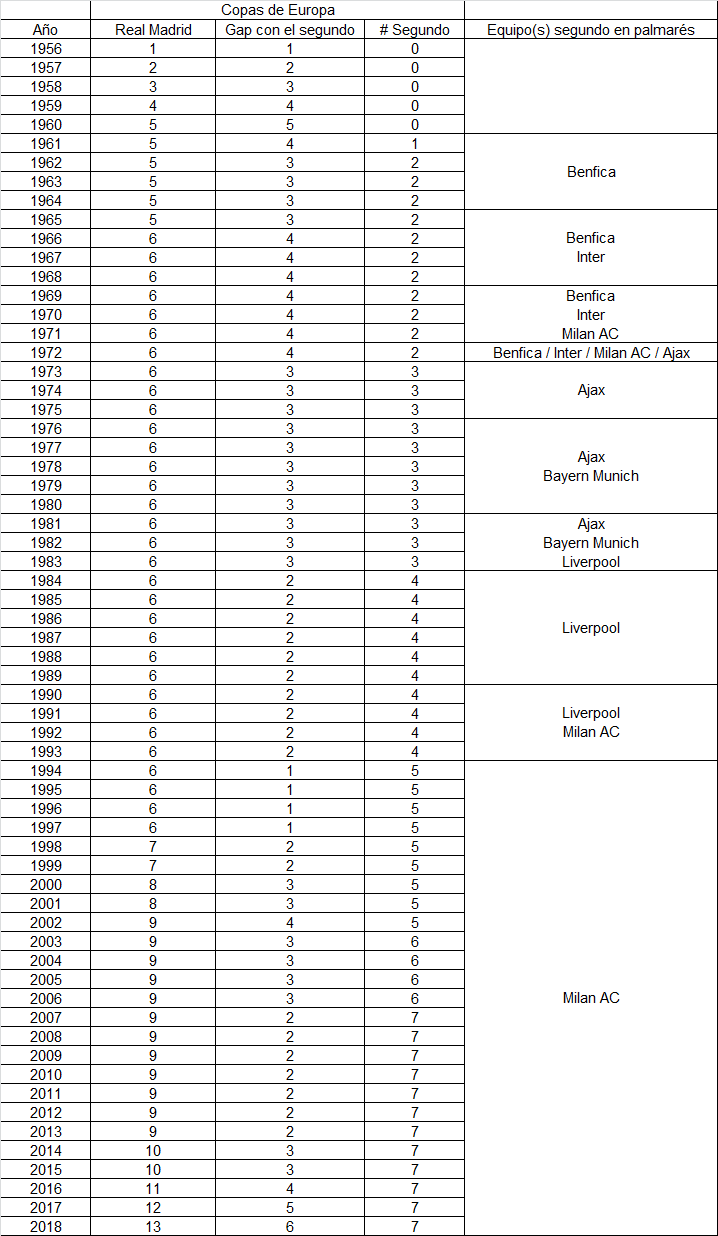
Una tabla donde se muestra en cada momento qué clubes eran los segundos en el palmarés.
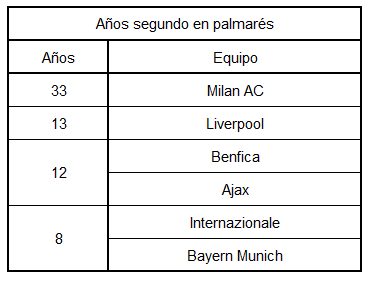
Otra tabla donde se muestra cuántos años ha sido cada uno de esos el segundo en el palmarés.
Esta es una pequeña entrada futbolera para compartir la gráfica de debajo tras la consecución de la decimocuarta Copa de Europa de fútbol por el Real Madrid.
La gráfica presenta la evolución de las Copas de Europa conseguidas por el Real Madrid y todos aquellos clubes que en algún momento de la historia han sido el segundo equipo con más copas. Por orden: Benfica (Lisboa), Internazionale (Milan), Milan AC, Ajax Amsterdam, Bayern Munich, Liverpool y de nuevo Milan AC.
Algunas curiosidades que se observan en la gráfica:
Es ahora, en 2022, cuando con 7 la distancia, medida en Copas de Europa, entre el Real Madrid y el segundo club con más títulos es más grande.
Históricamente la distancia media ha estado en 3,0 copas.
La moda, es decir la distancia más veces repetida entre el Madrid y el segundo, ha sido de 3 copas. Esa fue la distancia en 24 años, el 36% de estos 67 años de Copa de Europa (ver histograma debajo).
La distancia mínima se dio entre 1994 y 1998, tras ganar el Milan AC su quinta Copa de Europa en Atenas y hasta la consecución de La Séptima por el Real Madrid en 1998 en Ámsterdam.
A partir de esas curiosidades, me surgieron después otras tres ideas muy visuales y rápidas de ejecutar y que incluyo más abajo:
Un histograma con el número de años que se ha dado cada distancia en Copas de Europa.
Una tabla donde se muestra en cada momento qué clubes eran los segundos en el palmarés.
Otra tabla donde se muestra cuántos años ha sido cada uno de esos el segundo en el palmarés.
Ésta es una pequeña entrada futbolera para compartir una curiosidad sobre cómo pondera la UEFA el palmarés de los clubes dentro de los rankings de clubes que realiza la UEFA.
La UEFA publica varios rankings de clubes y asociaciones de futbol (federaciones de cada país). Para realizar los ranking de clubes, la UEFA asigna una serie de puntos según los resultados conseguidos en los partidos de las competiciones que organiza la propia UEFA. A partir de ellos, cada año se puede ver cuál es el club europeo que ha obtenido una mayor puntuación.
A partir de esas puntuaciones, la UEFA publica un ranking a 5 años y un ranking a 10 años. El ranking a 5 años es el que la UEFA utiliza, por ejemplo, para distribuir a los clubes en los diferentes bombos en los sorteos. También es el que utiliza para publicar cada año cual es el club que lidera el ranking UEFA (que no es necesariamente el que haya obtenido más puntos en ese año de competición, sino en los últimos 5 años).
Por otro lado, la UEFA aclara en su web que el ranking a 10 años sólo lo usa para la distribución de los premios en metálico a todos los clubes participantes en sus competiciones. Para realizar ese ranking a 10 años la UEFA utiliza la puntuación que los clubes han obtenido en cada uno de los últimos 10 años y a esa cifra le añade un coeficiente al que llama “títulos”. Y es sobre este coeficiente sobre el que quería escribir.
Primero dejo debajo el ranking a 10 años ordenado por la columna “títulos”:
En la tabla se puede ver que lo lidera el Real Madrid con un coeficiente de 98, al que le sigue el Barcelona con 45, el AC Milan con 42, Bayern con 31…
¿Cómo calcula ese coeficiente la UEFA?
Copa de Europa / UEFA Champions League:
Ganadas en los ultimos 5 años (2014-2018): 12 puntos.
Ganadas desde la creación de la Champions League hasta hace 6 años (1993-2013): 8 puntos.
Ganadas antes de la creación de la Champions League (1956-1992): 4 puntos.
Recopa (Cup Winners’ Cup) / Copa de la UEFA / UEFA Europa League :
Ganadas en los ultimos 5 años (2014-2018): 3 puntos.
Ganadas desde la creación de la Champions League hasta hace 6 años (1993-2013): 2 puntos.
Ganadas antes de la creación de la Champions League (1961-1992): 1 punto.
UEFA Super Cup: no suman para el cómputo del ranking de títulos UEFA.
Intercontinental Cup / FIFA Club World Cup: no suman para el cómputo del ranking de títulos UEFA.
Competiciones nacionales: no suman para el cómputo del ranking de títulos UEFA.
Comentarios:
La UEFA, entre las competiciones que ella organiza, da un valor a la Champions League 4 veces superior que a la antigua Recopa o a la UEFA Europa League.
La UEFA aplica una ponderación temporal:
Los títulos conseguidos entre 1956 y 1992 tienen un valor hoy de un 33% de los conseguidos en los últimos 5 años (4 vs 12 para la Copa de Europa; 1 vs 3 para la UEFA).
Por tanto, la Copa de Europa del “Dream Team” (Barcelona FC en 1992, en “color”) para la UEFA tiene el mismo valor temporal que uno de los “botijos” que ganó el Real Madrid de Di Stefano en los años 1950 (“en blanco y negro”).
Los títulos conseguidos entre 1993 y 2013 (para el ranking de 2018) tienen un valor hoy de un 67% de las conseguidas en los últimos 5 años (8 vs 12).
La extinta Copa de Ferias (Inter-Cities Fairs Cup), a la que en España se le da mucha relevancia, no computa para la UEFA. No era organizada por la UEFA, no había criterios de clasificación para la misma…
La Supercopa de Europa: no suma. Un torneo veraniego, que es mejor ganarlo que perderlo, pero que para la UEFA no tiene mayor relevancia que la fiesta de ese día.
La Intercontinental Cup / FIFA Club World Cup : no suma. Para la UEFA es un torneo pre-navideño, que es mejor ganarlo que perderlo, pero que para la UEFA no tiene mayor relevancia que la fiesta de ese día.
El palmarés europeo del Sevilla (13) es, para la UEFA, superior al del Atlético de Madrid (8). No obstante, el Atlético de Madrid en 2018 tiene una posición en el ranking (4º con 230 puntos) bastante superior al Sevilla (13º con 163.5 puntos), dado que a pesar de no haber ganado ninguna Champions League (palmarés), sí ha sumado puntos para el ranking por sus buenos resultados obtenidos entre 2014-17.
¿Qué club europeo tiene un mayor palmares de títulos europeos?
La respuesta es clara, el Real Madrid. Tan clara que tiene un coeficiente por títulos (98), aplicando las ponderaciones de UEFA, igual que la suma de los coeficientes de Liverpool (28), Juventus (17), Atlético de Madrid (8) y Barcelona juntos (45), es decir igual que todos los otros cuatro finalistas de la Copa de Europa en los últimos 5 años (2014-2018).
Por último, debajo dejo una tabla clara donde muestro el cálculo de los coeficientes de Real Madrid y Barcelona.
Esta es una pequeña entrada futbolera para compartir la gráfica de debajo tras la consecución de la decimotercera Copa de Europa de fútbol por el Real Madrid.
La gráfica presenta la evolución de las Copas de Europa conseguidas por el Real Madrid y todos aquellos clubes que en algún momento de la historia han sido el segundo equipo con más copas. Por orden: Benfica (Lisboa), Internazionale (Milan), Milan AC, Ajax Amsterdam, Bayern Munich, Liverpool y de nuevo Milan AC.
La idea me surgió tras un intercambio tuitero con Andrés a raíz de este tuit.
2007: Ay! Que nos empata a Copas de Europa el Milan!
Algunas curiosidades que se observan en la gráfica:
Es ahora, en 2018, cuando con 6 la distancia, medida en Copas de Europa, entre el Real Madrid y el segundo club con más títulos es más grande.
Históricamente la distancia media ha estado en 2,8 copas.
La moda, es decir la distancia más veces repetida entre el Madrid y el segundo, ha sido de 3 copas. Esa fue la distancia en 24 años, el 38% de estos 63 años de Copa de Europa (ver histograma debajo).
La distancia mínima se dio entre 1994 y 1998, tras ganar el Milan AC su quinta Copa de Europa en Atenas y hasta la consecución de La Séptima por el Real Madrid en 1998 en Ámsterdam.
A partir de esas curiosidades, me surgieron después otras tres ideas muy visuales y rápidas de ejecutar y que incluyo más abajo:
Un histograma con el número de años que se ha dado cada distancia en Copas de Europa.
Una tabla donde se muestra en cada momento qué clubes eran los segundos en el palmarés.
Otra tabla donde se muestra cuántos años ha sido cada uno de esos el segundo en el palmarés.
De momento, y hasta la vuelta del gran Milan AC, el Real Madrid podrá disfrutar de la delantera en el palmarés hasta al menos 2026.
Recently, the 2016 UEFA Champions League final (between Real Madrid and Atletico de Madrid) was decided in a penalty shoot-out, so was the 2016 Copa America Centenario final (Chile – Argentina) and so have already been a couple of matches in the round of 16 and quarter finals of the ongoing UEFA Euro 2016 (Switzerland – Poland and yesterday’s Poland-Portugal). You could expect one or two more matches in that competition to be decided in such a way.
“The penalty shoot-outs are a lottery”
This is a mantra repeated once and again each time the extra time of a football match comes to an end and the score is still a draw. Yet penalty shoot-outs are not a lottery. However, asking TV or radio football commentators to describe this aspect of the game as “two-person zero-sum game that meets von Neumann’s Minimax theorem” would be too much.
Years ago, while reading the book “Soccernomics“, by Simon Kuper and Stefan Szymanski (book review here), I came to know a couple of papers on penalties and penalty shoot-outs published by the Spanish economist Ignacio Palacios Huerta (at the London School of Economics).
Penalties
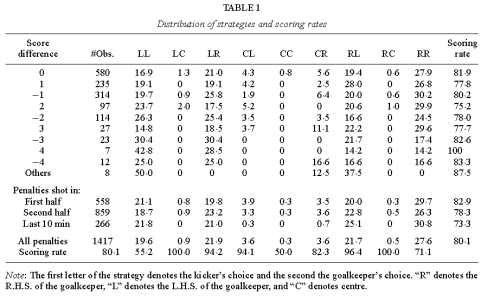
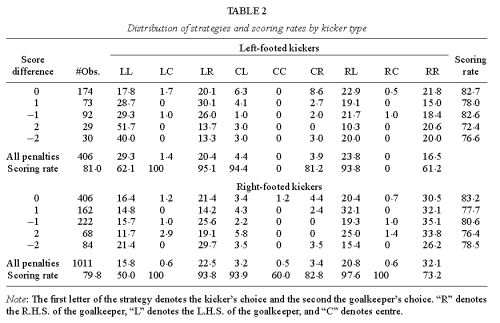
In a first paper, “Professionals Play Minimax“ (2002, and its annex) [PDF, 335 KB and 342 KB], by analyzing over 1,400 penalty kicks, he came to confirm that professionals do play Minimax, a game theory rule decision model in which they try to minimize the worst outcome not knowing the strategy of their opponent.
The object of the paper itself is to try to find a natural setting in which von Neumann’s theorem implication can be tested. Penalty kicks turns out to be such a natural setting, the reasons enabling the game to be so are: there are few strategies available to the players (basically shooting left or right for the kickers, or jumping to his left or right for the keepers), it is a two-player zero-sum game and the outcome of the game (goal or no goal) is immediate after a strategy is chosen.
Studying those over a thousand penalties and in particular those of 42 players (kickers and keepers) who have been each one involved in over 30 penalties in the time span of the study (1995-2000), the author came to the following findings:
Kickers have practically the same probability of scoring with different mix of strategies (being a strategy alternating between shooting left or right by a given proportion).
Players are capable of generating truly random sequences of choices (left – right). This is remarkable, as humans, when asked to produce a random sequence, normally over do it and shy away from what would be truly random.
Some figures: players shoot to their natural side (with the interior of the feet, shooting left to a right footed) just above 50% of the times, keepers jump to the natural side of the kicker slightly more often.
When the keeper “guesses” the side to which the kicker is shooting, the scoring probability greatly differs depending on whether it was the kicker’s “natural side”, 71%, or the non-natural side, 55%. When the keeper jumps to the wrong side the scoring probability is about 95% with no big difference between natural or non-natural side.
During a match the average scoring rate is about 80%, with the rate decreasing as the match comes to an end (73% for penalties in the last 10 minutes).
Some players during the years of the study (1995-2000) had significantly better scores; in particular Mendieta (91% and no matter whether he kicked to his natural (68% of the times) or non-natural side (32%)), Del Piero and Juninho (especially strong on their natural side (94%) and above average in their non-natural (87%)) or Bergkamp (91% and 88%).
Strategies between players varied greatly. As I said Mendieta had a 68/32 (natural / non-natural), whereas Batistuta had a 81/19 and Baggio a 45/55, all with above average scoring success. Other players like Zidane, Mihajlovic or Chiesa managed an undistinguishable 50/50.
For this study he reviewed over 2,800 penalty kicks in about 270 penalty shoot-outs. He divides the observations in two blocks, before and after FIFA changed the rules governing the shoot-outs in 2003. Before that date, the team of the captain winner of a toss of a coin started kicking first; after the change in the rules, the captain winner of the toss of a coin chooseswhich team kicks first.
Before 2003, the fact of kicking first or not was random, and after 1,343 kicks in 129 shoot-outs, the authors found out that the first in kicking in the sequence win the penalty shoot-out 60.5 percent of the time. (1)
As part of his study, Palacios Huerta made a survey questioning over 200 football players and coaches in Spain, professionals and amateurs, what would they choose if they had won the toss of a coin to decide which team kicks first in a penalty shoot-out. The results offer not doubt: over 95% of the cases chose to kick first. When asked why they would choose that option they indicated “to put pressure on the rivals”.
Experience matched the survey. After the change of FIFA rules in 2003, Palacios Huerta gathered data of another 140 penalty shoot-outs up to 2008 (just before writing his paper). Those were the first 140 penalty shoot-outs in which the winner of the toss of a coin had to choose whether he wanted his team to kick first or his opponent to kick first. In just a single case did the winner of the toss of a coin choose to let the opponent to kick first: Gianluigi Buffon playing for Italy the quarter-final of the Euro cup in 2008 against Spain, with the result that Spain won the penalty shoot-out and went to win the Euro, starting a streak of 3 consecutive major competitions at national level (Euro 2008, World Cup 2010 and Euro 2012).
Take a look at the following graphics and tables that let you read how the probabilities of scoring each penalty in a shoot-out evolve depending on previous outcomes (whether the team is behind, even or ahead) and the probability of winning the shoot-out (hence qualifying to the next phase or winning the competition) evolve.
I highlighted in the previous table in blue and yellow the scoring probability for each kick and the winning percent of the shoot-out for a shoot-out in which both teams go about scoring each of the penalties. It is interesting, if not dramatic, to see how while the scoring probability for the first team is always between 72 and 78% (2), for the second team it drops from 82% to 62-66% for rounds 3 to 5. Similarly, the winning probability decreases for the second team down to 21-23% just before attempting kicks 3 and 4 if all previous penalties have been scored.
See below that 2008 penalty shoot-out between Spain and Italy.
—
After having commented on these two papers and its conclusions, let me share a few comments and anecdotes:
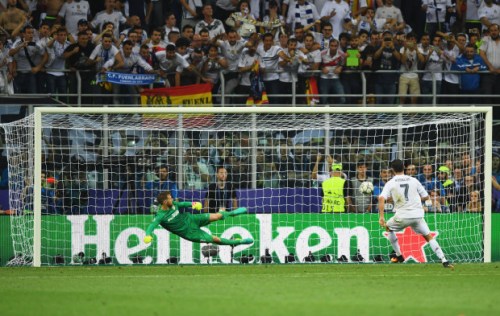
MILAN, ITALY – MAY 28: Cristiano Ronaldo of Real Madrid scores the winning penalty during the UEFA Champions League Final. (Photo by Shaun Botterill/Getty Images)
Toss of a coin. Both 2016 Copa America Centenario final and UEFA Champions League final were won by the team which kicked the first penalty, Chile and Real Madrid, respectively. In the draw, using the toss of a coin, to decide which team kicked first Chile chose to kick first (see here the video). However, in the Champions League final, Atletico de Madrid’s captain Gabi chose to let Real Madrid kick first. Apparently, he chose that as they had kicked second in the round of 16 of that same competition against PSV Eindhoven and passed. Somehow he tried to repeat the sequence thinking that this would bring them luck. Well, with that decision he put his team against about 60-40% odds backed by over 30 years of recorded experience and about 270 shootouts. Not a clever move. See this article “La buena mala suerte del Churu” by Manuel Jabois discussing this toss of a coin (in Spanish). See here the video.
“[…] we find a systematic first-mover advantage. Further, professionals are self-aware of their own psychological effects and, when given the chance, they rationally react by systematically taking advantage of these effects.” (Palacios-Huerta)
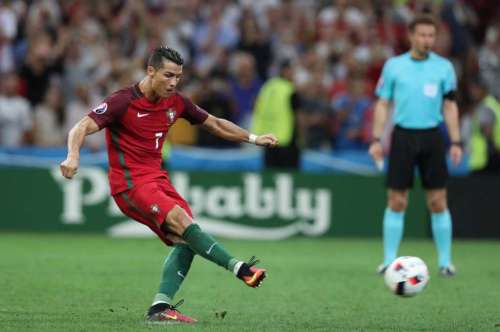
As reflected above, in the paper, Palacios-Huerta indicates that between 2003 and 2008 only once in 140 samples did the winner of the toss chose to let the opponent kick first. That is why it was striking what Gabi did and why it called the attention of some football fans. Well, yesterday, during the first match of the Euro 2016 quarter finals between Poland and Portugal, we had yet another such example, another anomaly. This time it was Robert Lewandowski, the Polish captain, the perpetrator. He won the toss of the coin and chose that Portugal kicked first. I can imagine how Cristiano Ronaldo might have felt at that moment, the second time in just 6 weeks that he was being handed such a present. Portugal won the shoot-out.
Palacios Huerta and other analysts receive requests for dedicated reports about kicking patterns, records and data of different teams when playing knock-out phases. In Soccernomics, Simon Kuper and Stefan Szymanski, describe how that happened during the 2008 UEFA Champions League final between Manchester United and Chelsea. Palacios Huerta had given Chelsea some tips on Manchester kickers and keeper (van der Saar): “Van der Sar tends to dive to the kicker’s natural side”, “most of the penalties that Van der Sar stops are mid-height, thus is better to shoot low or high”, “if Cristiano Ronaldo stops half-way in the run-up to the ball chances are 85% that he shoots to his natural side”…, it is quite interesting to actually see that penalty shoot-out and how the different players acted. See below the video. Apparently Van der Saar saw how Cech, Chelsea’s keeper had some paper in his hands and also noticed how kickers were shooting to their non-natural side, until at the 7th penalty (~9’30” in the video) he defies Anelka by pointing to Anelka’s non-natural side, like saying “I know you have the tip to kick there”, then…
For the record, the final was won by Manchester, first in kicking.
Finally, ever since coming to know all this information I have enjoyed penalty shootouts more than before. I now entertain myself seeing the strategy taken by the keepers and kickers, whether the keeper jumps to the natural side of the kicker more or less than in 60% of the shots, if he changes his strategy depending on whether the kicker is left or right-footed, whether kickers shoot more or less than 60% of the shots to their natural side, etc.
“Les grandes personnes aiment les chiffres“, Le Petit Prince.
—
(1) At the time of the Copa de America Centenario final, the Spanish journalist Alexis Sanchez (better know by his profile @2010MisterChip), expert in providing all kind of football statistics, tweeted that Chile, being the first in kicking in the penalty shootout against Argentina had a 55% chance of winning the tournament. Thus, it may be the case that he has a larger (not public) database including more penalty shootout.
(2) Note how probabilities in shoot-outs decrease from the average of 80% of penalties during the match.
Una de las tradiciones muy españolas que se repite una y otra vez tras cada sorteo de la Champions League de fútbol es el interpretar quién ha tenido más suerte en dicho sorteo: ya sea porque los rivales son presuntamente más sencillos (da igual que se trate de semifinales y el rival haya eliminado a grandes equipos en el camino) o porque se juegue la segunda vuelta en casa de un equipo en vez de “fuera” (en casa del rival).
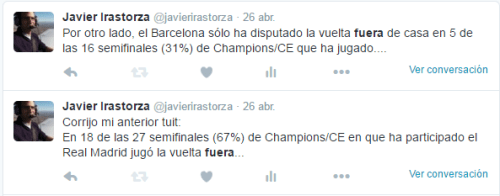
La semana pasada, unas horas antes del partido de ida de la semifinal entre Manchester City y Real Madrid, leí, en un artículo escrito por Míster Chip, que el Real Madrid había jugado en 8 semifinales el partido de vuelta en casa. Sabiendo que hasta entonces el Madrid había disputado 26 semifinales, eso indicaba que en las otras 18 disputó el partido de vuelta fuera. Acto seguido miré los números para el FC Barcelona en la página de récords y estadísticas de la Champions League en la Wikipedia. Y el resultado lo publiqué en este par de tuits.
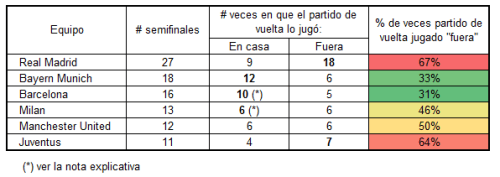
Un día después, miré a ver cómo de aislados o dispares eran los dos casos en comparación con otros equipos. En toda la historia de la Copa de Europa y de la Champions League hay sólo 6 equipos que hayan alcanzado las semifinales en 10 o más ocasiones: dos españoles, el Real Madrid y el FC Barcelona, dos italianos, el AC Milán y la Juventus de Turín, el Bayern Munich y el Manchester United. El resultado de la búsqueda se ve en la tabla de debajo.
De los 6 equipos, el Real Madrid y luego la Juventus son los equipos que de largo presentan un peor balance en los sorteos en cuanto a las veces en que les ha tocado jugar la vuelta fuera de casa (hecho presúntamente desfavorable, comúnmente entendido así). En la zona templada se encuentran el Manchester y el Milan, que han jugado el mismo número de ocasiones la vuelta en casa o fuera. Y en el otro extremo se encuentran el Bayern Munich y el Barcelona, con una gran mayoría de semifinales cuya vuelta la jugaron en casa.
Habiendo comentado este hecho con un grupo de compañeros de la universidad, uno de ellos, Juan, indicaba cual era la probabilidad de que al Real Madrid en 27 sorteos le tocase jugar fuera de casa en 18 o más ocasiones. Para ello, se hace uso de la distribución binomial; que es una distribución de probabilidad discreta que cuenta el número de éxitos en una secuencia de n ensayos de Bernoulli independientes entre sí.
Haciendo el mismo ejercicio para el caso del Barcelona (1), la probabilidad de que al azar al Barcelona en 14 sorteos le tocase jugar fuera de casa en 5 o menos ocasiones es de 21.2%.
Una vez hecha esta revisión, creo que queda despejado cuál de los equipos ha tenido más suerte en los sorteos de semifinales en cuanto a si le toca jugar en casa o fuera el partido de vuelta.
—
Nota: tanto el Barcelona como el Milan jugaron cada uno dos “semifinales” entre los años 1992 y 1994 en los que el formato de competición fue un tanto singular (y diferente según el año).
En las ediciones de 1992 y 1993, las “semifinales” fueron una fase con 2 grupos, cuyos primeros clasificados se enfrentaron en la final (el último partido de dicha fase el Barcelona lo jugó en casa, contra el Benfica, lo que le permitió asegurar los puntos necesarios para quedar primero y jugar la final contra el Sampdoria).
La edición de 1994 tuvo una eliminatoria de semifinales, pero a partido único, que tanto Barcelona como Milan jugaron en casa y ganaron, enfrentándose después en la final. El hecho de jugar ese partido único en casa, estaba determinado no por un sorteo sino por la clasificación en una fase previa con dos grupos.
(1) Para este cálculo, no computo 16 semifinales, sino 14, dado que como se explica en la nota previa, en los años 1992 y 1994 las semifinales que el Barcelona jugó (una en casa, otra una fase de grupos) no fueron fruto de un sorteo.
If you love football (soccer) and have read one of the books of the “Freakonomics” saga or any book from Malcolm Gladwell, then “Soccernomics“, by Simon Kuper and Stefan Szymanski (430 pgs.), will be a great read for you.
The book is written in the same style as the other books mentioned above: using economics’ techniques, plenty of data, statistics, citing several papers, studies, etc., in order to bring up uncovered issues about football or refocus the attention about other ones. Some examples:
Mastering the transfer market. Departing from the example of Billy Beane in baseball, described in “Moneyball“, by Michael Lewis (of which a movie was also made starring Brad Pitt), the authors show how pouring money in transfer markets doesn’t bring titles. The key issue is to have a balanced net investment (sales/acquisitions). In soccer the main example would be Olympique Lyon which will “sell any player if a club offer more than he is worth”, for which each player is previously assigned a price (much like value investing).
The more money is paid to players the better (in salaries). Instead of buying new expensive players it seems to make more sense to pay well and ensure the adaptation of the stars already playing for the team.
The market for managers is not yet very open (e.g. no black coaches in main European teams), thus many of them do not make a real difference. There was even an English team Ebbsfleet United who dispensed the coach and allowed subscribed fans to vote the player selection for each match.
The book, written at the beginning of 2012 forecasted that soon teams from big European capitals would win the Champions’ League, being those capitals: London, Paris, Istanbul and Moscow. Few months later Chelsea won its first one, let’s see the others.
The main factors for the success of football national teams seem to be the experience (international games played by the national team), wealth and population.
The authors give much weight to Western Europe dominance of football due to the interconnectedness of continental Europe. Explaining the rise of Spain in the ’90s and ’00s due to its growth in population, improved economy since joining the EU, more experience and exchanges of styles with coaches of other countries.
The authors claim that future national football will be dominated by countries such as Iraq, USA, Japan or China.
…
As you can see there are many different topics, all with some data to support them (even if sometimes you doubt about the consistency of their claims, e.g. their statements on industrial cities as dominating football, dictatorships, etc.). I marked many pages with some anecdotes or papers that I would like to read.
One final anecdote: tips given to clubs and teams in KO competitions in case they face a penalty shoot-out. In the Champions’ League final of 2008, Chelsea and Manchester United reached the penalties. An economist had given Chelsea a study of Manchester goal keeper and penalty-shooters. Once you read the book and the tips the economist provided (“Van der Sar tends to dive to the kicker’s natural side”, “most of the penalties that Van der Sar stops are mid-height, thus is better to shoot low or high”, “if Cristiano Ronaldo stops half-way in the run-up to the ball chances are 85% that he shoots to his natural side”…), it is quite interesting to actually see that penalty shoot-out and how the different players acted.
[Pay special attention at Van der Sar’s reaction at 09’40”, when it seems he noticed about Chelsea having been tipped]