This is an update of a post I wrote 6 years ago (here, in Spanish) explanining how UEFA weighs club honours and now sharing the current (end of 2023/24 season) ranking.
UEFA publishes various rankings of football clubs, football federations and national teams. For that purpose UEFA assigns a series of points according to results achieved in the competitions organized by UEFA itself. From those, one can see at the end of each season the club which reached the highest scoring.
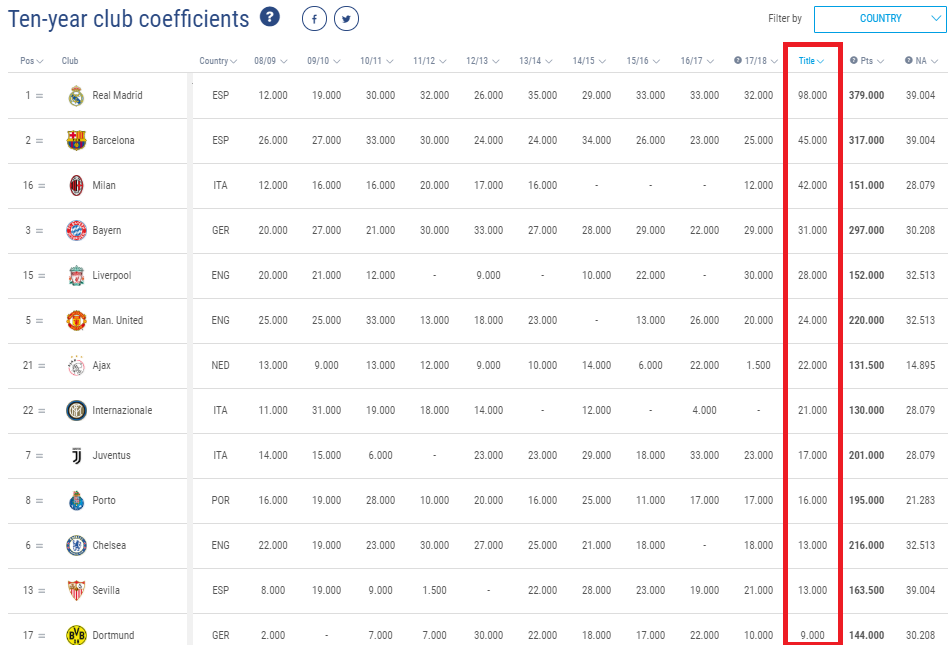
With the scoring of different years, UEFA publishes two different club rankings: the 5-year club ranking and the 10-year club ranking.
The 5-year club ranking is the one that UEFA generally employs to rank the teams (when UEFA publishes the team leading the ranking at any given point, it refers to the team leading that 5-year ranking, not the one with the highest score on that particular year). UEFA also uses the 5-year club ranking at the time of seeding the draw of the different groups of the Champions League.
On the other hand, UEFA uses a slightly different 10-year club ranking as one of the criteria in order to distribute the money prizes among the different clubs. To compute that 10-year club ranking UEFA collects the yearly scoring of clubs in the last 10 years, and to that sum it adds another coefficient that UEFA calls “Title“, which is the coefficient I wanted to write about, and that shows the weighing that UEFA does of clubs’ honours.
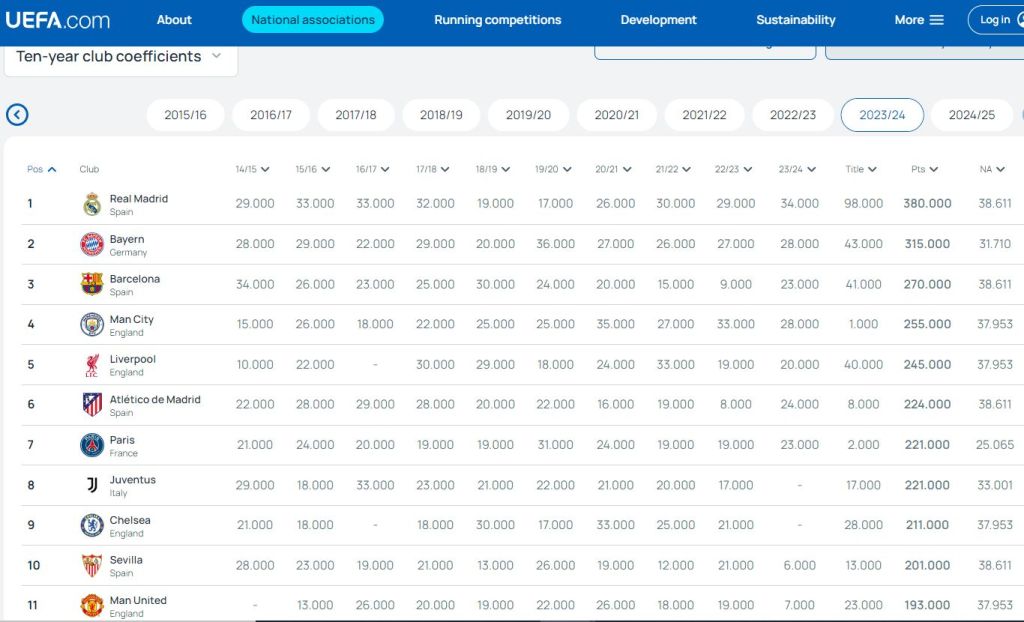
I leave below the the 10-year club ranking sorted by the column “Title“:
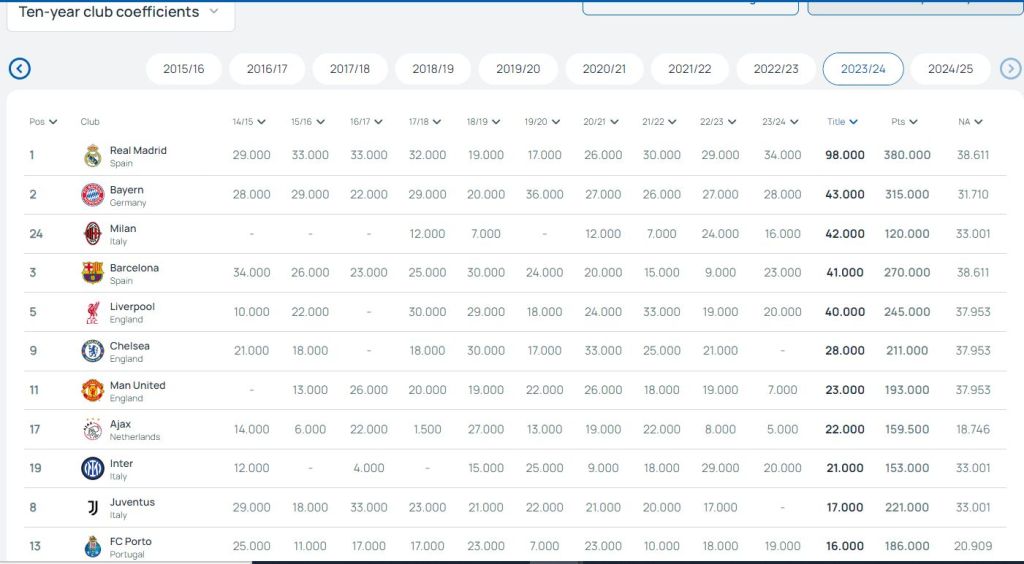
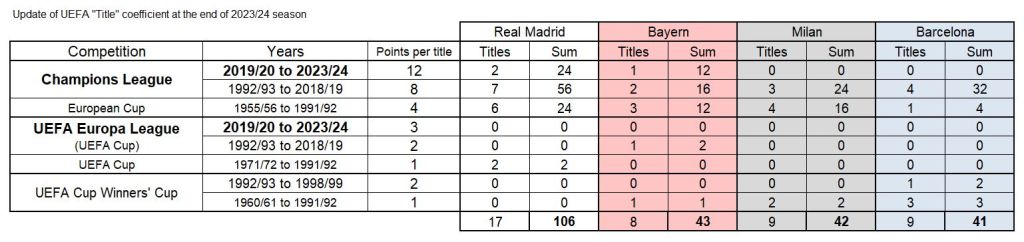
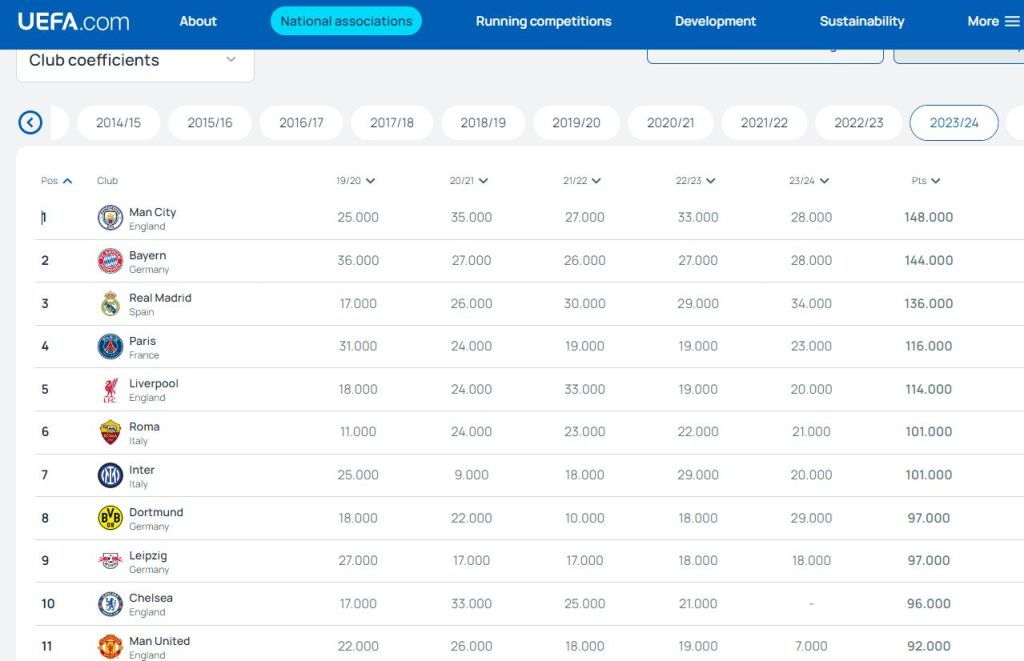
The table shows that Real Madrid leads the “Title” ranking with 98 points, followed by Bayern Munich with 43, AC Milan with 42 and Barcelona with 41…
How does UEFA compute that “Title” coefficient?
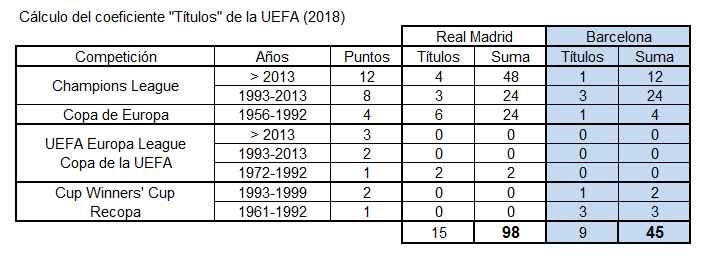
- UEFA Champions League / European Cup:
- 12 points for those won in the last 5 seasons, i.e., 2019/20 to 2023/24
- 8 points for those won since the creation of the Champions League up to 6 seasons ago, i.e., 1992/93 to 2018/19
- 4 points for the European Cups won from 1955/56 to 1991/92
- European Cup Winners’ Cup / UEFA Cup / UEFA Europa League:
- 3 points for those won in the last 5 seasons, i.e., 2019/20 to 2023/24
- 2 points for those won since the creation of the Champions League up to 6 seasons ago, i.e., 1992/93 to 2018/19
- 1 point for the Cup Winners’ Cup / UEFA Cup won from 1960/61 or 1971/72 to 1991/92
- UEFA Super Cup does not compute for UEFA Title coefficient (if it did, Real Madrid leads that ranking as well with 6 titles)
- Intercontinental Cup / FIFA Club World Cup do not compute for UEFA Title coefficient (if they did, Real Madrid leads that ranking as well in both of them with 3 and 5 titles, respectively)
- National competitions do not compute for UEFA Title coefficient
After having gone through the explanation, some comments to it:
- UEFA has not updated this Title since the end of 2021/22 season; you can see that Manchester City’s Title coefficient shows 1 point only, which is related to the European Cup Winners’ Cup they won in 1969/70 and does not include the 12 points for the Champions League won in 2022/23. Similarly, Real Madrid updated figure should be 106 points, as you can see in the table below
- Among the competitions that UEFA organizes it weighs the Champions League as 4 times more important than either the UEFA League, or the extint UEFA Cup and European Cup Winners’ Cup
- UEFA applies a time weighing as described above: titles in the last 5 seasons get a given amount of points, titles since 1992/93 to 6 years ago get 2/3 of those points and everything older than 1992 get 1/3 of those points
- That time weighing makes teams having won titles more recently (Chelsea, 6 major titles) be better placed than others with older titles (Juventus, 6 major titles)
- The extint Inter-Cities Fairs Cup (played between 1955 and 1971) does not compute for UEFA Title coefficient as it was not organized by UEFA and there were not qualifying criteria to take part in it. Interestingly enough, this competition is much talked about in Spain to make up for the lack of sufficient honours on the part of Barcelona when compared to Real Madrid
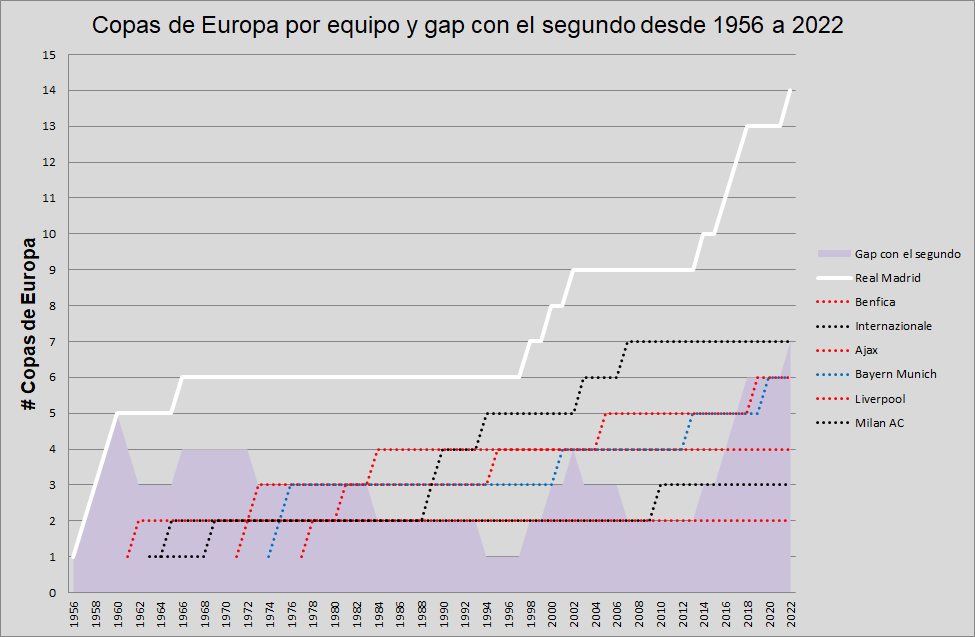
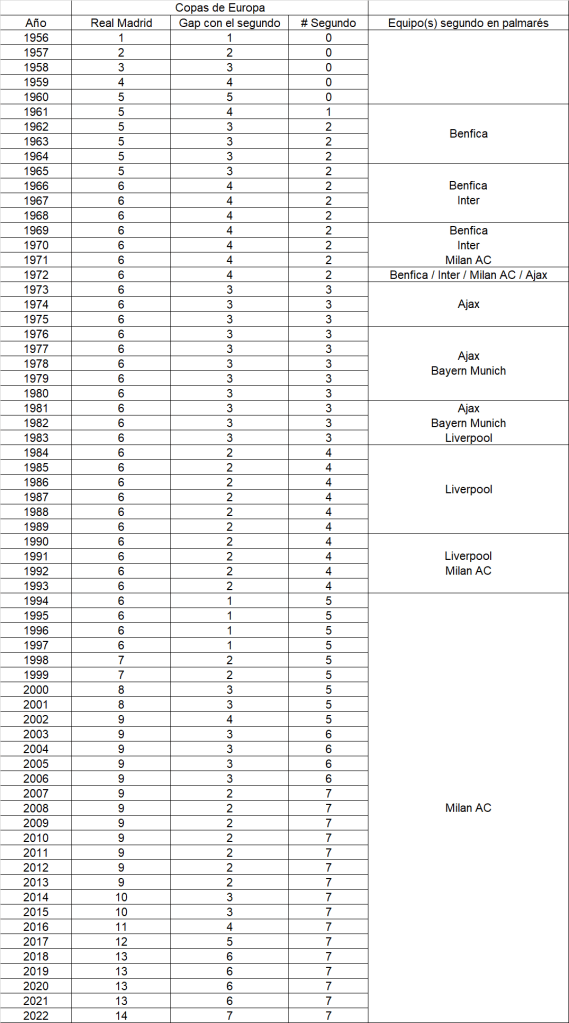
Which European club has the largest honours sheet?
The answer is clear, Real Madrid. So clear that the Title coefficient it has (either the outdated 98 or the updated 106, see below) is as high as the sum of the coefficients of all the other clubs that played the Champions League finals in the last 4 seasons (2020/21 to 2023/24) combined: Chelsea (27), Manchester City (13), Liverpool (36), Internazionale Milan (21) and Borussia Dortmund (9).
To conclude, I leave below a table where I show the computation to get the coefficients for the top 4 clubs (Real Madrid, Bayern, Milan and Barcelona) with the results up to the end of the 2023/24 season. I invite the reader to compute the updated figures for City, Chelsea or Liverpool that I referred to above.