Few days ago I was discussing with some commenters on the blog of aviation analyst Scott Hamilton (Leeham News and Comment) about the recurring costs Boeing may be experiencing in the 787 program at the moment.
I used in the discussion the analysis I had made of the learning curve Boeing has experienced in the last 2 years according to cost reductions reported by its CFO, Greg Smith. See a post I wrote about it here. The result I reached is that lately they achieved a 87%. With information disclosed last year, the figure I arrived for 2013 was ~84%, see the post here. However, in the calculation to obtain the learning curve experience the actual costs are not needed, it is sufficient to know cost reductions achieved (reported) between given units.
However, when in 2011 I wrote a series of posts (1) about Boeing 787 break even, I did try to estimate what the cost of the first production units were using published information at the time. At that time it was disclosed that Boeing had about 18bn$ of work in process (WIP) and a number of aircraft in different stages of production. Reported average costs ranged from 250m$ to 400m$. I made some simple assumptions and arrived at an average cost of 310m$ for the first ~60 units.
The next step is to accommodate those average costs into a learning curve profile. The steeper the curve (75%) the more expensive the first unit would have been. Since in 2013 the calculated curve was a 84%, I obtain that the first must have been around 650m$ (2). From then on, I apply the mentioned 84% through end 2013. Then I switch to a 87% curve (slower learning) following the reported figures from Greg Smith.
This discussion so far gives an idea of how to estimate the recurring costs. At the end of 2014 this figure is estimated around 180m$.
In order to know by when Boeing will turn the production of 787s into something profitable, we first need to know by when the recurring costs will be lower than the recurring income. The latter is estimated from the information about prices (published by Boeing here) and discounts applied (estimated in other blog posts, see the last update for 2014).
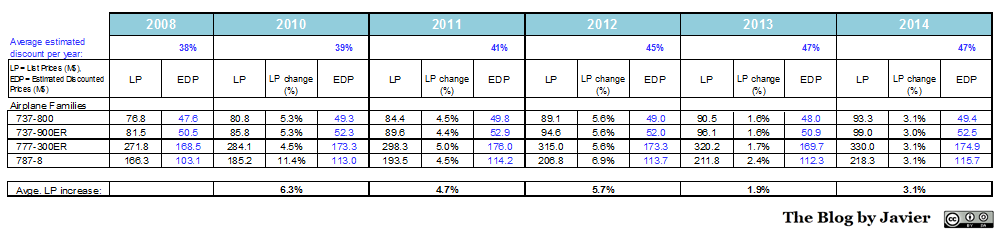
Boeing list price for the 787-8 in 2014 was 218.3M$.
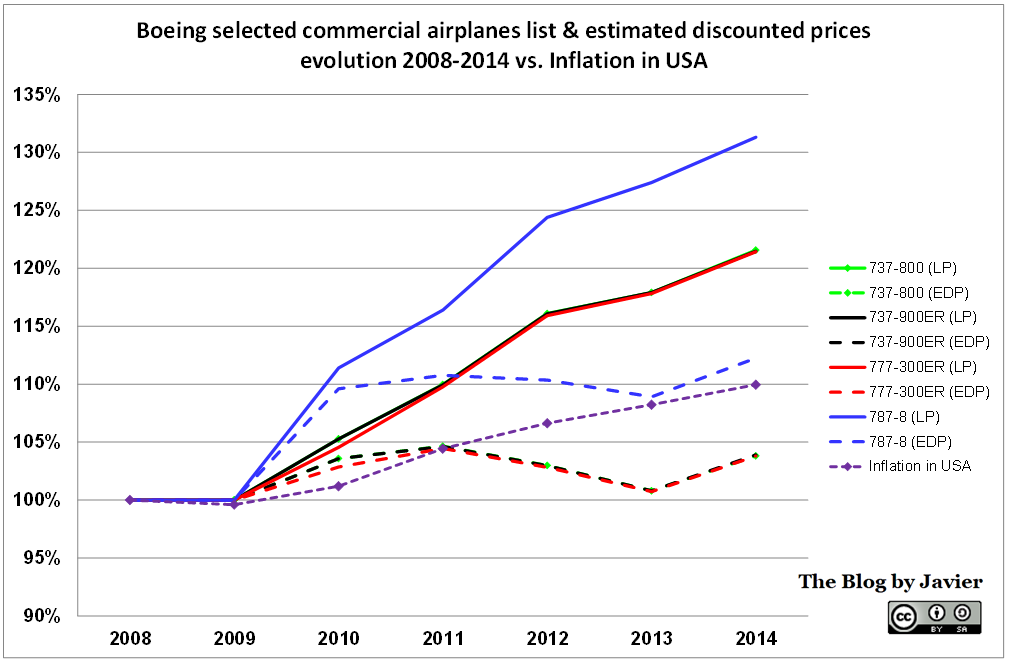
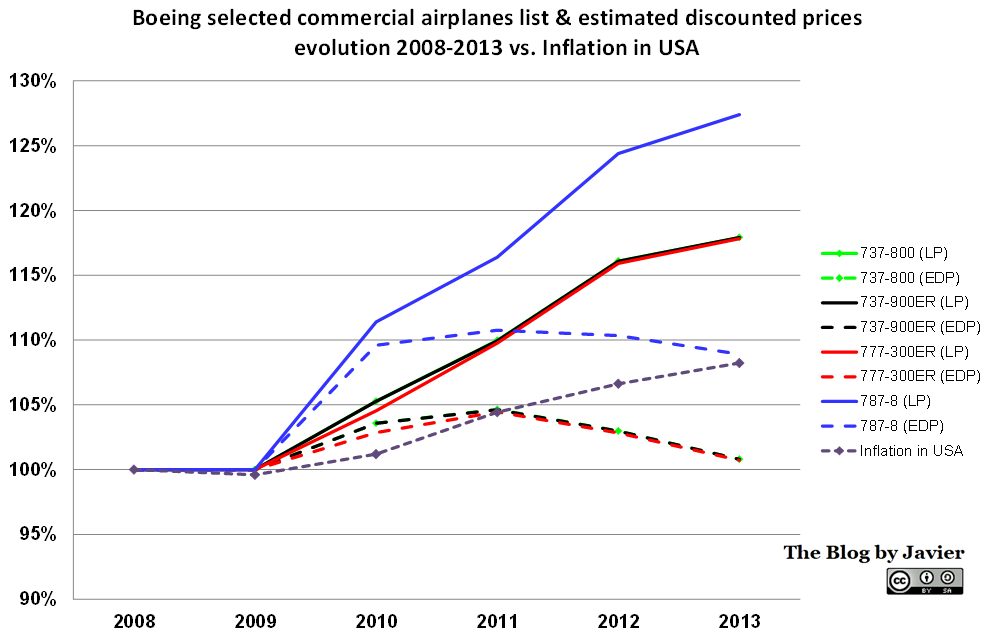
These list prices are, however, increased almost on a yearly basis by Boeing. Sometimes very steeply (+11.4% in 2010, from 2008) and other times more moderately (+2.4% in 2013 vs. 2012). Going into the future I assumed this increase to be constant and about equal to 2014′ increase, 3%.
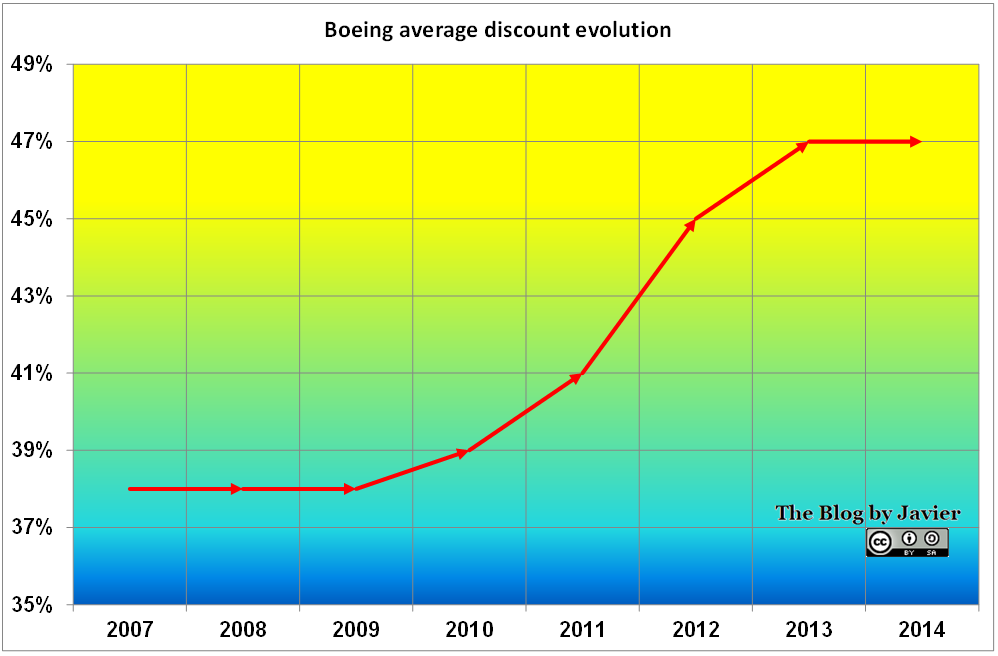
On the other hand, Boeing applies some discounts to its customers. These are never disclosed. Some are reported by some sources. What I do is to try to estimate an average discount from reported information. See a detailed calculation here. The latest figure that I arrived at was about 47%. Going into the future I assumed this discount to remain constant. You can see here the recent evolution of discounted 787-8 prices.
With all these ingredients, the only thing left is to plot together the recurring costs and recurring income:
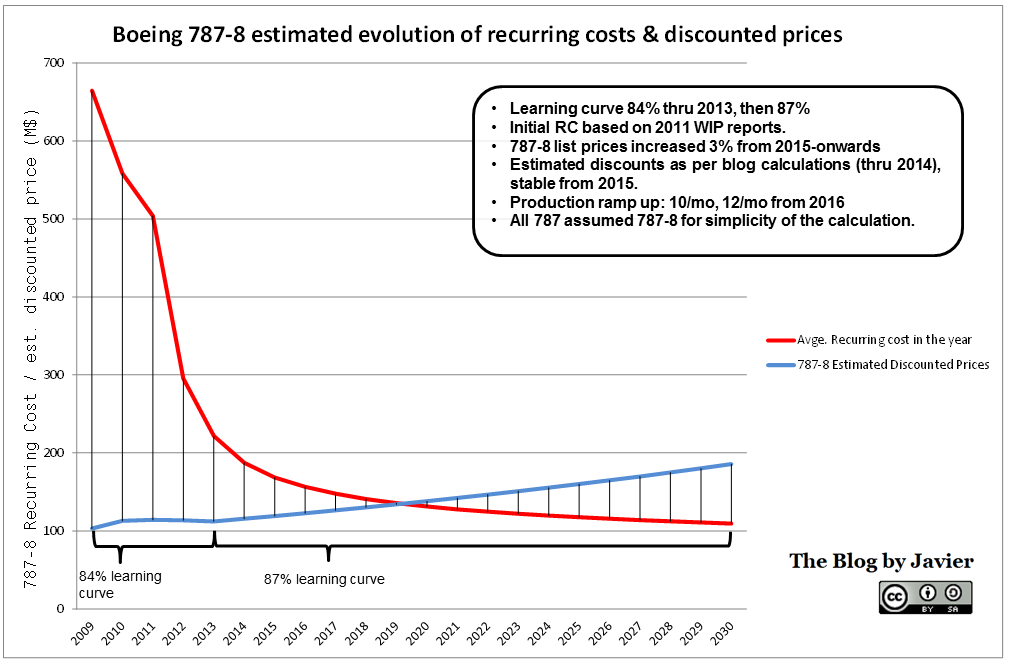
787 recurring cost vs. recurring income evolution.
As you can see recurring costs may be lower than recurring income at the end of 2019.
This will truly depend on the learning curve achieved, the number of units produced (3) and the pricing power Boeing manages to have. If the learning is steeper, the date will be sooner. If the ramp up is higher, the date will be sooner. If the discounts are lower or the list prices increased more, the date will be sooner. In any other case, either 2019 or beyond.
—
(1) See the complete series here: “Will Boeing 787 ever break-even?“, “More on Boeing 787 break even” and “787 Break Even for Dummies“.
(2) We will never know that figure. I wonder whether this is even known or registered (if not deleted and forgotten) within Boeing.
(3) For the numbers of units built I based the model in reported information that the ramp up to 12 aircraft per month is expected for 2016. I assumed that in 2015 they are at somewhere between 10 and 12 aircraft per month.