Berlin marathon breakfast run

One of the events that include some big marathons is a morning run the previous day, the so-called “breakfast run”.

When we ran the marathon in Paris, only our friend Serna attended that run. This time we went together and Luca and my brother Jaime waited for us at the end.

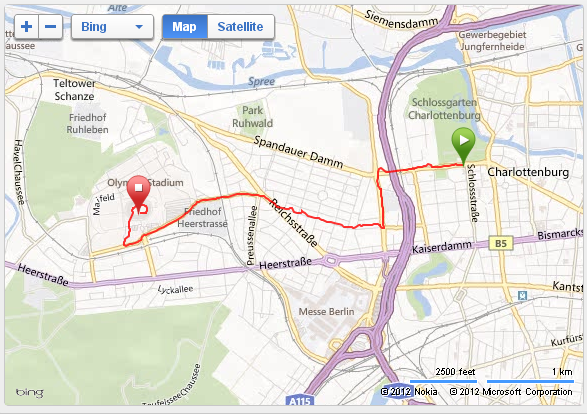
The run, a very easy run of almost 6 km, departed in front of the beautiful Palace of Charlottenburg and ended at the Olympia Stadion.

This stadium today hosts Hertha Berlin football matches, but it is better known as the stadium where the summer olympic games of 1936 were celebrated: the first ones televised, inaugurated by Adolf Hitler and the ones in which the athlete Jesse Owens won 4 gold medals.

See below some of the pictures we took during that morning run:

This slideshow requires JavaScript.

Hopefully the next time we’ll remember to bring either flags or a festive costume as many of the other runners typically do.

See the route we followed from the palace in Charlottenburg to the stadium as recorded by my Germin GPS:

Breakfast run route.

Finally, I found two interesting documents in relation to the stadium and the games:

  • The stadium plan [PDF, 1.7 MB] from today’s stadium website. In it you can see the location of the Maifeld (used for Hitler’s government celebrations and during the olympics for the equestrian events), the Bell Tower, the stadium and the Olympischer Platz.
  • The official report [PDF, 42.4 MB, 640 pages] of the games. It contains all kind of info about the International Olympic Committee at the time, hundreds of pictures of the Games and all of results of the different events.

1 Comment

Filed under Sports, Travelling

Berlin marathon

Last September 30th I completed the Berlin marathon together with my friend Serna and brother Jaime. This was the second marathon we ran together (the previous one being Paris 2012). The sixth one I ran.

Jose, Jaime and I in the runners’ fair.

The morning of the marathon I published a post in which I explained how I arrived at it in terms of training: I suffered an injury about 1.5 months prior to the race which didn’t allow me to practically train during the last month. Previously I had been training well and accumulating many kilometres.

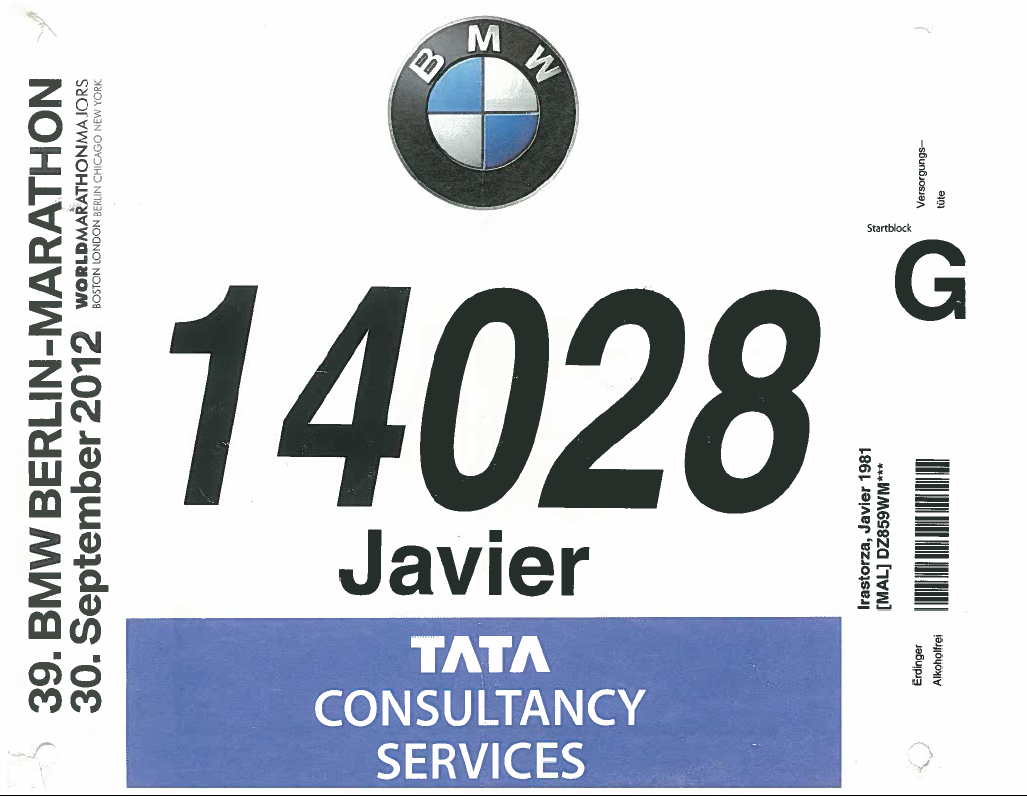
My bib number for the race:

My Berlin Marathon bib number: 14028.

You may see the route of the marathon and my performance as recorded by my Garmin GPS here:

My Berlin Marathon Garmin records.

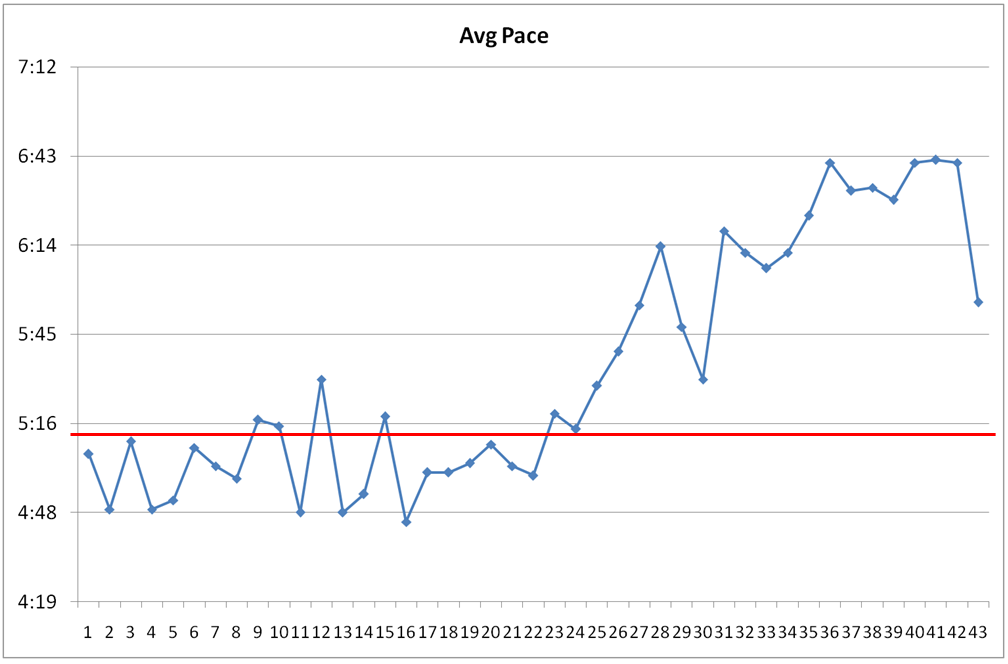
I started with a bracelet with references for a 3h40′ marathon, 5 minutes lower than in Paris. My plan was to start at that pace (5’13” per km) and keep it until I could. I was expecting that I would not be able to run the whole of it and that I would have to walk in case the Achilles tendon was hurting again. If that happened the later it occurred the better. Thus the faster I could go at the beginning the better for having to walk less distance at the end.

I did the half marathon in slightly above 1h47′, better than in Paris and was still feeling OK. Though at km 23 I started feeling hard to make kilometres under 5’20” (lack of speed endurance work and series in the last month)… I started to think of managing the margin I had built.

Finishing the marathon (km. 42).

However, 5 kilometres later I started to feel the ankle getting harder and some cramps in the quadriceps of the right leg (lack of kilometres and long runs in the last month). I then decided to slow down, otherwise I would have to start walking soon (when you get these cramps, the following step is feeling the muscle like a rock and not being able to run… experience from marathons 1 and 3).

From then on I clocked 6′ per km, then 6’20”, 6’35”, 6’40″… but I was still quite happy as at every kilometre I was making the numbers in my head: “if I keep this pace, I can finish in 3h53′ “, then “3h55′ “… I finally clocked: 3h57’48”, but at all times I knew I could complete it and that I was going to be under 4 hours, thus I just kept on running and smiling.

See the analysis of Garmin records by kilometre below. You can see how the pace was at each stage as I explained it above.

My Berlin Marathon running pace per km (mm:ss).

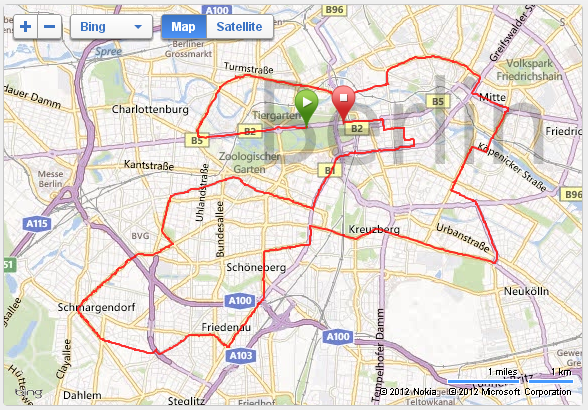
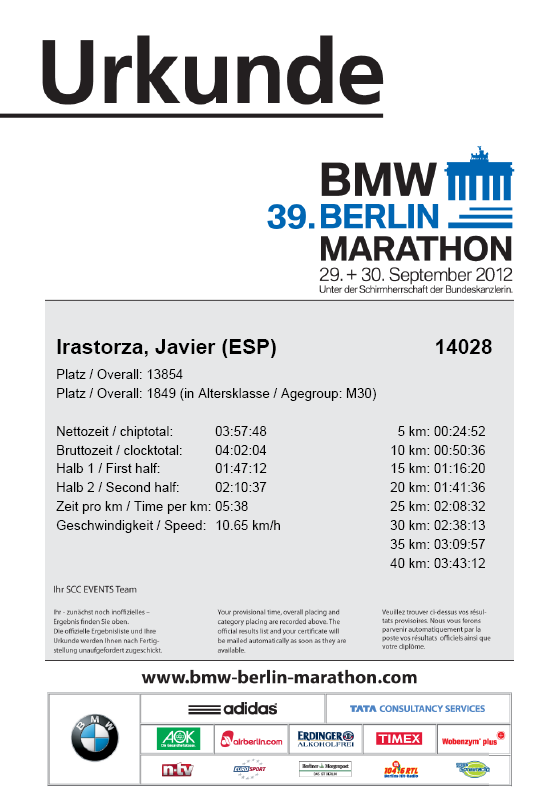
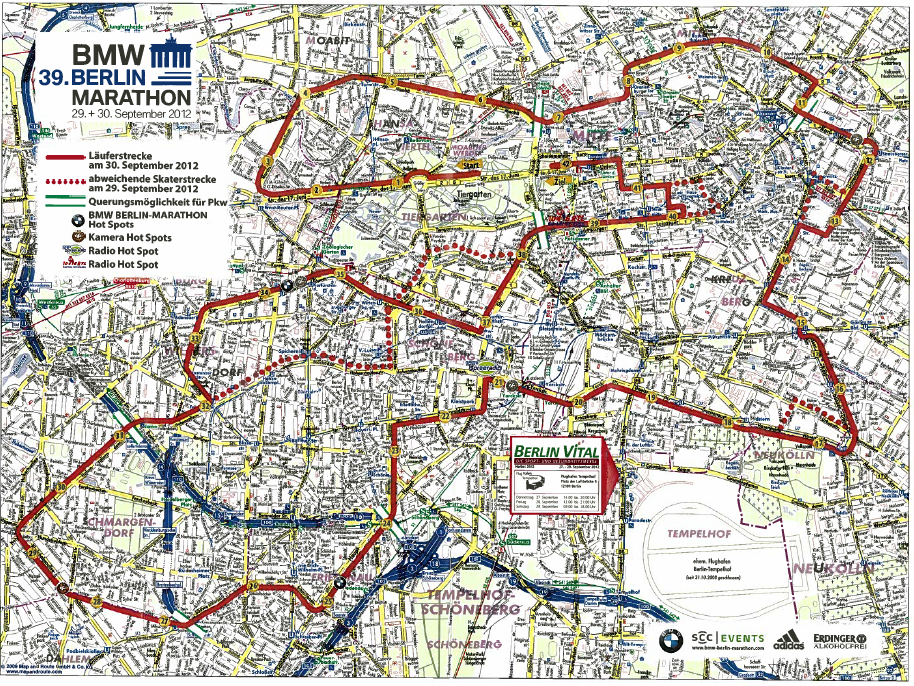
Two more pictures to complete this post: my finisher diploma and the detailed street map of the route.

Berlin Marathon detailed street map.

Next stop: Maratona di Roma, 17th March 2013.

5 Comments

Filed under Sports, Travelling

Foie gras poêlé

The picture below represents an all time high of my kitchen:

Cooking foie gras.

In fact it means an all time high of me in any kitchen. I have known the recipe since almost 2 years now. It took us 1 minute to cook it.

After this all time high, I am seriously considering to never cook again.

Leave a comment

Filed under France, Miscellanea

A hilarious anecdote of General Braxton Bragg (by U.S. Grant)

A small post to share a hilarious anecdote I read today in the “Personal Memoirs of Ulysses S. Grant” (which I started reading some months ago, and about which I expect to write further later on in the blog).

After relating how the Battle of Chattanooga was won, U. S. Grant explains in the book some key moves made by the confederate general Braxton Bragg, his personality, etc.

Bragg was a remarkably intelligent and well-informed man, professionally and otherwise. He was also thoroughly upright. But he was possessed of an irascible temper, and was naturally disputatious. A man of the highest moral character and the most correct habits, yet in the old army he was in frequent trouble. As a subordinate he was always on the lookout to catch his commanding officer infringing his prerogatives; as a post commander he was equally vigilant to detect the slightest neglect, even of the most trivial order.

I have heard in the old army an anecdote very characteristic of Bragg. On one occasion, when stationed at a post of several companies commanded by a field officer, he was himself commanding one of the companies and at the same time acting as post quartermaster and commissary. He was first lieutenant at the time, but his captain was detached on other duty. As commander of the company he made a requisition upon the quartermaster—himself—for something he wanted. As quartermaster he declined to fill the requisition, and endorsed on the back of it his reasons for so doing. As company commander he responded to this, urging that his requisition called for nothing but what he was entitled to, and that it was the duty of the quartermaster to fill it. As quartermaster he still persisted that he was right. In this condition of affairs Bragg referred the whole matter to the commanding officer of the post. The latter, when he saw the nature of the matter referred, exclaimed: “My God, Mr. Bragg, you have quarrelled with every officer in the army, and now you are quarrelling with yourself!”

… I tried to rationalize it: having those two hats at the time, Bragg might have wanted to leave in written a record of his request from one side and his denying of it from the other… seeing the reaction of the commanding officer, it seems that there wasn’t a rational side to it. 🙂

1 Comment

Filed under Books

Impuestos en Francia vs. España (actualización 2012)

Hace un año escribí una entrada en el blog comparando las tablas del impuesto sobre la renta (IRPF) en España y Francia. Durante 2012, esa entrada ha sido una de las más leídas. Sin embargo, desde que escribí aquel post ha habido cambios en los tramos debido a las subidas de impuestos del gobierno (en Francia, para 2012, las tablas se mantienen constantes). Por tanto, entendía que era necesario actualizar esa tabla con esta nueva entrada y una referencia en la entrada original a ésta. (*)

Tabla comparando tramos del impuesto sobre la renta en Francia y España (ref. ingresos de 2012)

Usaré para hacer la comparación el mismo ejemplo que en el post del año pasado.

Aclaración básica: la forma en que se interpretan los tramos es la siguiente. Por ejemplo, para un salario bruto de 35.000€, en Francia los primeros 5.983€ están exentos de retención (5.050€ en el caso de España), los siguientes 5.933€ (diferencia entre 11.896€ y 5.963€, en el caso francés) tienen una retención del 5,5%, los siguientes 14.524€ (diferencia entre 26.420€ y 11.896€, en el caso francés) tienen una retención del 14%, y así hasta llegar a los 35.000€.

En resumen, para un salario bruto de 35.000€, en Francia se pagarían 4.934€ (un 14,1%) y en España, 8.520€ (un 24,3%). En Francia se pagarían por tanto 3.586€ menos en impuestos sobre la renta (un 10% menos).

Como veis, en Francia el impuesto sobre la renta (“IRPF”) es menor en cada tramo. La contribución que hacen los trabajadores a la Seguridad Social es sin embargo mayor (algún día pondré esa comparación), con lo que al final las cantidades son similares.

En el post del año pasado la cifra de impuestos en España resultaba 8.131€ (un 23,3%) frente a los 8.520€ (24.3%) de este año. Es decir, para alguien con un salario bruto de 35.000€ la subida de impuestos se traduce en un ~1%, o algo menos de 400€ (que ya habrá notado en las retenciones que practican las empresas).

***

(*) Mantendré la entrada original, con la tabla desactualizada, para que quede a modo de histórico y se pueda comparar con la nueva.

4 Comments

Filed under Economy

Soccernomics

Soccernomics.

If you love football (soccer) and have read one of the books of the “Freakonomics” saga or any book from Malcolm Gladwell, then “Soccernomics“, by Simon Kuper and Stefan Szymanski (430 pgs.), will be a great read for you.

The book is written in the same style as the other books mentioned above: using economics’ techniques, plenty of data, statistics, citing several papers, studies, etc., in order to bring up uncovered issues about football or refocus the attention about other ones. Some examples:

  • Mastering the transfer market. Departing from the example of Billy Beane in baseball, described in “Moneyball“, by Michael Lewis (of which a movie was also made starring Brad Pitt), the authors show how pouring money in transfer markets doesn’t bring titles. The key issue is to have a balanced net investment (sales/acquisitions). In soccer the main example would be Olympique Lyon which will “sell any player if a club offer more than he is worth”, for which each player is previously assigned a price (much like value investing).
  • The more money is paid to players the better (in salaries). Instead of buying new expensive players it seems to make more sense to pay well and ensure the adaptation of the stars already playing for the team.
  • The market for managers is not yet very open (e.g. no black coaches in main European teams), thus many of them do not make a real difference. There was even an English team Ebbsfleet United who dispensed the coach and allowed subscribed fans to vote the player selection for each match.
  • The book, written at the beginning of 2012 forecasted that soon teams from big European capitals would win the Champions’ League, being those capitals: London, Paris, Istanbul and Moscow. Few months later Chelsea won its first one, let’s see the others.
  • The main factors for the success of football national teams seem to be the experience (international games played by the national team), wealth and population.
  • The authors give much weight to Western Europe dominance of football due to the interconnectedness of continental Europe. Explaining the rise of Spain in the ’90s and ’00s due to its growth in population, improved economy since joining the EU, more experience and exchanges of styles with coaches of other countries.
  • The authors claim that future national football will be dominated by countries such as Iraq, USA, Japan or China.

As you can see there are many different topics, all with some data to support them (even if sometimes you doubt about the consistency of their claims, e.g. their statements on industrial cities as dominating football, dictatorships, etc.). I marked many pages with some anecdotes or papers that I would like to read.

One final anecdote: tips given to clubs and teams in KO competitions in case they face a penalty shoot-out. In the Champions’ League final of 2008, Chelsea and Manchester United reached the penalties. An economist had given Chelsea a study of Manchester goal keeper and penalty-shooters. Once you read the book and the tips the economist provided (“Van der Sar tends to dive to the kicker’s natural side”, “most of the penalties that Van der Sar stops are mid-height, thus is better to shoot low or high”, “if Cristiano Ronaldo stops half-way in the run-up to the ball chances are 85% that he shoots to his natural side”…), it is quite interesting to actually see that penalty shoot-out and how the different players acted.

[Pay special attention at Van der Sar’s reaction at 09’40”, when it seems he noticed about Chelsea having been tipped]

I definitely recommend this book to football fans. I also recommend two other books about which I wrote in the blog some time ago: “How soccer explains the World” and “Historias del fútbol mundial“.

8 Comments

Filed under Books, Sports

Good morning, Berlin!

This morning, as this post is being published I’ll be starting the 39th Berlin marathon, together with my friend Serna and brother Jaime.

At mid-point through the training, beginning of August, I wrote a post about the good amount of kilometres I had been able to train in July. Two weeks later I got injured in the Achilles tendon when training in the hills of Torrelodones. I took a one-week rest and slowly re-started training. That week finished with a 10k race in Colomiers where I achieved a new PR in the distance but got pain in the same tendon again.

I took a 10-day rest and tried to run again: 3.5km, 7km and then 12km… but got the pain back and had to cancel my participation in Toulouse half marathon.

As you can see in the graphic below, the training season can be divided in 3 weeks of getting into the habit, 7 weeks of good training and 6 weeks of struggling to recover, plus few days of running and swimming.

Berlin training season. Kilometres run per week and average heart rate (bpm).

During the season I should have run over 1,000km, but in the end I have only completed 643km. This is more than I could run in preparation for the last marathon in Paris, but this time I arrive to the starting line without having run recently and the bunch of the training was done more than a month ago…

As Jaime says, this time the race will not be about the time, but just about trying to complete it… a day for the epic.

Lastly, I wanted to raise awareness about one thing I love of some races: the support of charities and NGOs. We subscribed to this marathon last year and, when doing so, each of us contributed with 42€ (1 € per km run) to the charities supported by the organization.

2 Comments

Filed under Sports

En España en 2007 más de la mitad de los declarantes obtuvieron ingresos por debajo de la media

En el último post publiqué un cálculo de cuáles fueron los ingresos medios en España en 2007 a partir de las declaraciones del IRPF de aquel año. El resultado, 17.116€, debe ser algo inferior a los ingresos medios reales, debido a los efectos de las deducciones que se aplican a la hora de calcular la declaración de la renta (ver NOTA en dicho post).

En este post, sin embargo quiero usar aquellos datos para poner un ejemplo de media, mediana y moda, como epílogo a un comentario de otro post que publiqué la semana pasada (sobre como unos datos de ingresos en EE.UU. se reflejaban en un periódico) y una conversación con un compañero de trabajo.

Usaré la siguiente gráfica, que resume el post anterior:

Declarates de IRPF en España en 2007 por tramo de ingresos.

En la gráfica se puede ver:

  • la cantidad de declarantes por cada tramo de renta (columnas en gris),
  • la “media” de ingresos calculada para cada tramo (líneas negras)
  • la media de ingresos del total de declarantes (línea roja), 17.116€.
  • la “moda” de ingresos, esto es, el dato que más se repite, y que a falta de más datos cogeríamos la media del tramo donde más declarantes hay, i.e., 11.755€ (línea negra gruesa).
  • la “mediana” que se encuentra en el percentil 50 y separa la mitad de declarantes que más ingresos declara de la mitad que menos ingresos declara, en este caso y a falta de más datos dentro de cada tramo, de nuevo habría que asimilarla a la media del tramo donde más declarantes hay, i.e., 11.755€. (Por encima de ese tramo, 12-21k€, declaran 6,2 millones de personas y por debajo 7,3 millones).

Luego en España, en 2007, y dado que la media del total de declarantes (17.116€) es bastante superior que la mediana (11.755€), aun estando ambas dentro del mismo tramo (12-21k€ – ver NOTA del post anterior), más de la mitad de los declarantes obtuvieron ingresos por debajo de la media (posiblemente la cifra estuvo en torno al 60%).

2 Comments

Filed under Economy

Ingresos medios en España en 2007: 17.116€

Hace unos días publicaba una serie de tablas que recopilé 2007 sobre la economía española. En una de ellas aparecían datos sobre la declaración del impuesto sobre la renta de las personas físicas (IRPF) de 2007: número de declarantes en cada tramo, importe abonado por los declarantes de cada tramo, media por declarante…

El primer post a publicar a partir de esa tabla era inmediato: ¿cuál era el salario medio en España en 2007 a partir de los datos de la declaración del IRPF?

Primer paso: encontrar cuales eran los tramos del IRPF del año 2007 (hay que notar que estos tramos son diferentes a los 2010, que publiqué en otro post, y a los de 2012 – que tendré que comparar algún día con los de Francia en 2012).

Tramos de IRPF en 2007 (fuente: El Economista).

A partir de los tramos, se puede ir calculando el importe abonado por los declarantes en cada tramo; es decir, alguien que declaró 35.000€:

  • no pagó por los primeros 5.050€ (“mínimo vital”).
  • pagó un 24% por los 12.310€ entre el mínimo vital y los 17.360€ del límite del tramo.
  • pagó un 28% por los 15.000€ del siguiente tramo.
  • pagó un 37% por los 2.640€ del siguiente tramo (de 32.360€ a sus 35.000€).

Según lo que los declarantes abonan en cada tramo y el tipo en cada tramo, se pueden calcular los ingresos medios declarados en 2007 para cada tramo y para el total. Es decir, el ingreso medio en España en 2007 para los casi 19 millones de españoles que completaron la declaración de la renta. Adjunto debajo la tabla resultante:

Ingresos medios en España en 2007 calculados a partir de los datos de la declaración del IRPF de 2007.

El resultado: el ingreso medio declarado en 2007 fue de 17.116€ (ver nota).

El paso siguiente también es obvio, buscar entre las fuentes y dar con el dato de 2010, que debería estar disponible.

***

NOTA: En la tabla incluyo un par de comentarios. En el segundo menciono que tras realizar el cálculo para los tramos de 12 a 21k€ y de 21 a 30k€ resultan unos ingresos medios menores que el mínimo del tramo. Este resultado es incoherente. Entiendo que debe ser por deducciones que el declarante obtiene por su situación personal (hipotecas, personas a su cargo), por tanto, este método es insuficiente para obtener un resultado final, ya que dichas deducciones pueden minorar el importe pagado en cantidades no despreciables en los tramos inferiores (para los tramos superiores, las deducciones suponen un porcentaje menor).

1 Comment

Filed under Economy

World commercial aircraft fleet: forecast vs. actual

Some weeks ago I made a comparison about Airbus and Boeing aircraft market forecasts. Last week I published a couple of posts about the evolution in the forecasted aircraft average size and on the accuracy of these market forecasts. For this, I looked for old issues of Boeing Current Market Outlook from as back as 1990.

The next step then it was obvious, I compiled the following graphic showing with the data available information over a 40-year span on:

  • The evolution of world commercial aircraft fleet year by year (blue line) from 1995 to 2011,
  • The forecasted world aircraft fleets by Boeing CMO (red line) from 2000 to 2031 (with some gap years). For 2015 to 2031 the forecast was made 20 years ahead; for 2010-13 it was made 15 years ahead; for 2005-2008, 10 years ahead and for 2000-2003, 5 years ahead.
  • The published 20-year aircraft market forecast year by year.

World commercial aircraft fleet: forecast vs. actual (data source: Boeing CMO).

As you can fleets, forecasted fleets and market fleets have all been increasing year by year. The compounded annual growth rate (CAGR) for each one has been:

  • Actual fleet growth: 3.73% from 1995 to 2011 (2.88% from 2000 to 2011).
  • Forecasted fleet growth: 3.55% from 2000 to 2031 (3.69% from 2000 to 2011).
  • 20-year market forecast: 5.07% from 1992 to 2012 (3.43% from 2001 to 2012).

It is interesting to see that in those years when there is both figures for actuals and forecasted fleets the figures are close (-3.3% average deviation) and so is the trend, though forecasted fleet was lower at the beginning of that period (-7.2% in 2000) and grew at a higher rate until almost matching the numbers in 2011 (+1.2%).

Even though, the 20-year market forecasts have grown at a higher rate than fleets, it is mainly because the first data that I could retrieve come from the economic crisis of the beginning of the 1990’s, when Boeing trimmed down its forecasts. From the 2000’s the figures for market forecast have grown at a similar rate than those of fleets. And so will be the growth of forecasted fleet from 2011 to 2031: 3.5%.

****

Notes:

  • 1990 CMO long-term market forecast is made for 15 years, not 20.
  • Forecast of fleet for the periods 2000-2003, 2005-2008 and 2010-2013 does not come from CMOs published 20 years before, but from 5, 10 and 15-year fleet forecasts included in the CMOs of 1996, 1997, 1998 and 1999.
  • Boeing does not publish 5, 10 and 15-year fleet forecasts anymore.
  • It would be interesting to have a per-segment graphic, however there is not consistent data to produce it for the same time span. Boeing changed singe-aisle cut-off seat size from 1999-2000, in 1996-1997 and 2008 didn’t report the split within twin-aisle, in 2008 it also didn’t report the split within single-aisle.

2 Comments

Filed under Aerospace & Defence