So much for composites…

Few weeks ago I was talking to a stress engineer from Eurocopter Spain about the different activities they performed. He was looking forward to the future work in relation to the latest EC 175, a helicopter built in cooperation with China for civilian and parapublic markets, mainly to support oil and gas exploration and search and rescue missions.

“At last we’re back to metal structures…”

He mentioned this in relation to apparent problems given by composites ones in their use in helicopters. This reminded me of a teacher (at engineering school) and former (very senior) colleague at Airbus Military, who was never seduced by the massive application of composites and he always called for their introduction following his mantra:

“Technology (in the context of application of science), is the most powerful means to increase the effectiveness-to-cost ratio.”

Which not always calls for the use of the latest technology available.

So much for the hype of composites…

Leave a comment

Filed under Aerospace & Defence

Looking at History through US Foreign Military Sales

If an alien came to Earth and had to quickly make sense of the last half century of History, he could get a first glimpse of geographical hot spots and changes of regime by looking at US Foreign Military Sales program data (please refer to my previous post for an explanation of the program and sources of data).

For example, take the figure below. It shows the historical data of FMS deliveries (in thousands of $) from 1970 to 2010. As you can see deliveries stopped in 1980. What is even more telling, in the 4 years to 1979 (from 1976-79) the arms sales delivered to this country represented a whole 34% of the complete US FMS program over that period (see the total volume of deliveries in this graphic from a previous post). Which country do you think it coud be?

Which country could this be?

This alien, combining these data would know that something that happened in that country, from representing a third of military sales to not taking part in the program ever again… you may have guessed right: Iran, where the Islamic Revolution started in 1978, the Shah left the country in 1979 and at the end of that year the hostage crisis started.

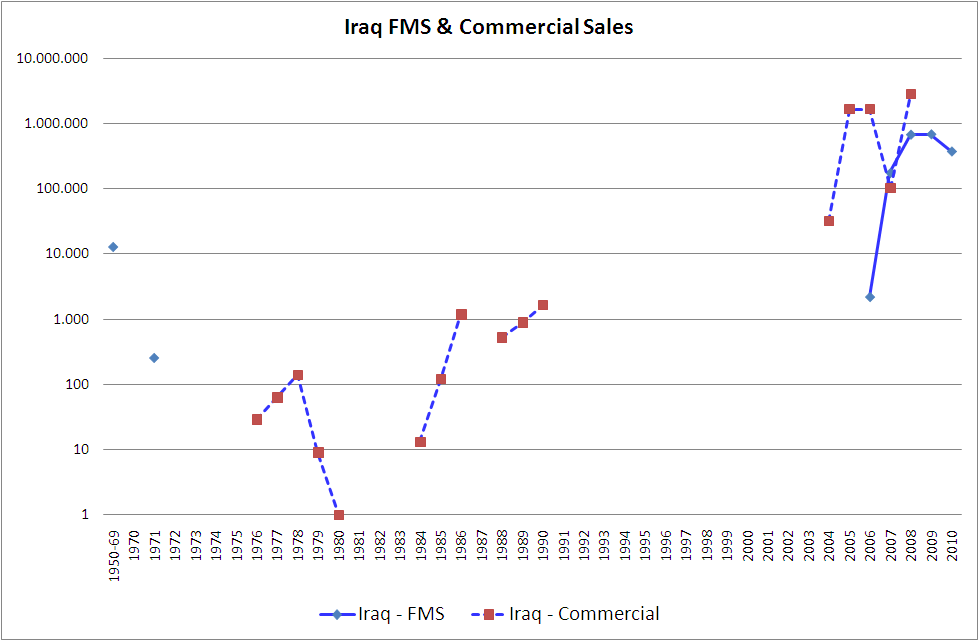
Having taken a look at the graphic of Iran, find below the one for Iraq:


In the graphic you can see that from 1970 to 2005 there were not FMS agreements and deliveries from 2006. Nevertheless you can see that during the 1970’s and 1980’s there were commercial arms sales to Iraq from American contractors (this is also published by DSCA), which deliveries stopped altogether in 1990 (invasion of Kuwait in August 1990 and subsequent first Gulf war). Then, once the second Gulf war had changed the regime, commercial and FMS sales restarted from 2003.

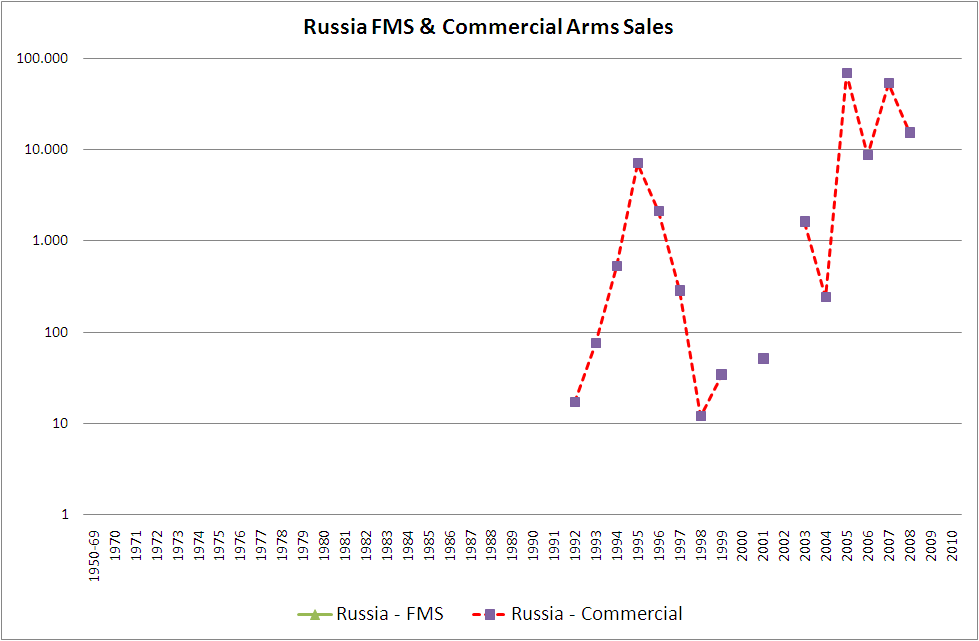
There are plenty of cases to look at: Cuba not forming part of FMS since before 1970, Russia neither (though receiving commercial arms since 1992), Spain having been always part of FMS program (including during dictator Franco’s time) but which agreements surged in 1982 with the order of 72 McDonnell Douglas F/A-18 fighters (the same year in which it joined NATO), Chile, Venezuela, China

Russia: never part of FMS.

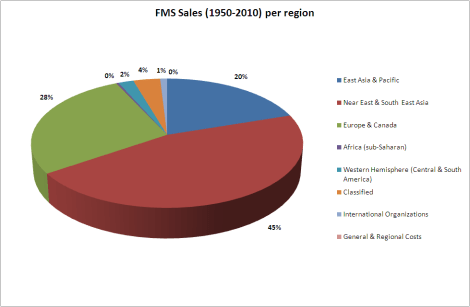
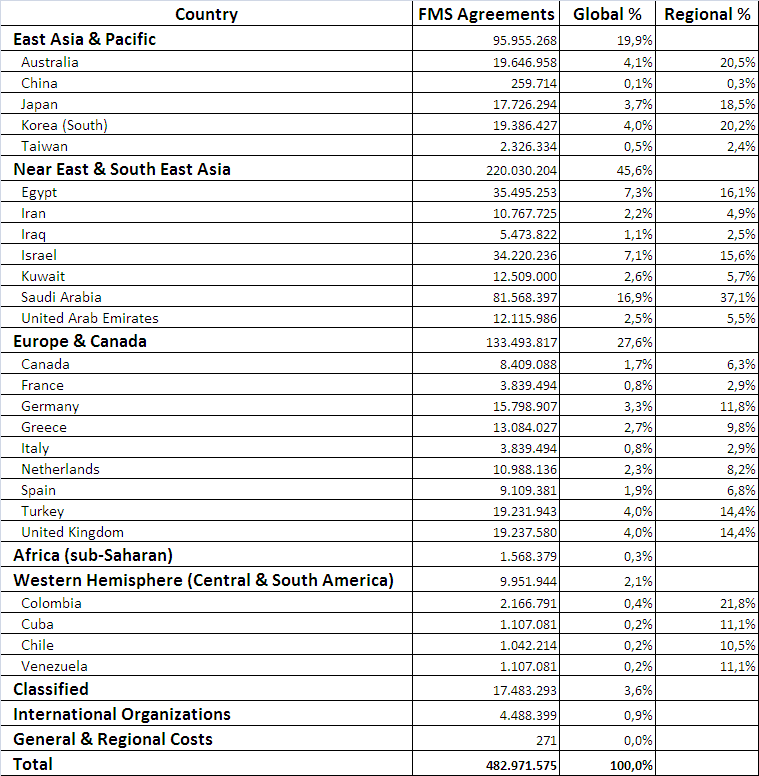
Before concluding this post let me show again the distribution of FMS deliveries during the last 60 years per region (shown in the previous post) and a table with the main receivers in each region:

FMS Sales per region (1950-2010, source: DSCA).

FMS Agreements per region and selected countries (1950-2010, in k$ – source: DSCA).

Which have been then the top receivers of FMS Arms sales agreements in the period 1950-2010? In order:

  1. Saudi Arabia (16.9% of global FMS program)
  2. Egypt (7.3%)
  3. Israel (7.1%)
  4. Australia (4.1%)
  5. Korea (South) (4.0%)
  6. United Kingdom (4.0%)
  7. Turkey (4.0%)
  8. Japan (3.7%)
  9. Germany (3.3%)
  10. Greece (2.7%)

Leave a comment

Filed under Aerospace & Defence

US Foreign Military Sales

The Foreign Military Sales (FMS) is a program managed and operated by US Department of Defense (DoD) on a no-profit and no-loss basis. Countries and international organizations participating in the program pay for defense articles and services at prices that recoup the actual costs incurred by the United States. This includes a fee (currently 3.8% of what the defense articles and/or services cost, in most instances) to cover the cost of administering the program.

Foreign countries may also opt to procure directly from American contractors in Direct Commercial Sales, though FMS ensures third countries rates similar to those received by the DoD (bargaining power) but the items will be the standard procured by the USA, not especially tailored to the needs of other countries. In any case the sales will have to pass the same approval requirements for the sale of defense materials to third countries.

The Defense Security Cooperation Agency (DSCA) is the one managing this program and the one which publishes the different deals (Major Arms Sales Notification and FMS Contract Awards).

The DSCA also publishes historical data of the FMS sales by year and per country and region. (I have always admired the openness of the different US agencies in their publishing of data to work with).

In the graphic below you can see the total US arms sales agreements with foreign countries and FMS-program agreements during the last 40 years.

Total Military Sales (*) and FMS-program agreements (in k$) per year.
[(*) Total Sales includes foreign sales not made through FMS program]

You can see how most of the agreements are close within the FMS program, which ensures moderate costs to the third countries and a standardization for US allies. You can notice as well how the first Gulf war and the recent wars in Irak and Afghanistan have increased FMS agreements.

However, given that military equipment takes time to build, there is a lag between those sales agreements and when the arms are delivered. See below the two lines representing FMS agreements and FMS deliveries (both in k$).

FMS (in k$): agreements vs deliveries per year.

You can see how the deliveries show a growth trend since the 1970’s, with peak at the end of ’90s.

The following question is: to which countries were those sales…

FMS Sales (1950-2010) per region.

I will end this post with this graphic, showing how the Middle East (“Near East & South East Asia”) is the region which received the most of FMS during the last 60 years. In a following post I will dive into which specific countries as that is a very interesting analysis deserving a single post.

4 Comments

Filed under Aerospace & Defence

Crowdfunding science

I have written sometimes in the blog about crowdfunding. How I started funding loans for small entrepreneurs in developing countries via Kiva, or how I invested a small amount in the movie project “El Cosmonauta”, and more generally I have shared yearly contributions to other non-profits.

I heard for the first time about crowdfunding science some time ago, but didn’t keep track of it. Thus, when I read the last week in The Economist an article featuring some platforms where to crowdfund science I decided to take a look at those and to post about it in the blog. The purpose of the post is twofold: raise awareness about an initiative that I support (even if not yet with money) and to let myself keep track of them from now on.

The article mentions 4 platforms. Two of the platforms look more science-focussed and the other two more generalist:

  • Petridish: “Petridish lets you fund promising research projects and join first hand in new discoveries.”
  • Microryza: “We’re researchers and scientists. We live and breathe this stuff. We know that too many important research ideas go unfunded. So we created Microryza. We believe that the discoveries made through research help make the world better, that researchers should keep 100% ownership of the research and results, and that a community of people who care about science is all that’s needed to help seed fund new ideas.”
  • Rockethub: “RocketHub is the world’s funding machine. RocketHub is an international and open community that has helped thousands of artists, scientists, entrepreneurs, and philanthropists raise millions of dollars. We offer an innovative way to raise money (Crowdfunding) and tangible opportunities to take creative products and endeavors to next level (LaunchPad Opportunities).”
  • Indiegogo: “Everyone should have the opportunity to raise money. Now everyone does. People all over the world use our industry-leading platform to raise millions of dollars for all types of campaigns. No matter what you are raising money for, you can start right now with no fee or application process.”

I will let you know the moment I opt to engage with a particular scientific research :-).

Note: I leave aside the debate of whether budget for science should be ensured by the states.

Leave a comment

Filed under Investing

How high are high taxes?

Taxes are often the subject of heated discussions. Nobody enjoys paying taxes, even if we understand that they’re needed to pay for some state services that otherwise we would not have.

People especially hate when taxes are raised. In Spain income taxes, VAT taxes and some other minor taxes or the cost of public services have been raised recently. In France there is a heated debate on whether the maximum personal income tax rate could be raised up to 75%. A similar heated discussion takes place in the USA about the effective taxes rate paid by the superrich, the top 1%, the top 0.01%… you name it.

You will hear people either claiming that taxing more the rich is what is to be done or that increasing taxes will not forever increase tax revenue collection (the famous Laffer curve); that investors, job creators, etc., will be deterred by the high taxes and take their wealth elsewhere.

Firstly, I am no expert on taxes.

However, seeing today’s tax rates levels (be it Spain, France or the USA), the heated discussions we witness and having had some conversations either with friends or colleagues on taxes, I thought it could be interesting to post in the blog some historical evolution of the different tax rates, just to put in perspective what is high taxes.

I have taken all the graphics from the Wikipedia and all refer to the case of the USA (the one for which there is always more data available). You can see below the evolution of personal income tax rate for the highest and lowest earners, of taxes on capital gains and corporate taxes.

Personal Income Taxes (what in Spain would be IRPF).

You can see in the picture below how the maximum tax rate was for some time above 90% (now is 35%). You can check yearly data on the different tax brackets in the Tax Foundation. In those years with brackets above 90%, maximum effective tax rates were around 70-88%.

“Historical Marginal Tax Rate for Highest and Lowest Income Earners” in USA, from 1912 to 2008 (by Guest2625)

Capital Gains Taxes.

You can see in the picture below how the maximum tax rate was for some time 35% (now is 15%). This is the tax that applies to most of the income of those superrich as they earn it via their investments.

Maximum Federal Tax Rate on Long Term Capital Gains (1972 – 2012) (by Guest2625)

Corporate Taxes.

These are the taxes on corporate profits. You can see in the picture below how the effective tax rate has been continuously decreasing from above 40% in the ’50s (now is under 20%).

US Effective Corporate Tax Rate 1947-2011 (by Guest2625)

Those were the rates.

Then there is a whole lot of studies proving either point or the other. That higher taxes provoke lower investment or the contrary. That higher taxes reduce tax collection or the contrary. That higher taxes reduce growth or the contrary. Pick your study and support your argument. You may have to look for one variable and hide another, pick a country and forget another, pick a decade and not the one before or after. It doesn’t matter, I guess any point can be proven.

Let me finish by sharing two more graphics, obviously handpicked, and a quote:

Top Capital Gains Tax Rates and Economic Growth 1950-2011 (by Leonard Burman).

Capital Gains Taxes and Real Investment (by Jared Bernstein).

From Warren Buffett’s op-ed  “Stop Coddling the Super-Rich” in the NYTimes (Aug. 11, 2011):

“I have worked with investors for 60 years and I have yet to see anyone — not even when capital gains rates were 39.9 percent in 1976-77 — shy away from a sensible investment because of the tax rate on the potential gain. People invest to make money, and potential taxes have never scared them off.

1 Comment

Filed under Economy

Holocaust Memorial (Berlin) and unintended consequences

The Holocaust Memorial or Memorial to the Murdered Jews of Europe was inaugurated in Berlin about 7 years ago close to the Brandenburg Gate.

If you see the following picture from Wikimedia, you get a glimpse of what could be a huge cemetery of concrete slabs.

Holocaust Memorial (by de:Benutzer:Schreibkraft).

The memorial is described in the Wikipedia with the following words:

“It consists of a 19,000 square metres (4.7 acres) site covered with 2,711 concrete slabs or “stelae“, arranged in a grid pattern on a sloping field. […] According to Eisenman’s project text, the stelae are designed to produce an uneasy, confusing atmosphere, and the whole sculpture aims to represent a supposedly ordered system that has lost touch with human reason.

However, the memorial is not to be contemplated from the air as seen above, but from the ground and people can walk through it.

If you visit the site you’ll experience or watch some unintended consequences:  people tend to sit on the stones, run between them, jump from one to another, play “hide and seek”… the least people do is to experience with light and shadows, distances, slopes…

This slideshow requires JavaScript.

Then there is a poor security guard calling on people (sometimes bunches of playful students) to “behave”, not to run, jump, etc.

1 Comment

Filed under Travelling

Water counters, water price and incentives

Take a look at the water counter in the picture below:

Water counter at hostel.

We found these water counters at the hostel we were lodged in Berlin. I immediately started taking note of how many litres I consumed in each of the showers I took. First one:

I checked in the internet and found references of average consumptions for showers between 80 and 120 litres. The following days I tried to save some water (of course without compromising the cleaning part :-)). The minimum consumption I had was of 34L, the rest in the end were around 42L.

In the process I discussed with Luca whether hotels could incentivize in some ways (other than displaying the counter at our sight) the saving of water by the guests. We thought of possible messages in the way of “the average guest consumes 100L per shower, see if you can use less water! Do it for the planet!”, or whether some discounts / surcharges could be offered / imposed to those consuming less / more water.

However, I checked water prices in France and in Toulouse and it is around 3.3€ per cubic metre (m3). That is, in 5 days, having seen the counter and having tried to minimize water consumption all I saved was about 0.38 m3 or about 1.25€… this is economically meaningless in comparison with the hotel bill.

At those prices, I guess all we could do is trying to save water out of our consciences and not driven by an economic drive (the same level of saving I achieved could mean ~35€ a year per person).

1 Comment

Filed under Economy, Travelling

Old Berlin key lock system

During our last stay in Berlin we were lodged at a hostel in Fasanenstrasse, close to Kurfürstendamm (Charlottenburg). The pension was in an old building which was protected by some urbanism laws which prevented the owners to perform some works.

Thus, the building maintained a curious key lock system at the front door which was activated by night. The key was double sided as it can be seen in the picture below.

Old Berlin front door key.

In order to open the door you would have to introduce the key in the lock, unlock it and then fully insert the key in the door until it would appear in the interior of the house. You would then have to lock it from the inside and remove the key from the inside by pulling from the other end of the key.

We found it funny and curious, so we recorded this short video showing the system:

2 Comments

Filed under Travelling

Berlin Tempelhof Airport

Berlin Tempelhof Airport was one of the spots that we wanted to visit in Berlin. The airport was built in the 1920’s and had been an iconic airport for decades, e.g., by the famous Berlin Airlift which with the allied forces supplied West Berlin once surface traffic was blocked by the Soviet Union in 1948.

Other historic events happening in the airport (quoted from Wikipedia):

In 1909, Frenchman Armand Zipfel made the first flight demonstration in Tempelhof, followed by Orville Wright later that same year. Tempelhof was first officially designated as an airport on 8 October 1923. Deutsche Luft Hansa was founded in Tempelhof on 6 January 1926.

[…] described by British architect Sir Norman Foster as “the mother of all airports”.

The airport closed operations in 2008.

The coincidence was that the Berlin marathon fair was organized at Tempelhof thus we didn’t need to schedule the visit since we would go there to pick the running bibs.

See below some pictures from the airport.

This slideshow requires JavaScript.

I had some fun with my brother remembering that the airport is also featured in the movie “Indiana Jones and the Last Crusade” (when they get into a zeppelin). I tried to find in Youtube some scenes in which the airport could be recognised, but the only scene that I find related to it is when Indiana and his father are already aboard the zeppelin:

3 Comments

Filed under Aerospace & Defence, Travelling

East Side Gallery (Berlin)

A whole decade has passed since the first time that I visited Berlin with my brother. This time again, we dedicated some time to visit some touristic highlights. I will write some posts in relation to that visit.

This first one will be dedicated to the East Side Gallery. From the Wikipedia:


The East Side Gallery is an international memorial for freedom. It is a 1.3 km long section of the Berlin Wall located near the centre of Berlin on Mühlenstraße in Friedrichshain-Kreuzberg. […]
The Gallery consists of 105 paintings by artists from all over the world, painted in 1990 on the east side of the Berlin Wall. […]
It is possibly the largest and longest-lasting open air gallery in the world. […]
The paintings at the East Side Gallery document the time of change and express the euphoria and great hopes for a better and free future for all people of the world. […]

The wall has been damaged by several reasons and gone through subsequent series of restorations.

See below some pictures from the East Side Gallery (status from September 2012):

This slideshow requires JavaScript.

1 Comment

Filed under Travelling