In the previous two posts I introduced the concept of learning curve and provided a case in point (based on figures attributed to A350 FAL by Leeham News). In the first of those posts, I discussed that:
Boeing does not disclose outright what is the actual learning curve it is achieving in its program. Nevertheless, in its investor relations conferences it provides information here and there of cost savings achieved, etc. This can be interpreted as derived from learning curve effects, and would permit to build a model, even if based on scarce information.
Let me quote again one of those excerpts from Boeing executives:
“We continue to see progress in key operational performance indicators and unit costs, as we further implement production efficiencies and stabilize the overall production system on the 787 program. Unit cost has improved approximately 20% over the past year on the 787-8 […]“, Greg Smith, Boeing EVP – CFO at Q4 2013 Earnings Conference.
To the avid reader, and knowledgeable and savvy analyst, this paragraph is enough to deduce the actual learning curve achieved by the 787 during 2013, provided that information reported by Boeing CFO, Greg Smith, was accurate.
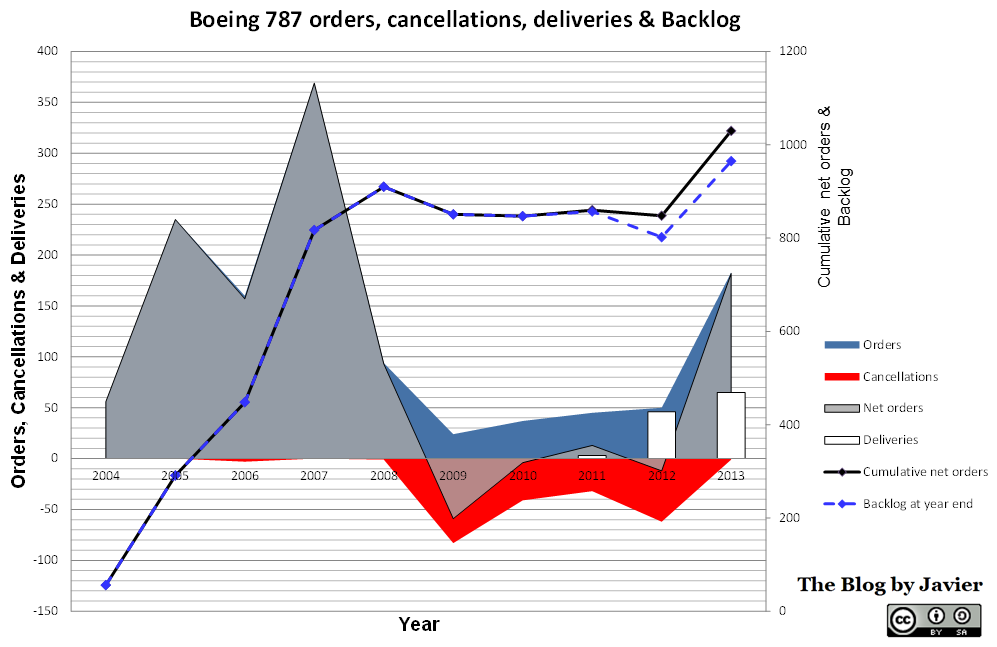
During 2013 Boeing delivered 65 787s, from the 50th to the 114th units (in previous years it had delivered already 3 in 2011 and 46 in 2012).
Thus, the exercise to find out what learning curve Boeing achieved in 2013 is as simple as to see what learning curve yields an “approximately 20% unit cost improvement” from the unit 50th to the unit 114th. The beauty is that we do not even need to know the initial unit cost to perform the calculation, as the relative improvements in terms of percentages are independent of the starting point. All the information has indeed been provided by Boeing.
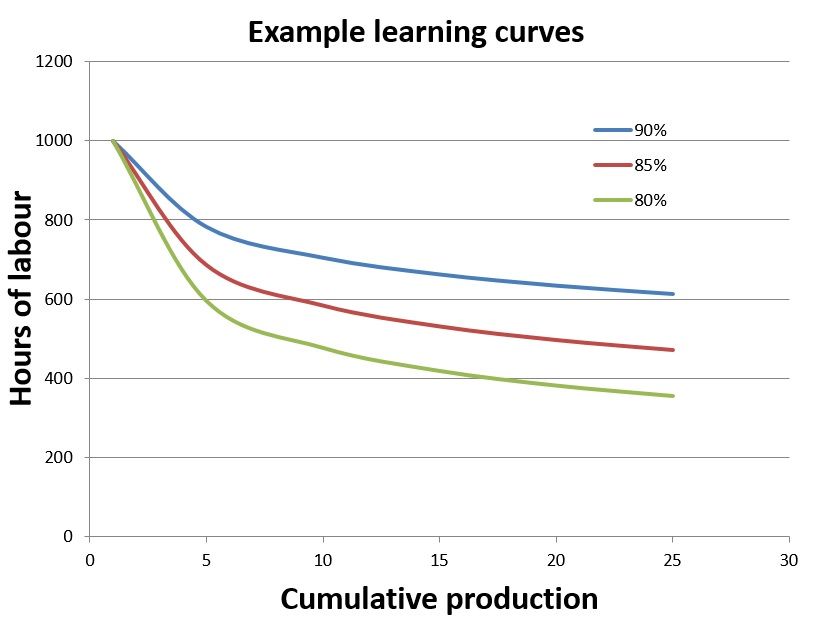
In the first graph below I just plotted some generic learning curves, from 95% to 75%. This form of representation provides a good view of how learning is intense at the beginning of the production process and it stabilizes later on. It also shows well how learning is more intense and cost reductions are bigger for a 75% curve than for a 95% curve.

Generic learning curves.
However, in the previous curve it is difficult to distinguish the 50th and the 114th units which are needed for the calculation. Thus, I plotted the same curves in with a log scale for the numbers of units produced in the graphic below:
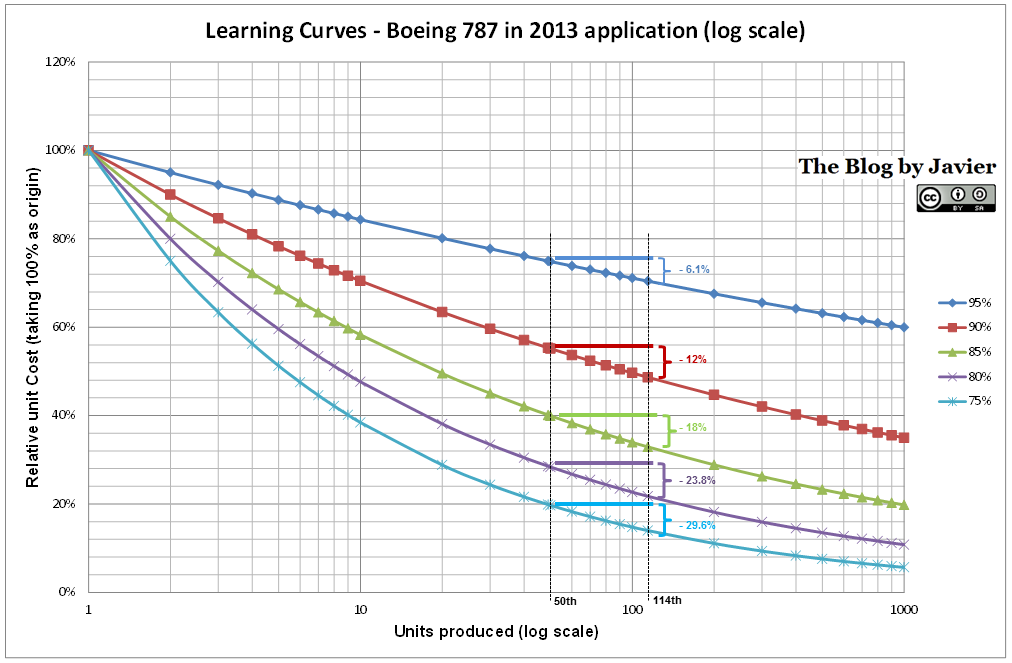
Boeing 787 learning curve in 2013 calculation, delta unit cost between 50th & 114th units.
In this second graphic I added the information of what relative cost reduction is achieved between the 50th and the 114th units for each of the curves (1).
To make sure that readers are not lost, let’s take the 85% curve. Following that curve, the unit cost of the 50th unit produced is a 40.2% of the 1st unit cost, whereas the unit cost for the 114th unit produced is a 32.9% of the 1st unit cost. The difference is then 40.2% – 32.9% = 7.2%, which represents a 18.0% cost reduction from the 50th unit cost. If you follow the same calculation for each of the curves, you will obtain the following unit cost improvements between 50th and 114th units:
- 95% curve: -6.1% unit cost improvement
- 90% curve: -12.0% unit cost improvement
- 85% curve: -18.0% unit cost improvement
- 80% curve: -23.8% unit cost improvement
- 75% curve: -29.6% unit cost improvement
Thus, from the information provided by Boeing of units delivered and unit cost improvement (“approximately 20”, Greg Smith) we can deduce that during 2013 the learning curve that the 787 program has achieved is between 85% and 80%. Thus, in line with aerospace average indicated by NASA (85%), or in line with the reported 84% achieved in the 777.
If we wanted to know what learning curve yields exactly that 20% unit cost improvement, it is now trivial to calculate it: the 83.3% learning curve.
Having made these numbers, and taking into account the words used by Boeing CFO, “unit cost has improved approximately 20% over the past year on the 787-8″, I take it as that the improvement has been close to 20% though probably not reaching it; thus, I understand that the learning curve was rather between 83.3-85% instead of down to 83.3%.
—
(1) Bear in mind what a relative cost reduction is in contrast to the fact of relative costs represented in the vertical axis as percentages of the initial cost (100%).