The US Government Accountability Office (GAO) has recently published a report about the KC-46 Tanker Aircraft [PDF, 1.2 MB]. In it the GAO reviews the situation of the program, measures introduced, costs, technology development, etc. In the first page it summarizes:
“The KC-46 program 2012 estimates for cost, schedule, and performance are virtually the same as last year’s, with the contractor running very close to the planned budget and schedule”.
On the technical side it points to several challenges: flight test plan, completion of engineering drawings, relocation of personnel and facilities related to defense equipment, etc.
However, in this post I wanted to focus only on the costs and contractual sides of the program, given the amount of articles that we could read about it during the past year. Several news have reported about the cost overruns in the program and about how these were to be born by Boeing.
The last time I read about the topic, the reported overrun was of about 1.2bn$ on a 4.4bn$ contract, out of which ~500M$ would be born by USAF and the remaining 700 M$ by Boeing (see articles from Bloomberg, Aviation Week, The Seattle Times…).
But, where do these figures come from?
One of the many things I like of the USA is the transparency in making lots of information and data available to the public, for example, budgeting information of the Air Force, GAO’s assessments, hearings at the Senate and House of Representatives Committees, etc. Thus, you can find:
- FY2013 budgeting information from the US Air Force KC-46 program here [PDF, 29 MB, from page 671].
- GAO’s assessments on selected weapon programs [PDF, 14 MB].
- Department of Defense (DoD) Program Acquisition Costs by Weapon System [PDF, 8 MB].
Contractual framework
From the USAF budgeting material, page 675, under the paragraph “E. Acquisition Strategy“, the explanation of the different contracts structure for the KC-X program (the name of the program prior to the contract award) can be found:
“The KC-46 program released a final Request for Proposal (RFP) on 24 Feb 2010, and entered source selection on 9 Jul 2010. The KC-46 program held a Milestone B Defense Acquisition Board (DAB) on 23 Feb 2011, received approval to enter EMD from OSD AT&L on 24 Feb 2011, and awarded the KC-46 contract to Boeing on 24 Feb 2011 to develop and procure 179 KC-46 aircraft. The KC-46 contract procurement was conducted via a full and open competition per Federal Acquisition Regulation (FAR) Part 15, and resulted in a FY 2011 EMD Fixed Price Incentive Firm (FPIF) contract. The EMD phase will develop, build, and test four KC-46 aircraft, and will qualify receiver aircraft.
Production will begin in FY 2015 with two Low-Rate Initial Production (LRIP) lots (Firm Fixed Priced (FFP)) and then Full-Rate Production (FRP) options (FFP with Not to Exceed (NTE) + Economic Price Adjustment (EPA)). The LRIP and FRP options will be exercised following successful completion of Operational Assessments (OAs) for the LRIP decisions, and a successful completion of Initial Operational Test and Evaluation (IOT&E) for the FRP decision.”
Thus, so far only the Engineering Manufacturing and Development (EMD) contract phase has been contracted, on February 24th Feb 2011 (you can see Boeing and DoD press releases).
Cost Assessment by GAO:
From the Government Accountability Office (GAO) assessment of the program, referred above:
“The current development cost estimate of $7.2 billion as reported in October 2012 includes $4.9 billion for the aircraft development contract and 4 test aircraft, $0.3 billion for the aircrew and maintenance training systems, and $2 billion for other government costs to include program office support, government test and evaluation support, contract performance risk, and other development risks associated with the aircraft and training systems. […]
Through December 2012, Boeing has accomplished approximately $1.4 billion (28 percent) in development work and has more than $3.5 billion (72 percent) in estimated work to go over the next 5 years. […]
Barring any changes to KC-46 requirements by the Air Force, the contract specifies a target price of $4.4 billion and a ceiling price of $4.9 billion at which point Boeing must assume responsibility for all additional costs. […]”
See the table below showing Air Force and Boeing contract amounts and estimates:
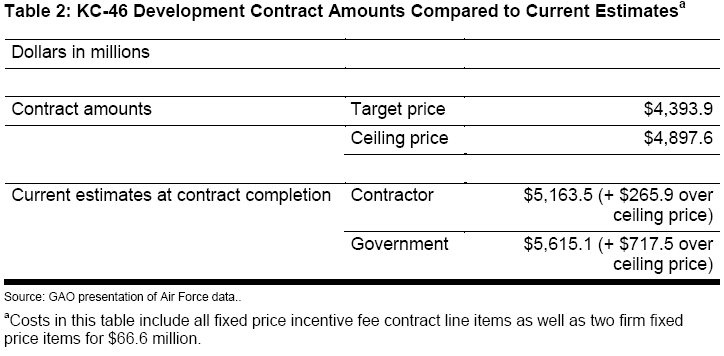
KC-46 EMD Contract & Estimates (Source: GAO).
The report from GAO offers the following graphic referring to what they call “management reserves“:
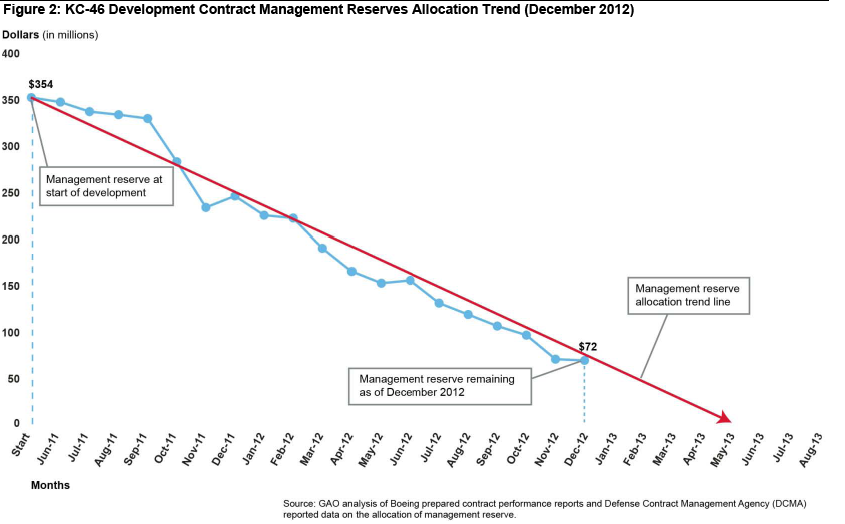
KC-46 EMD Management Reserves (Source: GAO)
This graphic shows well the rate at which Boeing has been supposedly burning its margins. However, it does not reflect at all the nature of the issue, related to the type of contract this “Engineering Manufacturing and Development” (EMD) contract: a Fixed Price plus Incentive Firm type of contract (FPIF).
Fixed Price Incentive Firm contracts
It is not easy to find good literature online about these types of contracts. The Wikipedia for instance does not have yet an article on FPIF contracts, but only on the calculation of the Point of Total Assumption. However, you can find a couple of good sites with explanations and examples of FPIF contracts here and here [PDF from the US Army].
Some concepts that we need to bear in mind are (definitions from the link above):
Target Cost (TC): The initially negotiated figure for estimated contract costs and the point at which profit pivots.
Target Profit (TP): The initially negotiated profit at the target cos
Target Price: Target cost-plus the target profit.
Ceiling Price (CP): Stated as a percent of the target cost, this is the maximum price the government expects to pay. Once this amount is reached, the contractor pays all remaining costs for the original work.
Share Ratio (SR): The government/contractor sharing ratio for cost savings or cost overruns that will increase or decrease the actual profit. The government percentage is listed first and the terms used are “government share” and “contractor share.” For example, on an 80/20 share ratio, the government’s share is 80 percent and the contractor’s share is 20 percent.
Point of Total Assumption (PTA): The point where cost increases that exceed the target cost are no longer shared by the government according to the share ratio. At this point, the contractor’s profit is reduced one dollar for every additional dollar of cost. The PTA is calculated with the following formula. [thus, PTA = (Ceiling Price – Target Price)/Government Share + Target Cost]
Where can we get these figures for the KC-46 EMD contract? Some of them are referred to in the different reports and budgeting materials (explicitly or implicitly) and others can be found in the following letter from US Senator John McCain to the DoD from July, 15 2011 [PDF, 400 KB].
Thus for the KC-46 EMD contract we have:
- Target Cost: 3.9 bn$.
- Target Profit: 500 M$.
- Target Price: 4.4 bn$
- Ceiling Price: 4.9 bn$
- Share Ratio: 60% / 40% (Government / Boeing).
- Point of Total Assumption (calculated): ~4.73 bn$.
With this information we can produce the typical FPIF contract curve, which is the only thing which is missing in ALL the news, budgeting materials, GAO reports, etc., that I have read and is the most illustrative graphic to understand what is going to happen if the cost overruns keep piling and who is going to bear which amount of the cost from which point:
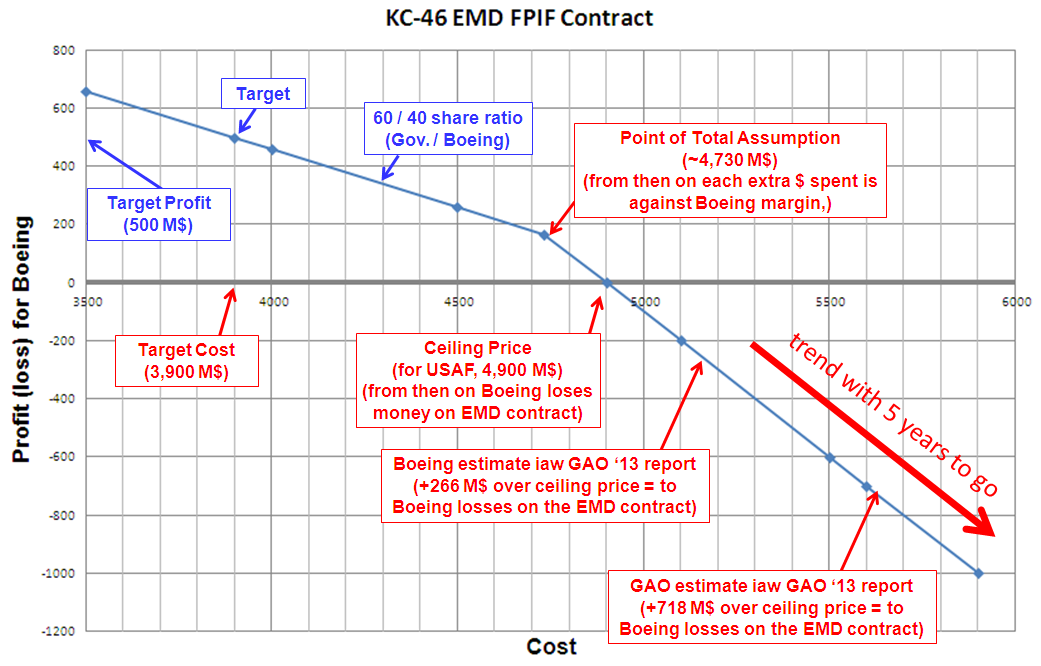
KC-46 EMD FPIF Contract.