A few weeks ago I attended a 2-day training course titled “Finance for non financiers”. I found it too basic. However, I wanted to comment on one exercise we were proposed almost at the end of the course.
We had just reviewed some notions of Earned Value Management with its main concepts: Planned Value (or Budgeted Cost of Work Scheduled (BCWS)), Actual Cost (or Actual Cost of Work Performed (ACWP)), Earned Value (or Budgeted Cost of Work Performed (BCWP)), Schedule Performance Index (SPI=Earned Value / Planned Value), Cost Performance Index (CPI=Earned Value / Actual Cost), etc., when the teacher posed the following question:
From a cash management (preservation) point of view rate the following sets of EVM indicators from best to worst:
1) SPI=1.2, CPI=1.2,
2) SPI=1.2, CPI=0.8,
3) SPI=0.8, CPI=1.2,
4) SPI=0.8, CPI=0.8.
Any EVM practitioner or person with some notions of EVM will know that in EVM SPI and CPI above 1 means good, and below 1 means bad. Therefore, from the previous exercise we would be able to immediately say that the best case is 1) (both indicators above 1) and the worst case is 4) (both indicators below one). The tricky situation would be how to value cases 2) and 3) where one of the indices is positive and the other negative.
I remember that in the class I quickly thought “if we want to preserve cash, a positive SPI means we advance faster and if it is coupled with a negative CPI that means we are burning cash at a higher than planned rate, therefore it is better the case 3) where we advance at a slower rate but always below planned budget”.
I was surpised when other colleagues started diverting with thoughts like “if you take the case 3) and are behind schedule you would not receive cash inflows so it would be worse” (?). However, the question from the exercise did not give any hint of whether cash inflows are linked to planned value, earned value or you just start with a pile of cash to be used. It just asked about cash preservation.
In my first year of university studies in aerospace engineering I very well learnt the lesson of not guiding oneself responses by the first intuition that you may have but to apply the knowledge acquired to the question at hand. In relation to this case, it would be as easy as to depict the typical EVM curves for the 4 cases and see which one is burning cash at a higher rate.
In each of the 4 graphics below you will see a black curve which represents the Planned Value, a green curve which represents the Earned Value and a red curve which represents the Actual Cost. In absence of information of whether the cost in the exercise is equal to cash outflows, we can assume that it is. Therefore, the best case for preserving cash (other things being equal) would be that with the lower Actual Cost curve (red curve). See the different curves below:
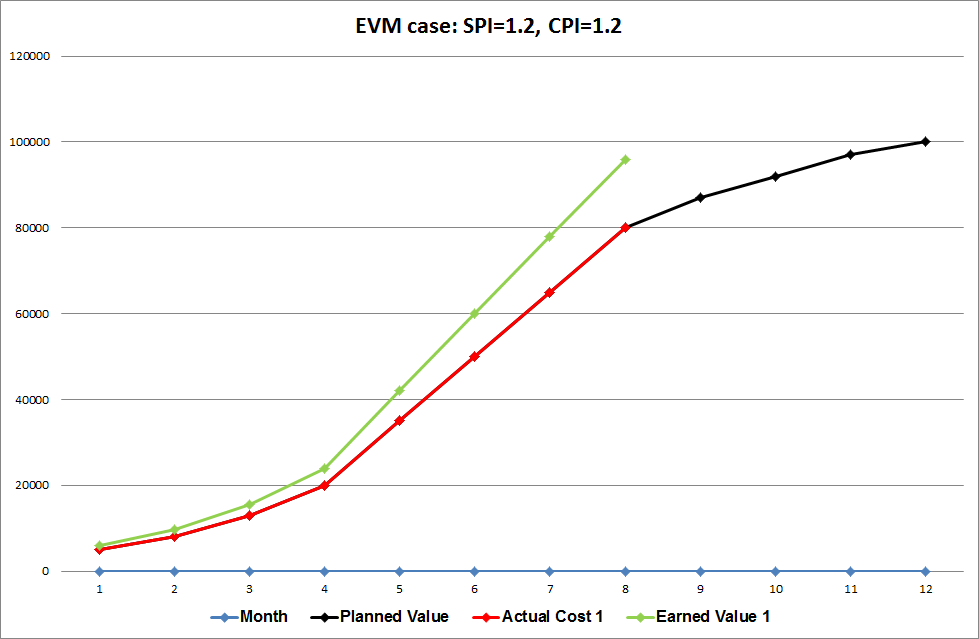
EVM case 1: SPI=1.2, CPI=1.2
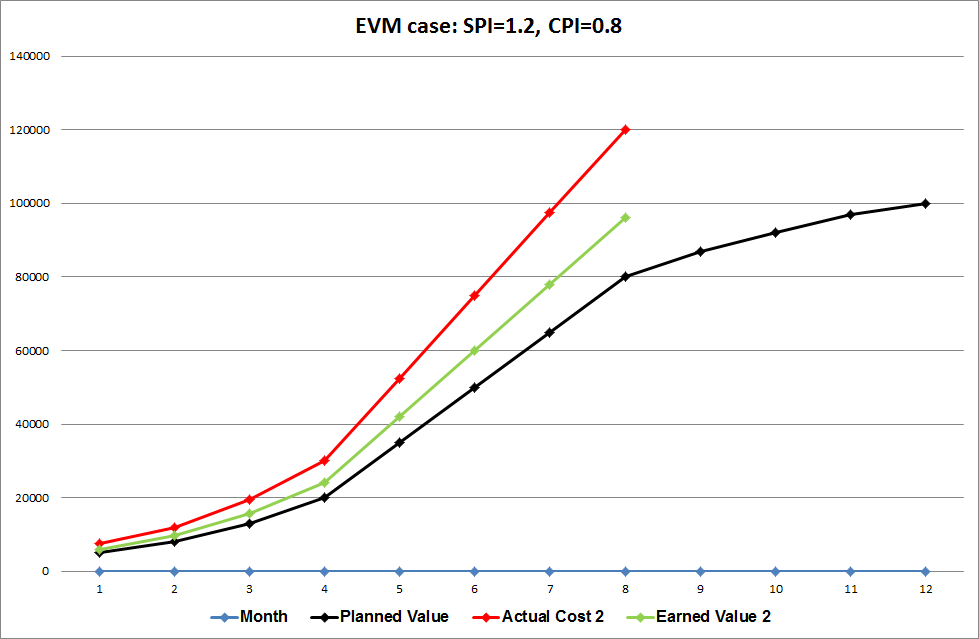
EVM case 2: SPI=1.2, CPI=0.8
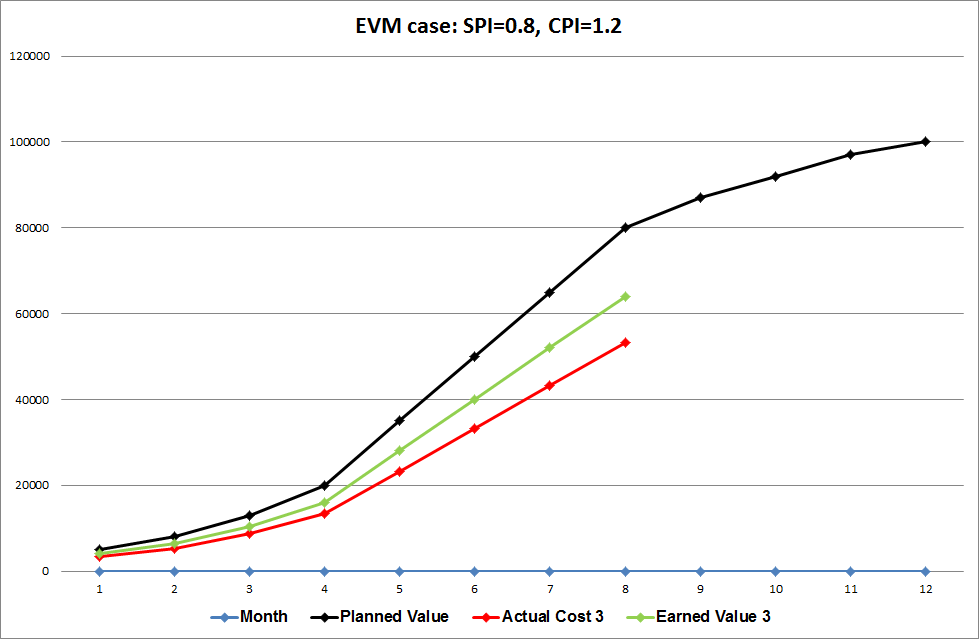
EVM case 3: SPI=0.8, CPI=1.2
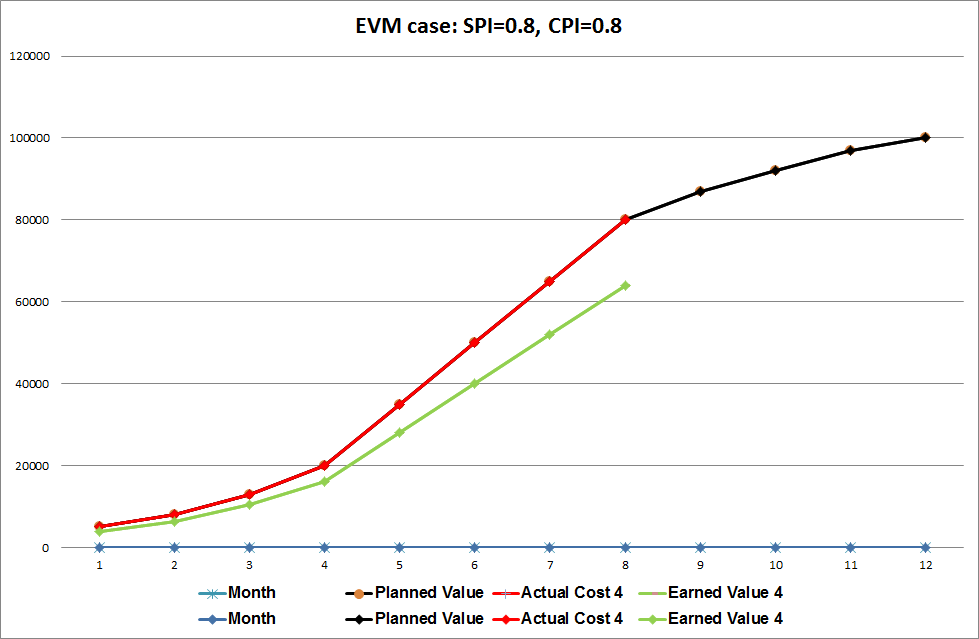
EVM case 4: SPI=0.8, CPI=0.8
The first interesting point is that both cases 1 and 4 are burning cash at the same rate, however case 1 is ahead of schedule and case 4 is behind schedule. Therefore, case 1 is preferable, because in the end with case 4 we would arrive at the 12th month having consumed all the planned resources but not having completed the project.
Between the tricky cases, 2 and 3, we can immediately see that case 2 has burned more than twice the cash than case 3 at any given point! We can therefore infer that case 2 is indeed the worst case among the two.
Even if you think along the lines of some of my colleagues, i.e. assuming that cash inflows are linked to earned value (1), you will see that in case 2 the actual costs are always above earned value, whereas in case 3 the actual costs are below! So even following their way of thinking, had they done the math, they would have arrived to the same conclusion!
See in the graphic below how the case 2 burns much more cash than the case 3.
However, if the question had asked about what case is preferred from a schedule point of view the answer would have been different: as in the case 2 the project would have been completed by the 9th month (no matter the cost), whereas in the case 3 by the end of the year only a 80% of the project would have been completed (despite of the savings).
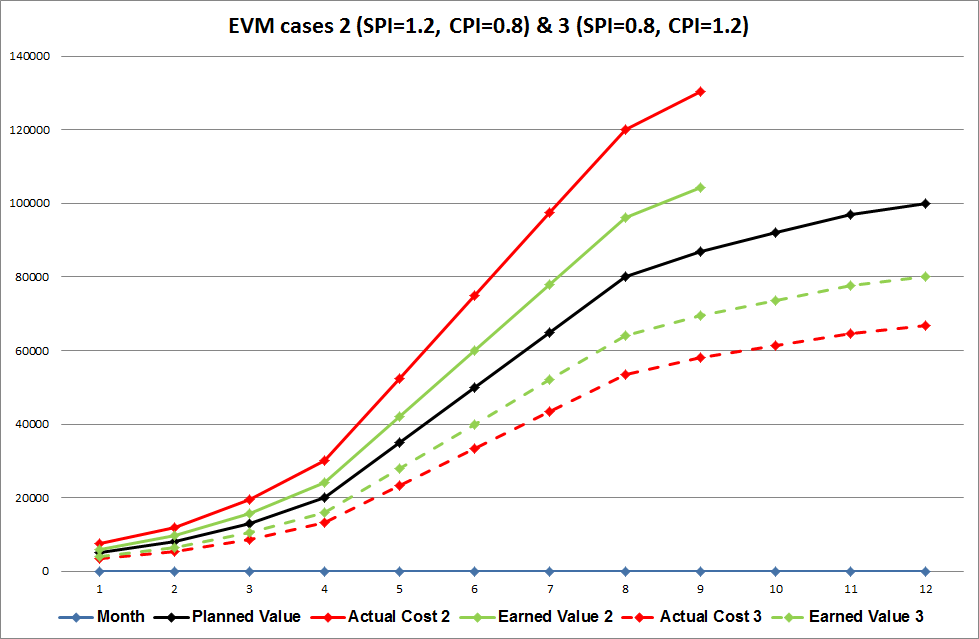
EVM cases 2 and 3.
Finally, see below a table the detailed calculations for all 4 examples through the 8th month.
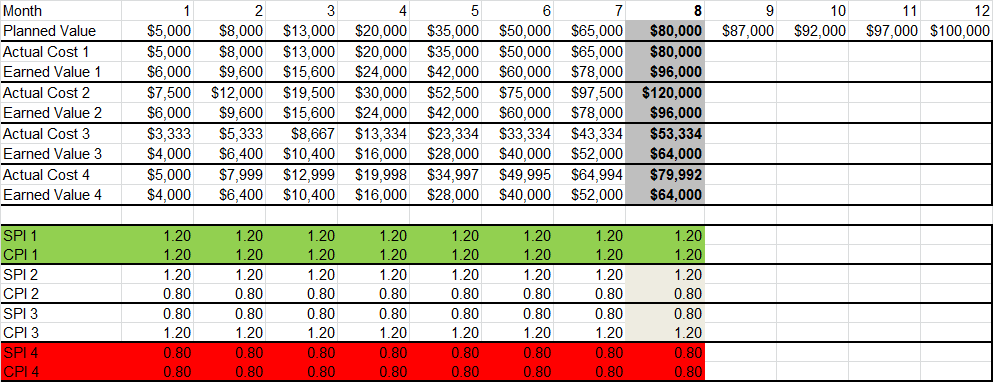
EVM calculations for the 4 cases.
—
(1) Even in the absence of such information.