Monthly Archives: January 2020

Aeropuerto de Zaragoza: 2º del país en transporte de mercancías, por delante de Barcelona

El año pasado escribí un artículo en el blog donde hablaba del extraordinario crecimiento del aeropuerto de Zaragoza en transporte de carga desde 2003 (fecha coincidente con la apertura del centro logístico de Inditex).

AENA ha sacado hoy una nota de prensa con los primeros resultados consolidados de 2019 y para los principales aeropuertos españoles. Pues bien, ha ocurrido lo que se preveía: desde 2019 Zaragoza se ha convertido en el segundo aeropuerto de España en transporte de mercancía, por delante del aeropuerto de Barcelona y por detrás de Madrid-Barajas.

“Los cuatro aeropuertos que registraron mayor tráfico de mercancías fueron Adolfo Suárez Madrid-Barajas, con 558.566 toneladas (+7,4%); Zaragoza, con 182.659 toneladas (+9,5); Josep Tarradellas Barcelona-El Prat, con 177.271 toneladas (2,5%) […]”

Esos cuatro aeropuertos representan el 92% del volumen nacional de carga. Madrid y Zaragoza crecieron por encima de la media nacional (5,6%) respecto a las cifras de 2018, Barcelona lo hizo por debajo (2,5%) lo que, junto con el crecimiento de Zaragoza, explica el que haya caído al tercer puesto.

Dejo debajo la misma gráfica que realicé el año pasado actualizada con los datos de 2019. En dicha gráfica no se muestran las cifras de Madrid-Barajas porque al ser el volumen el triple que el de Zaragoza, si se incluyese no se apreciaría bien el crecimiento de este último.

AENA_Zaragoza_2003-2019

Leave a comment

Filed under Aerospace & Defence

Aviation safety evolution (2019 update)

Yesterday, the Aviation Safety Network released the 2019 airliner accident statistics showing a total of 20 fatal airliner accidents, resulting in 283 fatalities.

Aviation Safety Network is a private initiative from the Flight Safety Foundation which curates an extensive database with aviation incidents, hijackings and accidents, from 1946 to nowadays.

The tweet with which they made the announcement is below:

Which includes the graphic below.

ASN_infographic_2019

If we take a quick look at the figures (which report commercial aviation flights (passenger and cargo)):

  • Number of accidents: 20, up from 15 in 2020, though still the 7th safest year in history (in number of accidents).
  • Fatalities: 283, down from 556 in 2018, the 3rd safest year in history (in number of fatalities).
  • There were 5 accidents with over 10 fatalities (details here).

The graphic above from the Aviation Safety Network provides the view of the evolution of accidents. However, in their database they provide some more figures with which I produced the graphics below.

Evolution of accidents per million flights

The database provides figures of the evolution of the number of world air departures since 1970, together with the evolution of accidents (above). The database includes a ratio: fatal accidents per million flights, which I have plotted below together with the evolution of flight departures. You can see that the ratio has decreased 12 fold since 1970, from 6.35 to 0.51 last year.

2019_safety_accidents_per_flights


Global air traffic vs fatalities

The database provides no ratio with the figures of fatalities, but they can be related to the amount of passengers carried. In aviation there is the concept of revenue passenger kilometre (RPK) transported, which is compiled year by year and can be found in publications from ICAOIATA or aircraft manufacturers. I have plotted below both the evolution of traffic growth and fatalities since 1970, together with a 5-year moving average for the fatalities.

2019_safety_RPK_vs_fatalities

Within the evolution of traffic there are two variables that have grown over the years: the number of passengers carried per flight departure and the distance covered. Therefore, together with the decrease in the evolution of fatalities (taking the 5 year average) I have plotted below the evolution of the ratio of fatalities per trillion RPK. You can see that the ratio has decreased 81 fold since 1970, from 3,218 to 40 last year (5-year average).

2019_safety_fatalities_per_RPK

4 Comments

Filed under Aerospace & Defence

A380 transport convoy (Itinéraire à Grand Gabarit)

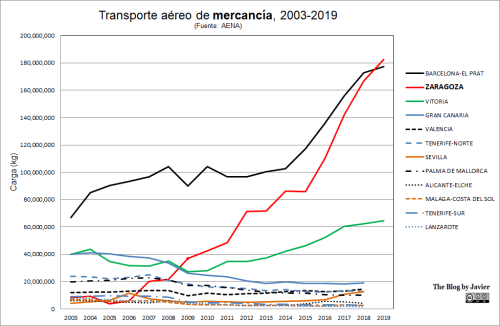
One of the most recognizable features of the Airbus industrial system, with factories in different countries, mainly in Germany, Spain, United Kingdom and France, where the main components and the aircraft are assembled, is the transportation of those components by the iconic A300-600ST Beluga aircraft.

Arriving TLS

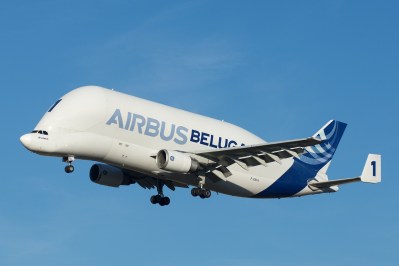
Image credit to Brian Bukowski.

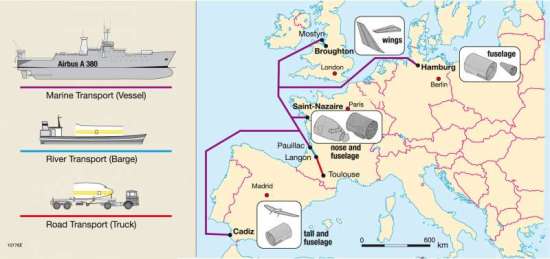
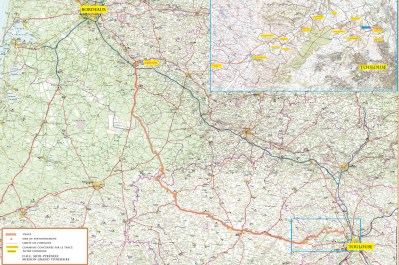
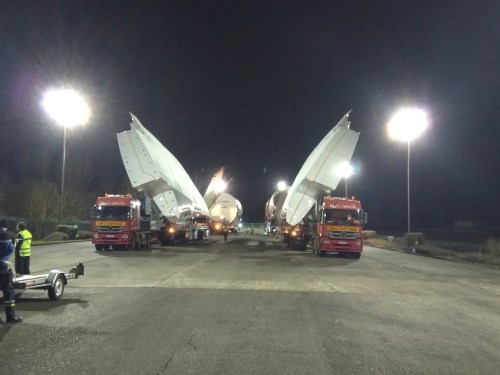
However, as most of the A380 components are too big to be carried onboard of the Beluga, a special transportation system was required to be put in place. It included transportation of the bigger components from the plants in Hamburg, Broughton, Saint-Nazaire and Cadiz by ship to the port of Paulliac, close to Bordeaux. From there, they travel by barge up the river Garonne to Langon. Then they are mounted on special purpose trucks to travel the road from Langon to the final assembly plant near Toulouse.

110776E_Flugzeugbautransport

Ever since I came to work to Toulouse nine years ago, I had wanted to go and see one night the A380 transport convoy on the road. I kept postponing it, until last month. Airbus announced in early 2019 that the A380 programme would come to a close with the last aircraft to be delivered somewhere in 2021. Therefore, not many such transports were left to be seen.

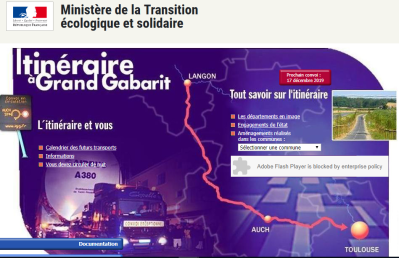
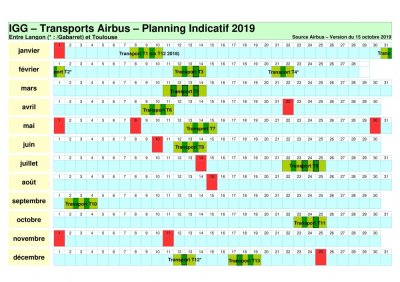
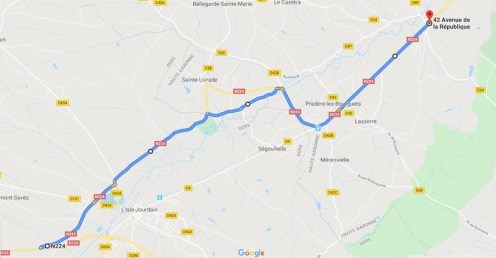
Fortunately there is a public website with all the information required to prepare the visit: Itinéraire à Grand Gabarit. It includes: maps of the route that is followed, a yearly calendar with the days in which the transport will take place, a detailed schedule with the time slot in which the transport will pass by the different villages along the route and support documentation.

IGG

carte_300dpi-2

-97-a7814

Detailed_calendar

With that information I set out to see the convoy last December on the night between the 18th and 19th. Firstly, I went to see the convoy at their stop at L’Isle Jourdan.

IMG_20191219_005940070

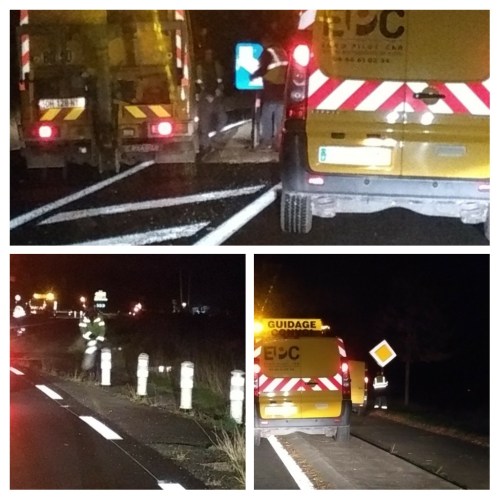
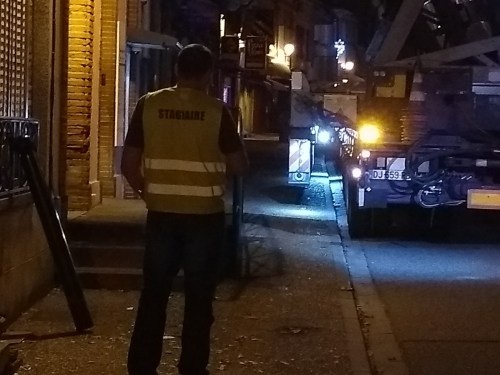
I then followed part of the route with the convoy, seeing how the team removed sign posts along the way and marked some points as reference for the truck drivers.

Route_google

20200101_131447-COLLAGE

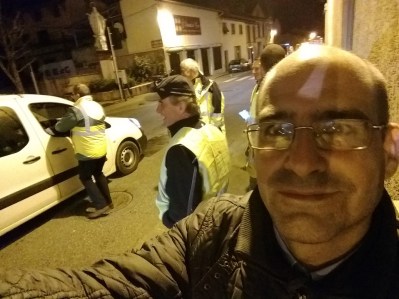
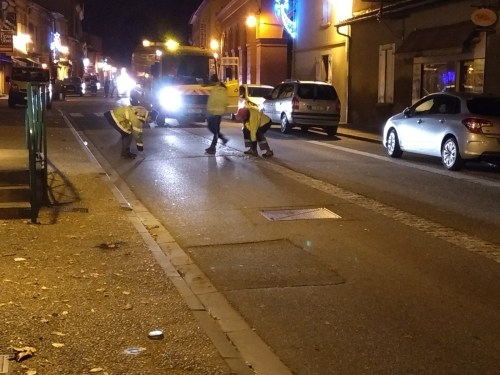
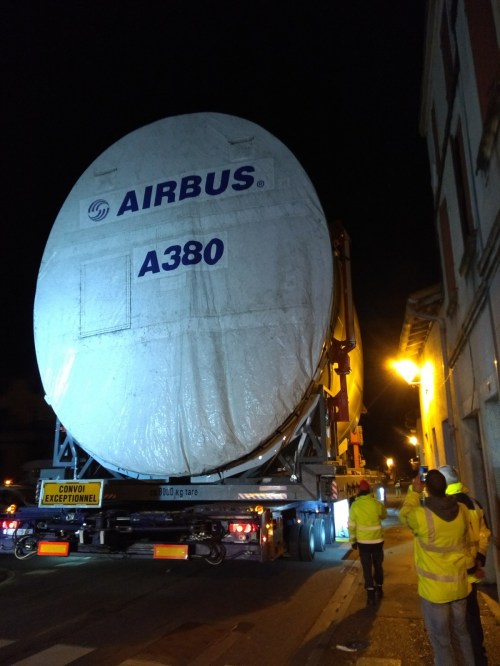
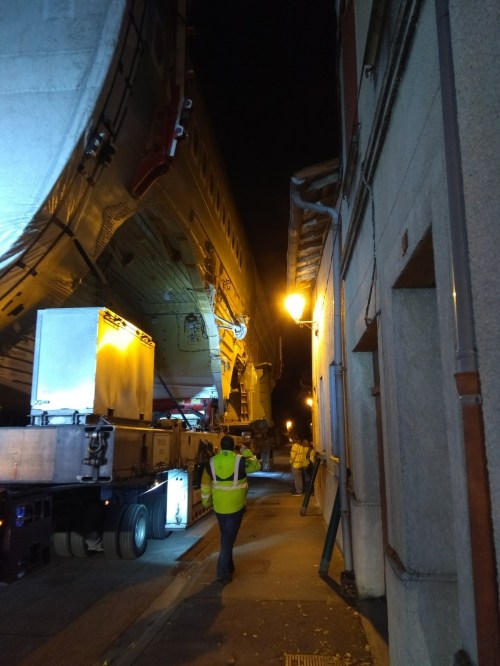
Then I drove to Lévignac, a village where the pass is rather tight and slow. At Lévignac I found a group of about a dozen enthusiasts dressed in yellow vests who come to see every single convoy since years ago out of pure pleasure of watching such a magnificent sight.

IMG_20191219_025342972

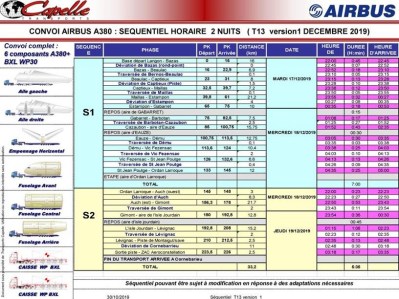
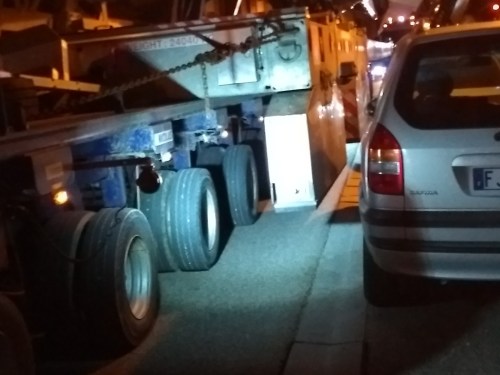
The convoy arrives at Lévignac at 2:23am and normally takes 12 minutes to pass by (see the detailed schedule above), but this time there were many cars parked in the streets which needed to be displaced: either by the tow truck or pushed by hand. Careful measurements were taken by the operators to ensure the convoy would pass.

IMG_20191219_024438095IMG_20191219_030121615IMG_20191219_030507962

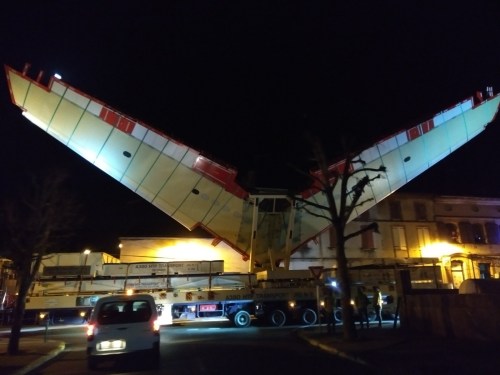
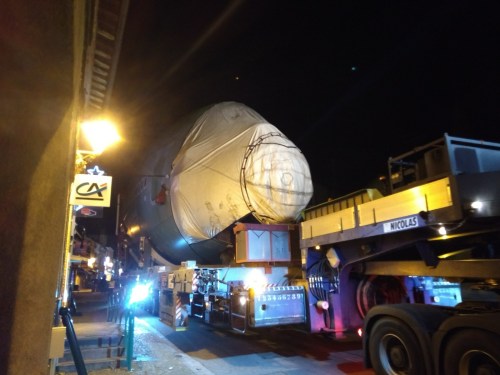
With all the checks properly done and cars removed, we enjoyed the slow pass of the 6 trucks:

IMG_20191219_025911751IMG_20191219_025955330IMG_20191219_031452106_BURST000_COVER_TOPIMG_20191219_032105262_BURST000_COVER_TOPIMG_20191219_032242685_BURST000_COVER_TOPIMG_20191219_032822374IMG_20191219_033027266

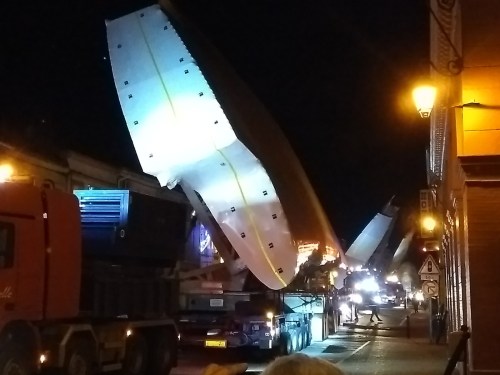
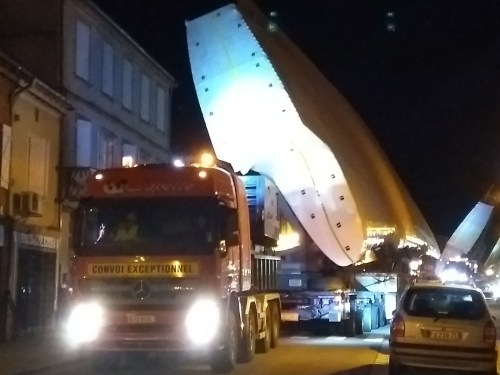
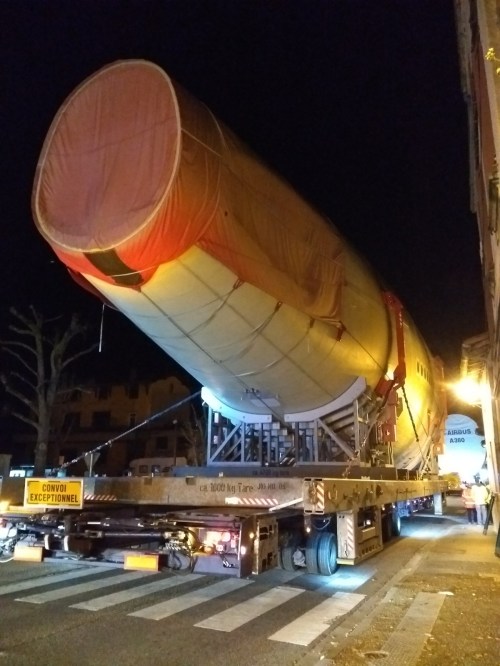
I got to see the convoy of MSN (manufacturer serial number) 270, an Emirates aircraft. There will be just two more aircraft to be built after that one, MSNs 271 and 272, with their respective convoys, which dates remain to be announced in the above-mentioned website at the time of writing this post. If you have the chance, do not miss it!

Leave a comment

Filed under Aerospace & Defence