Blagnac half marathon 2014

After 2 months without competing, I took part today in Blagnac’s half or semi marathon.

In this 2014, I am finding it hard to find the necessary consistency with the training. I go from fulfilling a week of training to just run 2 or 3 days the following week. It’s an issue of motivation, engagements and fatigue. That is why, today, I had not in mind pursuing any personal best time in the distance (1h37’29”). I rather checked beforehand the paces needed to achieve 1h40′ and 1h45′ and I targeted at the start line for 1h40′.

The day was sunny and windy. But it was way to sunny and hot, and a bit too windy for some of the long straight streets. Nevertheless, Blagnac’s half is completely flat. Thus, the main issue today was the lack of fitness.

I started with 2 kilometres at about 4’30” and then adapted the pace to try to continue at about 4’45” in order to be under 1h40′. However, in the second half of the race I felt that I wasn’t going to make it. It was hard for me to keep the pace.  Thus, I just tried to maintain a rhythm which was not painful and at the same time would permit to clock a time below 1h45′ and so I did. That is the good thing of having a plan B, or making it (making up the numbers in your head) on the fly (or rather run).

In the end, I finished in 1h44’19” net time as recorded by my Garmin. Definitely not the best half I have done (I haven’t done so many). I take it as a training and a test for Rotterdam Marathon, in about a month (April 13th). I will need to get more serious in the remaining weeks of training prior to that date if I don’t want that marathon to be a nightmare.

After finishing Blagnac's half marathon.

After finishing Blagnac’s half marathon.

1 Comment

Filed under Sports

Boeing discounts detailed calculation, 2013 vs. 2012

Last years I have published in the blog  some posts (1) dedicated to show what was my estimate of the average discount Boeing applies to its commercial airplanes. I included in those posts the rationale used for the calculation. Find here the post related to the calculation of the discount based on 2013 data of Boeing Commercial Airplanes revenues, deliveries and list prices.

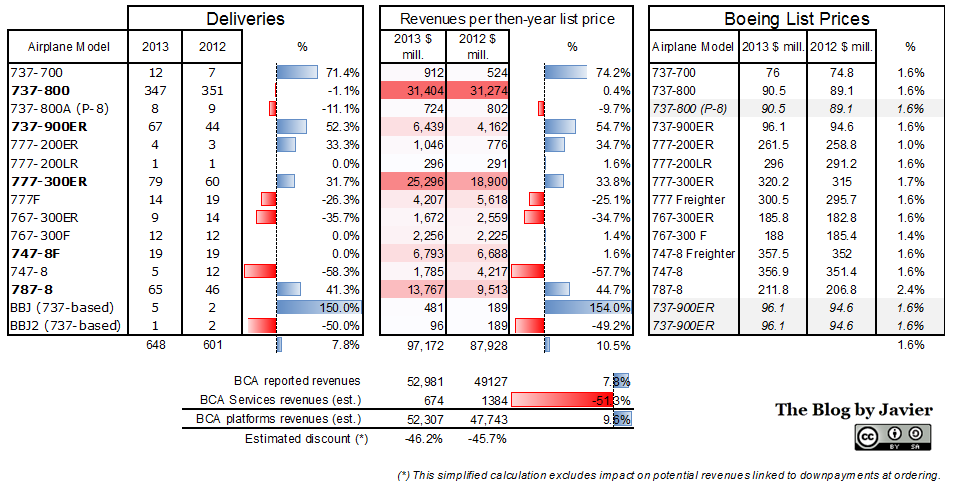
In this post, I wanted to show in detail a simplified table (2) with the calculation comparing 2013 simplified result versus 2012:

Boeing discount detailed simplified calculation: 2013 vs. 2012.

Boeing discount detailed simplified calculation: 2013 vs. 2012.

In the table above, you may find for both 2013 and 2012 Boeing reported deliveries per model and Boeing published list prices per model (3) and Boeing Commercial Airplanes reported revenues.

What is then estimated? Boeing Commercial Airplanes services revenues (deduced from financial reports reported information), Boeing Commercial Airplanes platforms revenues (derived from the previous figure) and the average discount; this is calculated from the difference between estimated BCA platforms revenues and what should have been that figure had the airplanes been sold at list prices.

Results: average discounts of above 46% in 2013 and above 45% in 2012.

(1) Find here what is becoming a “body of knowledge” on Boeing discounts: estimates calculated for 2013201220112010 and 2009; a review of the French portal Challenges.fr of aircraft discounts prior to Le Bourget airshow of 2013; aBombardier’s CEO statement on what is known in the market as the Boeing discount; Boeing Commercial Airplanes president Ray Conner speaking about the more aggressive pricing they are being forced to offer.

(2) I refer to this table as “simplified” as it excludes from the calculation the potential influence on yearly revenues (note, not cash flow) of down payments linked to orders received in then-year versus orders received in previous years for aircraft delivered in then-year.

(3) Two assumptions are needed: 737-800A transfer prices from BCA to Boeing Defense Space & Security for the P-8 (for simplicity assumed to be the same as the 737-800 price) and for the 737-based business jets (for simplicity assumed to be the same as the 737-900ER).

1 Comment

Filed under Aerospace & Defence

Augustine’s Laws and the future long-range bomber

The US Air Force is moving ahead with its plan to develop a new long-range bomber aircraft to be operational by the mid of next decade. The program is not yet launched, but within this year it is expected that we will see the launch of a request for proposals (RFP).

I read about the latest moves about this program-to-be in an article from DefenseNews, “USAF To Shed Light on ‘Mystery’ Plane“. Apart from different declarations from officials and industry, the article provided some main general clues:

The Air Force intends to begin fielding the bomber in the mid 2020s, with penetrating capability in mind. The service will procure 80 to 100 planes, which will mostly be made with existing technologies. Those machines will also have both standoff and direct-attack munitions and room for a large payload.

The service also is exploring the idea of the aircraft being optionally manned.

Service officials have cited a cost of $550 million per plane as the ceiling for the program, but even that figure has some mystery to it. Observers have noted that the figure does not include research and development (R&D) costs, which could drive that amount up.

My first reaction on that figure of $550 million per aircraft was:

For those not acquainted with him, Norman Augustine served in many positions both in the Administration (Under Secretary of the Army) and in the Aerospace & Defense industry (CEO of Lockheed Martin). Lately he lead the Committee that was reviewing the US Human Space Flight Plans. He wrote a fantastic book, “Augustine’s Laws”, about the aerospace and defense industry, the problems that plague their programs, etc. I reviewed that book in this post.

However, after writing that tweet I decided to check it myself…

See below the original graphic from the book depicting the trend of increasing costs of bomber aircraft:

Trend of Increasing Cost of Bomber Aircraft (source: Augustine's Laws).

Trend of Increasing Cost of Bomber Aircraft (source: Augustine’s Laws).

I extrapolated the trend with the information provided in the article, that is, a $550 million unit cost with an entry into service by the mid 2020s, see below where that spot is in the enlarged graphic:

Updated Trend of Increasing Cost of Bomber Aircraft (source: Augustine's Laws + future long-range bomber information).

Updated Trend of Increasing Cost of Bomber Aircraft (source: Augustine’s Laws + future long-range bomber information).

You will see that I marked 2 different spots in red and blue. The blue one corresponds to the unit cost ceiling of 550M$ reported in the article. You will see that the spot is way off the 70-year old trend (from the end 1920s-1990s). Therefore, I decided to continue the trend line and see at what unit cost would a bomber aircraft with entry into service in the mid 2020s still follow the trend, and I marked that unit cost in red. The result is that the future bomber would have to cost about $500 billion apiece, or a cost roughly equal to the entire Department of Defense yearly budget.

That may seem impossible today, completely off reality. How could that happen? Start by imagining that the budget which will be earmarked for 80-100 airplanes along several years, in the end serves to procure many less units (40?, 10?… 1?). Then, add to that the information appearing in the article accompanying the 550M$ figure, “the figure does not include research and development (R&D) costs, which could drive that amount up”. Put all that together and we might end up seeing, 10 years from now, that Augustine’s was right on the spot.

In fact, the assertion that one single airplane would cost the US Air Force the entire DoD yearly budget was exactly predicted by Augustine in his Law number IX, though he applied it for tactical fighter aircraft, and the date in that case would be a bit later, 2054:

In the year 2054, the entire defense budget will purchase just one tactical aircraft. This aircraft will have to be shared by the Air Force and Navy 3 1/2 days each per week except for leap year, when it will be made available to the Marines for the extra day. (LAW NUMBER IX)

Update (2014-03-08): See in the article from Bloomberg, “Long-Range Bomber’s Development Would Get $12 Billion“, a declaration from Lt. General Charles Davis: “Is it going to be $550 million a copy? No, of course it’s not going to be $550 million a copy once you add in everything.“. The article includes further figures providing a new estimate of 810M$ apiece… The closing of the gap between 550M$ and ~ 500bn$ has started.

1 Comment

Filed under Aerospace & Defence

Warren Buffett’s 2013 letter to the shareholders of Berkshire Hathaway

Last Friday (28/02/2014), Warren Buffett’s 2013 letter to the Shareholders of Berkshire Hathaway [PDF, 252 KB] was released. As always, I strongly encourage you to read it (23 pages).

From this year’s letter, I wanted to bring attention to the following passages, on value creation, insurance business, intangible assets amortization, simplicity of some transactions, fundamentals of investing and a sound investing strategy.

***

On what is the focus of Warren and Charlie to create value:

“Charlie and I hope to build Berkshire’s per-share intrinsic value by (1) constantly improving the basic earning power of our many subsidiaries; (2) further increasing their earnings through bolt-on acquisitions; (3) benefiting from the growth of our investees; (4) repurchasing Berkshire shares when they are available at a meaningful discount from intrinsic value; and (5) making an occasional large acquisition. We will also try to maximize results for you by rarely, if ever, issuing Berkshire shares.”

On the keys of insurance business:

“[…] a sound insurance operation needs to adhere to four disciplines. It must (1) understand all exposures that might cause a policy to incur losses; (2) conservatively assess the likelihood of any exposure actually causing a loss and the probable cost if it does; (3) set a premium that, on average, will deliver a profit after both prospective loss costs and operating expenses are covered; and (4) be willing to walk away if the appropriate premium can’t be obtained.

[…] That old line, “The other guy is doing it, so we must as well,” spells trouble in any business, but in none more so than insurance.”

On the different views to be taken of certain intangible assets amortization no matter what accounting rules say about them:

“[…] serious investors should understand the disparate nature of intangible assets: Some truly deplete over time while others in no way lose value. With software, for example, amortization charges are very real expenses. Charges against other intangibles such as the amortization of customer relationships, however, arise through purchase-accounting rules and are clearly not real costs. GAAP accounting draws no distinction between the two types of charges. Both, that is, are recorded as expenses when earnings are calculated – even though from an investor’s viewpoint they could not be more different.

[…] Every dime of depreciation expense we report, however, is a real cost. And that’s true at almost all other companies as well. When Wall Streeters tout EBITDA as a valuation guide, button your wallet.”

On simplicity of some transactions and trust:

“I think back to August 30, 1983 – my birthday – when I went to see Mrs. B (Rose Blumkin), carrying a 1 1⁄4-page purchase proposal for NFM that I had drafted. (It’s reproduced on pages 114 – 115.) Mrs. B accepted my offer without changing a word, and we completed the deal without the involvement of investment bankers or lawyers (an experience that can only be described as heavenly). Though the company’s financial statements were unaudited, I had no worries. Mrs. B simply told me what was what, and her word was good enough for me.

[…] Aspiring business managers should look hard at the plain, but rare, attributes that produced Mrs. B’s incredible success. Students from 40 universities visit me every year, and I have them start the day with a visit to NFM. If they absorb Mrs. B’s lessons, they need none from me.”

Offer Letter for NFM (retrieved from BRK annual report [PDF, 6.5MB])

Offer Letter for NFM (retrieved from BRK 2013 annual report [PDF, 6.5MB])

On certain fundamentals of investing:

  • “You don’t need to be an expert in order to achieve satisfactory investment returns. But if you aren’t, you must recognize your limitations and follow a course certain to work reasonably well. Keep things simple and don’t swing for the fences. When promised quick profits, respond with a quick “no.”
  • Focus on the future productivity of the asset you are considering. If you don’t feel comfortable making a rough estimate of the asset’s future earnings, just forget it and move on. […] omniscience isn’t necessary; you only need to understand the actions you undertake.
  • If you instead focus on the prospective price change of a contemplated purchase, you are speculating. […]
  • […] I thought only of what the properties would produce and cared not at all about their daily valuations. Games are won by players who focus on the playing field – not by those whose eyes are glued to the scoreboard. […]
  • Forming macro opinions or listening to the macro or market predictions of others is a waste of time. […]”

A sound investing strategy:

“[…] The goal of the non-professional should not be to pick winners – neither he nor his “helpers” can do that – but should rather be to own a cross-section of businesses that in aggregate are bound to do well. A low-cost S&P 500 index fund will achieve this goal.

[…] My advice to the trustee could not be more simple: Put 10% of the cash in short-term government bonds and 90% in a very low-cost S&P 500 index fund. (I suggest Vanguard’s.) […]”

His best investment ever:

“[…] I learned most of the thoughts in this investment discussion from Ben’s book The Intelligent Investor, […]

[…] For me, the key points were laid out in what later editions labeled Chapters 8 and 20. […]

I can’t remember what I paid for that first copy of The Intelligent Investor. Whatever the cost, it would
underscore the truth of Ben’s adage: Price is what you pay, value is what you get. Of all the investments I ever
made, buying Ben’s book was the best […]”

4 Comments

Filed under Investing

Learning Curves: Boeing 787 case in 2013

In the previous two posts I introduced the concept of learning curve and provided a case in point (based on figures attributed to A350 FAL by Leeham News). In the first of those posts, I discussed that:

Boeing does not disclose outright what is the actual learning curve it is achieving in its program. Nevertheless, in its investor relations conferences it provides information here and there of cost savings achieved, etc. This can be interpreted as derived from learning curve effects, and would permit to build a model, even if based on scarce information.

Let me quote again one of those excerpts from Boeing executives:

“We continue to see progress in key operational performance indicators and unit costs, as we further implement production efficiencies and stabilize the overall production system on the 787 program. Unit cost has improved approximately 20% over the past year on the 787-8 […]“Greg Smith, Boeing EVP – CFO at Q4 2013 Earnings Conference.

To the avid reader, and knowledgeable and savvy analyst, this paragraph is enough to deduce the actual learning curve achieved by the 787 during 2013, provided that information reported by Boeing CFO, Greg Smith, was accurate.

During 2013 Boeing delivered 65  787s, from the 50th to the 114th units (in previous years it had delivered already 3 in 2011 and 46 in 2012).

Thus, the exercise to find out what learning curve Boeing achieved in 2013 is as simple as to see what learning curve yields an “approximately 20% unit cost improvement” from the unit 50th to the unit 114th. The beauty is that we do not even need to know the initial unit cost to perform the calculation, as the relative improvements in terms of percentages are independent of the starting point. All the information has indeed been provided by Boeing.

In the first graph below I just plotted some generic learning curves, from 95% to 75%. This form of representation provides a good view of how learning is intense at the beginning of the production process and it stabilizes later on. It also shows well how learning is more intense and cost reductions are bigger for a 75% curve than for a 95% curve.

Generic learning curves.

Generic learning curves.

However, in the previous curve it is difficult to distinguish the 50th and the 114th units which are needed for the calculation. Thus, I plotted the same curves in with a log scale for the numbers of units produced in the graphic below:

Boeing 787 learning curve in 2013 calculation, delta unit cost between 50th & 114th units.

Boeing 787 learning curve in 2013 calculation, delta unit cost between 50th & 114th units.

In this second graphic I added the information of what relative cost reduction is achieved between the 50th and the 114th units for each of the curves (1).

To make sure that readers are not lost, let’s take the 85% curve. Following that curve, the unit cost of the 50th unit produced is a 40.2% of the 1st unit cost, whereas the unit cost for the 114th unit produced is a 32.9% of the 1st unit cost. The difference is then 40.2% – 32.9% = 7.2%, which represents a 18.0% cost reduction from the 50th unit cost. If you follow the same calculation for each of the curves, you will obtain the following unit cost improvements between 50th and 114th units:

  • 95% curve: -6.1% unit cost improvement
  • 90% curve: -12.0% unit cost improvement
  • 85% curve: -18.0% unit cost improvement
  • 80% curve: -23.8% unit cost improvement
  • 75% curve: -29.6% unit cost improvement

Thus, from the information provided by Boeing of units delivered and unit cost improvement (“approximately 20”, Greg Smith) we can deduce that during 2013 the learning curve that the 787 program has achieved is between 85% and 80%. Thus, in line with aerospace average indicated by NASA (85%), or in line with the reported 84% achieved in the 777.

If we wanted to know what learning curve yields exactly that 20% unit cost improvement, it is now trivial to calculate it: the 83.3% learning curve.

Having made these numbers, and taking into account the words used by Boeing CFO, “unit cost has improved approximately 20% over the past year on the 787-8″, I take it as that the improvement has been close to 20% though probably not reaching it; thus, I understand that the learning curve was rather between 83.3-85% instead of down to 83.3%.

(1) Bear in mind what a relative cost reduction is in contrast to the fact of relative costs represented in the vertical axis as percentages of the initial cost (100%).

2 Comments

Filed under Aerospace & Defence

Learning Curves (case in point)

In a previous post I made an introduction of the concept of learning curve and the gains that can be achieved through experience, with the focus on aerospace industry.

Case in point 1

Few days ago I found an interesting blog post at Leeham News, “Lessons learned from A380, 787 benefit A350“, which discusses lessons learned reportedly being applied into the A350 programme and includes two interesting tables. I will use one of those tables in order to show an exercise of learning curve calculation, without caring of whether the information included in the table is accurate or reflects actual lead times of A350 at Final Assembly Line (FAL). [I do not validate the information of the table despite of using it for an intellectual exercise.]

A350 days in FAL as reported by Leeham News (Reprinted with permission by Leeham Co).

If we take the lead times reported by Leeham News in the table above, we can calculate to what learning curve profile would those lead times correspond. See the result in the graphic below:

Learning Curves.

Learning Curves.

The information reported by Leeham News corresponds to a learning curve between 85% and 90%, about 88%. If figures resemble the reality, between the first and second units, the learning was closer to 95%, however, between the 2nd and 3rd it improved greatly. Since the 3rd unit, the learning is more stabilized at about 88%. [Again, having made this calculation as an exercise does not validate the information taken as an input]

It is important to bear in mind the units used in this calculation are days. Days of assembly are linked to unit production costs, but not necessarily in a linear fashion, as it will depend on the labor / automation being employed in the production of each unit, which may change as production evolves. It is also important to note, that the example of learning curve calculated would refer only to assembly at FAL and not to the overall production process, from material costs, production at earlier stages of the manufacturing process, etc. The value added at FAL is but a minor percentage of the value of an airplane.

I leave for a following post a case in point 2, with the learning curve of the 787 during 2013.

1 Comment

Filed under Aerospace & Defence

Introduction to Learning Curves

Let me introduce the learning curve effect by quoting directly from the Wikipedia:

“The rule used for representing the learning curve effect states that the more times a task has been performed, the less time will be required on each subsequent iteration. This relationship was probably first quantified in 1936 at Wright-Patterson Air Force Base in the United States, where it was determined that every time total aircraft production doubled, the required labour time decreased by 10 to 15 percent.” […]

“Learning curve theory states that as the quantity of items produced doubles, costs decrease at a predictable rate.”

I used the concept of learning curve in a blog post in which I discussed whether and when the Boeing 787 would break even. In that post I referred to Boeing’s target of reaching a 75% learning curve on the 787 program, much more difficult to reach than the 84% that Boeing reportedly achieved in the 777 program.

Why is a curve of 75% more difficult to achieve than a 84% curve? The meaning of the figure “84%” attached to the learning curve is that each time that the number of units produced is doubled, the cost is reduced in 16%, or the 2*nth unit cost is 84% of the unit cost of the nth unit. Thus, a 75% curve would imply that the cost is reduced in 25%, which is a higher cost reduction than 16%, and, thus, more difficult to achieve.

On the other hand, NASA, in its Learning Curve Calculator, offers some guidance on learning curves for different industries and mixes of hand labor and machining work:

  1. Aerospace 85%
  2. Shipbuilding 80-85%
  3. Complex machine tools for new models 75-85%
  4. Repetitive electronics manufacturing 90-95%
  5. Repetitive machining or punch-press operations 90-95%
  6. repetitive electrical operations 75-85%
  7. Repetitive welding operations 90%
  8. Raw materials 93-96%
  9. Purchased Parts 85-88%

How is the concept of learning curve calculated? (from Wikipedia: )

Now the equation for the unit curve is given by:

Y_x = K x^{\log_2 (b)}

where

  • K is the number of direct labour hours to produce the first unit
  • Yx is the number of direct labour hours to produce the xth unit
  • x is the unit number
  • b is the learning percentage (expressed as a decimal)

How does a learning curve look like? (from Wikipedia) Actual examples of curves in both linear and logarithmic scales would be:

The concept of learning curve is indeed used in aerospace, however, coming back to the 787 program, Boeing does not disclose outright what is the actual learning curve it is achieving in its program. Nevertheless, in its investor relations conferences it provides information here and there of cost savings achieved, etc. This can be interpreted as derived from learning curve effects, and would permit to build a model, even if based on scarce information.

See some of the hints that Boeing provides:

“We continue to see progress in key operational performance indicators and unit costs, as we further implement production efficiencies and stabilize the overall production system on the 787 program. Unit cost has improved approximately 20% over the past year on the 787-8 […]”, Greg Smith, Boeing EVP – CFO at Q4 2013 Earnings Conference.

“[…] as we continue to make improvements 787 unit cost […]”, Greg Smith, Boeing EVP – CFO at Q4 2013 Earnings Conference.

“when you look at flow-time, you look at unit cost at Charleston whether it’s final, mid, or (aft) it made great progress there. And the team has been very focused on continuing that progress going forward. We have experienced a higher number of jobs behind schedule in the mid-body section, and that’s really due to, if you think about it, you are introducing the Dash-9 at the same time going to 10 a month. […], we’ve applied additional resources. We know how to do this and we’ll get those jobs back to what we view as a more acceptable level. So we got mitigation plans.” Greg Smith, Boeing EVP – CFO at Q4 2013 Earnings Conference.

“This morning we announced plans to increase 787 production beyond the 10 per month we’re on track to achieve this year to 12 per month in 2016 and then 14 per month, before the end of the decade. […], capture productivity and learning improved profitability […]” Jim McNerney, Boeing Chairman, President and CEO at Q3 2013 Earnings Conference.

“We’ve added another line or sorry, a position within the line, where we’re doing the wing, body joint earlier in the process and this is through experience after 134 airplanes, the teams are really coming up with better ideas or improvements on how to increase flow and that’s going to require some upfront investment. But obviously in the units to come after we’ll see that improvement again in flow and productivity.” Greg Smith, Boeing EVP – CFO at Q3 2013 Earnings Conference.

“[…] the flow time reductions, we’ve had in our factories, the hours per unit, the productivity per whatever are increasing significantly on all of our programs.” Jim McNerney, Boeing Chairman, President and CEO at Q3 2013 Earnings Conference.

5 Comments

Filed under Aerospace & Defence

Société des moulins de Bazacle

The Vereenigde Oost-Indische Compagnie (VOC) or the (United) Dutch East India Company is widely regarded as the first company to have issued stock. It was at least the only company traded at the time in Amsterdam stock market at the Dam, what is regarded as the first ever stock market. I wrote about it in the review of the bookConfusión de Confusiones” by José de la Vega (Confusion of Confusions in English).

However, I had read some time ago about the Bazacle in Toulouse, and a disputing argument behind it. I went to visit it this weekend, in order to learn more from it.

The word bazacle in French means ford, or a shallow place in a river where one can easily cross it. The Bazacle in Toulouse is located at a place where the river Garonne makes a turn to the left, becoming quite wide and shallow. Apparently in ancient times, it bifurcated in several branches and people did use to cross the river there. Some time later a bridge crossed the river at that location.

View of The Bazacle, Toulouse.

View of The Bazacle, Toulouse.

At the end of the XII century, permission was granted to build a sort of dam and some mills. Those mills, according to the sign post outside of the Bazacle (see the picture above) were widely admired up to the French Revolution, being regarded as the largest of the type in Europe and appearing in the encyclopedia of Diderot and D’Alembert.

The argument in dispute comes next: the Société des moulins de Bazacle was financed by an association of noblemen who shared the profits of the company. Thus, this company is also regarded as the most ancient joint-stock company. The shares from the company could be traded at the market Toulouse, their value fluctuating and depending on the yields of the mills. Shouldn’t then be Toulouse regarded as the first stock market ever?

The Bazacle Milling Company ceased to exist in 1946, when it was acquired by EDF, French national electricity company. The Bazacle today has a museum on the use of water, energy, origin of electricity, etc., hosts temporary art exhibitions and has as a main attraction a fish ladder, permitting migratory movements of some species.

View of the Bazacle, its fish ladder and the river Garonne.

View of the Bazacle, its fish ladder and the river Garonne.

Leave a comment

Filed under France, Investing

The Early History of the Airplane

"The Early History of the Airplane", by Orville and Wilbur Wright (The Project Gutenberg).

“The Early History of the Airplane”, by Orville and Wilbur Wright.

Few weeks ago I read “The Early History of the Airplane”, by Orville and Wilbur Wright (find it in The Project Gutenberg). It is a short book or rather a compilation of 3 articles by the brothers (30 pages in the e-reader version I used). The 3 articles are:

  1. The Wright Brothers’ Aeroplane, by Orville and Wilbur Wright.
  2. How We Made the First Flight, by Orville Wright.
  3. Some Aeronautical Experiments, by Wilbur Wright.

In these articles they provide some insight into how they became attracted to the problem of heavier-than-air self-powered controlled flight, what were the difficulties they faced, what schools of thought there were at the moment (1), who influenced them, what results and experiments from others they relied upon, the experiments they performed, the results at which they arrived… and, yes, they describe their first and subsequent flights.

I would recommend the book to anyone interested in the field or the historic event, with the sole warning that the book sometimes goes a bit on the technical side (though nothing that cannot be endured for just 30 pages!).

Let me share some passages of the book to offer some insight into the quest:

“[…] yet we saw that the calculations upon which all flying machines had been based were unreliable, and that all were simply groping in the dark. Having set out with absolute faith in the existing scientific data, we were driven to doubt one thing after another, till finally, after two years of experiment, we cast it all aside, and decided to rely entirely upon our own investigations. Truth and error were everywhere so intimately mixed as to be undistinguishable. Nevertheless, the time expended in preliminary study of books was not misspent, for they gave us a good general understanding of the subject, and enabled us at the outset to avoid effort in many directions in which results would have been hopeless.”

We have to bear in mind that the problem was yet to be solved, they were exploring uncharted territory… what route to take?

“To work intelligently, one needs to know the effects of a multitude of variations that could be incorporated in the surfaces of flying machines. The pressures on squares are different from those on rectangles, circles, triangles, or ellipses; arched surfaces differ from planes, and vary among themselves according to the depth of curvature; true arcs differ from parabolas, and the latter differ among themselves; thick surfaces differ from thin, and surfaces thicker in one place than another vary in pressure when the positions of maximum thickness are different; some surfaces are most efficient at one angle, others at other angles. The shape of the edge also makes a difference, so that thousands of combinations are possible in so simple a thing as a wing.

We had taken up aeronautics merely as a sport. We reluctantly entered upon the scientific side of it. But we soon found the work so fascinating that we were drawn into it deeper and deeper. […]”

On the other hand, one may think that after all combustion engines were already in use in cars, propellers were used in ships…

We had thought of getting the theory of the screw-propeller from the marine engineers, and then, by applying our tables of air-pressures to their formulas, of designing air-propellers suitable for our purpose. But so far as we could learn, the marine engineers possessed only empirical formulas, and the exact action of the screw-propeller, after a century of use, was still very obscure. As we were not in a position to undertake a long series of practical experiments to discover a propeller suitable for our machine, it seemed necessary to obtain such a thorough understanding of the theory of its reactions as would enable us to design them from calculations alone. What at first seemed a problem became more complex the longer we studied it. With the machine moving forward, the air flying backward, the propellers turning sidewise, and nothing standing still, it seemed impossible to find a starting-point from which to trace the various simultaneous reactions. Contemplation of it was confusing. After long arguments we often found ourselves in the ludicrous position of each having been converted to the other’s side, with no more agreement than when the discussion began.”

Nevertheless, they managed to overcome all those difficulties in just 2 years…

“The first flights with the power machine were made on December 17, 1903. Only five persons besides ourselves were present. These were Messrs. John T. Daniels, W. S. Dough, and A. D. Etheridge, of the Kill Devil Life-Saving Station; Mr. W. C. Brinkley, of Manteo; and Mr. John Ward, of Naghead. Although a general invitation had been extended to the people living within five or six miles, not many were willing to face the rigors of a cold December wind in order to see, as they no doubt thought, another flying machine not fly. […]”

… but it flew!

These are all excerpts from only the first of the three articles included in the book. There are many more things for you to discover in the book about the engine constraints, the control and stability of the machine, the position of the pilot, the rail system used for the take-off run

(1) The two schools being distinguished by at which side of the problem they dedicated the attention: power flight (Langley, Maxim) versus soaring flight (Lilienthal, Mouillard and Chanute).

NOTE: For enthusiasts of aviation history, some other books or studies the brothers went through:

  • “Bird Flight the Basis of the Flying Art” and articles by Otto Lilienthal.
  • “Empire of the Air”, Louis Pierre Mouillard.
  • “Progress in Flying Machines”, Octave Chanute.
  • “Experiments in Aerodynamics”, by Samuel Pierpont Langley.

2 Comments

Filed under Aerospace & Defence, Books

Boeing 787 orders, cancellations, deliveries & backlog through 2013

At first sight the year 2013 may seem to have been an annus horribilis for the Boeing 787 program with the months-long grounding of the fleet due to the lithium-ion batteries heat runaway issue, the fires that some of the aircraft in the operating fleet suffered, etc. On the other hand, after 4 years of sales impasse (from 2009 to 2012, inclusive), in which the cumulative net orders of those 4 years stood at a negative 62 aircraft cancelled, in 2013 Boeing recorded 183 new orders against just a single cancellation. Thus, 182 net orders. That is the 3rd best year in sales since the program was launched in 2004.

Last year, I wrote a post wondering whether the grounding of the fleet could be translated into some cancellations. Well, it didn’t so far. Quite the contrary, it got some big contracts from American Airlines, Singapore Airlines, Etihad, British Airways and GECAS.

In last year’s post I included a graphic that I have updated for this post, in order to reflect this recovery and have in one snapshot a view of the orders, cancellations, (net orders), deliveries and backlog.

787 orders, cancellations, deliveries and backlog through 2013.

787 orders, cancellations, deliveries and backlog through 2013.

Leave a comment

Filed under Aerospace & Defence