“En Andalucía lo que sabe un niño de diez años es lo que sabe uno de ocho en Castilla y León”.
Estas declaraciones, pronunciadas hace un mes por Isabel García Tejerina, vicesecretaria de Acción Social del PP y ex ministra de Agricultura, Pesca, Alimentación y Medioambiente de abril de 2014 a junio de 2018, suscitaron una gran polémica en España, y a mí me dieron la idea de hacer un ejercicio simpático a partir de los últimos resultados de PISA, en 2015.
Recordatorio: PISA es el acrónimo de Programme for International Student Assessment, unas pruebas estandarizadas realizadas por la OECD que se hacen a alumnos de secundaria (15 años) de más de 60 países en las materias de matemáticas, ciencia y compresión lectora. Los resultados de las pruebas de 2015 se pueden encontrar aquí. Los resultados por comunidades de España se pueden encontrar aquí. En la gráfica de debajo se puede ver la presentación de los resultados de compresión lectora que se ofrece en el informe.

Viendo esa gráfica, mi intuición parecía confirmarse así que le dediqué un par de horas a desarrollarla. Partiendo de la siguiente “premisa”:
“El mejor castellano, el mejor español se habla en Valladolid”.
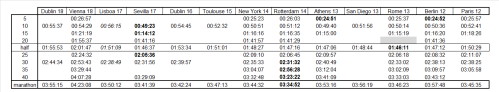
Esta afirmación se escucha a menudo en España. Así, que quise comprobar si los resultados de PISA de comprensión lectora iban en esa línea, y contrastarla con una derivada de esa afirmación, ver si cuanto más se aleja uno de Valladolid peor se habla español. Para ello, recogí los resultados por comunidad autónoma y los comparé con la distancia media (en kilómetros) de cada comunidad autónoma a la ciudad de Valladolid (1). Con ello obtuve la tabla de debajo.

Y los datos de dicha tabla se pueden presentar de forma inmediata en la siguiente gráfica, a la que añadí una línea de tendencia a partir de los resultados de Castilla y León.

En la gráfica se percibe cómo cuanto mayor es la distancia media de una comunidad autónoma a Valladolid, peor es el resultado de comprensión lectora de PISA 2015. La correlación entre las dos series de datos es de 0.47 (2), que sube a 0.53 para la España peninsular (la comprensión lectora en las islas Canarias aun siendo la tercera más baja de la lista no está en proporción con la gran distancia a Valladolid (3)).
De forma coloquial, entonces se podría decir que sí, que el mejor español se habla (de hecho sería se lee) en Valladolid, y que cuanto más se aleja uno de Valladolid peor se habla español (de hecho sería peor se comprende el español leído).
—
Un comentario final sobre comunidades autónomas como Baleares, Cataluña, Galicia, Navarra o País Vasco. En estas comunidades autónomas, las pruebas de PISA de compresión lectora se realizaron total o parcialmente en lenguas distintas del castellano (4). Siguiendo la teoría que en esta entrada se pretende demostrar de modo jocoso, “cuanto más se aleja uno de Valladolid peor se habla español”, si en esas comunidades las pruebas de PISA se hubieran hecho enteramente en español, los resultados de esas comunidades, dada su lejanía a Valladolid habrían sido peores, y más cercano al indicado por la línea de regresión (5).
—
(1) De Wikipedia se obtienen las coordenadas geográficas medias de cada comunidad autónoma. En la siguiente página hay un calculador de distancia entre cualesquiera dos puntos a partir de sus coordenadas.
(2) Una correlación a partir de 0.5 se suele considerar como fuerte.
(3) Siguiendo la regresión, para la distancia de Canarias a Valladolid (1,798 km) el resultado seria 387, mucho menor que los 483 obtenidos en la prueba.
(4) En particular:
- País Vasco: un 25% de los alumnos hicieron la prueba en euskera (en su mayoría del modelo D, con puntuación media 483, por debajo del 491 general), el resto en castellano. El informe del gobierno autonómico ofrece mucho detalle sobre las puntuaciones sacadas por los alumnos de cada opción y el idioma que se habla en casa.
- Navarra: el informe sobre los resultados que ofrece gobierno navarro no da muchos detalles, solamente indica que los alumnos de 9 de los 52 centros que hicieron las pruebas, las hicieron en euskera (los estudiantes de los modelos B/D; los de los modelos A/G la hicieron en castellano). Otros 8 centros hicieron pruebas en ambos idiomas. El informe del gobierno navarro no da más información, ni respecto al número de alumnos en cada idioma, ni en cuanto a los resultados en cada idioma.
- Galicia: el gobierno gallego en su web no da mucha información, más allá de felicitarse por obtener unos resultados mejores que la media nacional.
- Baleares: el gobierno balear publica un informe donde se indica que los alumnos que en casa hablan en catalán obtienen mejores resultados (503 vs 479; siendo un 36.4% catalanoparlantes), pero no ofrece información al respecto de cuántos estudiantes hicieron la prueba en un idioma u otro (o si se hicieron enteramente en catalán) y de los respectivos resultados.
- Cataluña: todos los alumnos realizan las pruebas en catalán. El informe del gobierno regional solamente indica que los alumnos catalanes obtienen resultados de comprensión lectora un resultado mayor que la media nacional (500 vs 496), pero no habla de la brecha que hay entre los resultados obtenidos en Cataluña entre alumnos catalanoparlantes y castellanoparlantes (525 vs 487, en pruebas realizadas en catalán; ver informe).
(5) Un caso particular relacionado con esta afirmación se da con el País Vasco. En ese caso los resultados globales son peores de lo que indica su distancia a Valladolid (línea de regresión). Y se da el caso de que los resultados de los examinados en euskera son peores que los examinados en castellano.