At the beginning of this year, I wrote a post titled “Boeing vs. Airbus: CEO compensation (2013)” in which I compared the compensation of both CEOs. Even if the post was published in 2015, as I wrote it at the beginning of the year the latest information available from both companies was the compensation of 2013.
A few days ago, I saw that this post received a larger than usual amount of visits which reminded me that now, at the end of the year 2015, we can find the same information for the 2014 fiscal year. Thus, this follow on post.
As both Boeing and Airbus are public companies, the information about their CEOs compensation is public and can be found in the annual report and proxy statement from each one. I will just copy the information below for comparison and future reference.
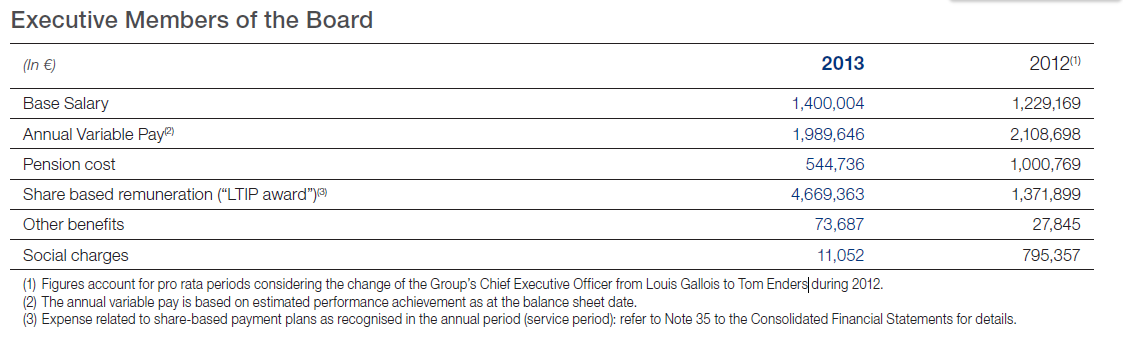
Airbus Group CEO, Tom Enders’ 2014 compensation (financial statements here, PDF, 4.2 MB).
Airbus Group’s Tom Enders 2014 compensation.
Boeing CEO, Jim McNerney’s 2014 compensation (proxy statement here, PDF, 1.0MB)
Over a year ago, I wrote a post about a speech I gave at the then prospective Toastmasters club that some colleagues were pushing to set up within Airbus in Toulouse. Yesterday, we had the 48th session of the club. And yesterday, the club president (Sarah) announced that the club, Airbus Speakers Toulouse, is now a chartered club (1). For this achievement, I wanted to congratulate our colleague Eduardo, who a few months ago left Toulouse for Seville:
Today, our club president announced that #Airbus Speakers Toulouse is now a @Toastmasters chartered club (#3907012). Hats off to @edhered.
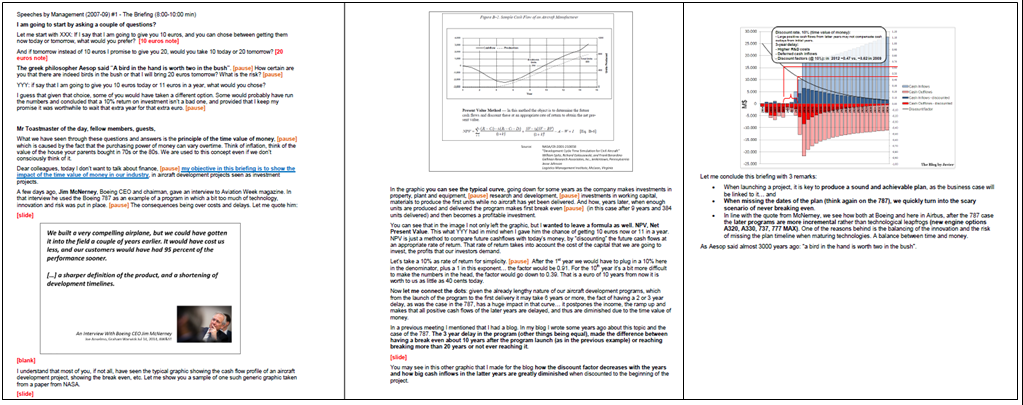
Coincidentally, yesterday I was giving a speech at the club. It was the second project of the advanced manual “Speeches by Management” (2), that is “The Technical Speech”. I had to convert a technical paper into a speech, use a technique called “inverted-pyramid” and effectively read out the speech. This was a challenge in the sense that, since long time ago, I don’t use notes for the speeches I prepare. I don’t like it. And this time, I didn’t need them either. But as part of the exercise I forced myself to use them, in order to practice for a situation in which I might need them. That is Toastmasters: practice, practice, practice. (3)
In order to read out the speech, the manual gave tips on how to write the speech in paper: large fonts, short sentences, bottom of each page blank, etc., very useful tips. See below how for a 10-minute speech, about 1,000 words (4), it took 7 pages, instead of about 2 that it would have normally taken (find here the speech) [PDF, 623 KB].
Above you can see how I made some grammar corrections, how I deleted some sentences which did not sound well, how I annotated some instructions (e.g. to distribute copies of the paper), how I emphasized some words and… how I introduced some last-minute adaptations. In Toastmasters’ meetings we normally have a word of the day which speakers should strive to introduce in their speech. Yesterday’s one was split. You can see how upon discovering it at the beginning of the meeting, I scanned my speech and located the 3 places in which I would insert it (which I did in the delivery). 🙂
In our club, we not only have a word of the day but we have a theme of the day, picked by the Toastmaster of the day (5). Yesterday’s theme was Hollywood. You can see how, as soon as I learned about the theme, I decided to make reference of a movie which featured Chuck Yeager (6) as I was quoting a couple of sentences from him. Funny enough, I had learned about that movie thanks to my brother Jaime just a couple of days before.
The speech talks about safety in general aviation, putting the emphasis on precautionary landings when the situation deteriorates. The idea of the speech comes from a safety note published by my flying instructor, Thierry, some time ago in the internal bulletin of the aeroclub. He referred then, and I do so in my speech, to a couple of studies from the French Bureau d’Enquêtes et d’Analyses (BEA), principally one called “Objective: Destination” [PDF, 318 KB].
Finally, see below the video of the speech.
The recording starts about 30″ after the speech started and the quality is not very good. A good part of the image is taken by the table in which the camera rests and the light is not optimal. The sound is not great either, as neither is my vocalisation. In fact, that was one of the criticisms that I got, as part of a generally good feedback (7): I should vocalise more clearly. Nevertheless, I must say that I enjoyed delivering it.
—
(1) That is in Toastmasters language that we are an official club within the organization.
(2) From the version of 2009, as I have later learned that manual contents and organization have changed since then.
(3) By the way, for this speech: I had it written 4 days ahead of the meeting. I rehearsed it 8 times. Seven of them having Luca as an attentive mentor.
(4) At my speaking pace.
(5) The master of ceremonies in Toastmasters language.
(6) A NASA flight test pilot.
(7) Feel free to comment and provide feedback below :-).
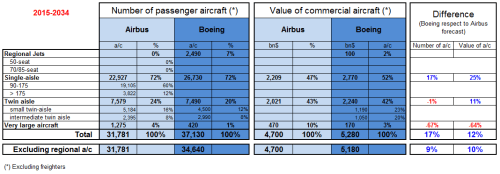
In previous years, I havepublished comparisons of both Airbus’ and Boeing’s forecasts (Current Market Outlook, CMO, PDF 6.5MB). You can find below the update of such comparison with the latest released figures from both companies.
Comparison of Airbus GMF and Boeing CMO 2015-2034.
Some comments about the comparison:
Boeing sees demand for 9% more passenger aircraft (excluding regional a/c) with a 10% more value (excluding freighters). The gap is the same as in 2014 (in previous years Boeing forecasted up to 14% more aircraft).
In relation to last year studies, Airbus has increased demand by ~1,200 aircraft about the same increase seen at Boeing’s.
Boeing continues to play down A380 niche potential (67% less a/c than Airbus’ GMF). This year, Airbus has increased in about 50 units its forecasted demand for the VLA segment.
Both companies’ forecast for the twin aisle segment is nearly identical: ~7,500 aircraft (Airbus sees demand for about a 100 more than Boeing). The mix between small and intermediate twins varies, 700 units up and down. However,Boeing’s wide-bodies mixis not to be taken as engraved in stone, see the erratic trend in the last yearshere.
On the other hand, Boeing forecasts about 3,800 single-aisle more than Airbus (the gap has widened in 200 units this year, lower than in 2013 forecasts though). Boeing doesn’t provide in 2015 CMO the split between more or less than 175 pax capacity airplanes.
In terms of RPKs (“revenue passenger kilometer”), that is, the number of paying passenger by the distance they are transported, they see a similar future: Airbus forecasts for 2034 ~15.2 RPKs (in trillion, 4.6% annual growth from today) while Boeing forecasts 16.15RPKs (4.9% annual growth).
The main changes from last year’s forecasts are:
Both manufacturers have increased their passenger aircraft forecast in ~1,200 a/c.
Both manufacturers haveincreased the volume (trn$)of the market in these 20 years, by about 300bn$ or 6.5%(excluding regional jets and freighters).
Some lines to retain from this type of forecasts:
Passenger world traffic (RPK) will continue to grow about 4.6% per year (4.9% according to Boeing). This is, doubling every ~15 years.
Today there are about 17,354 passenger aircraft around the world(according to Airbus; 17,350 in Boeing’s CMO), this number is about 500 a/c more than the year before (3% increase) and will more than double over the next 20 years to above 35,749 a/c in 2034(over 37,990 as seen by Boeing, excluding regional jets).
Most deliveries will go toAsia-Pacific, 40% or 12,596 passenger aircraft (according to Airbus).
Domestic travel in China will be the largest traffic flowin 2034 with over 1,600bn RPK (according to Airbus (x 3.8 times more than today’s traffic), or 1,704bn RPK according to Boeing), or11% of the World’s traffic.
About 13,400 aircraft will be retired to be replaced by moreeco-efficient types.
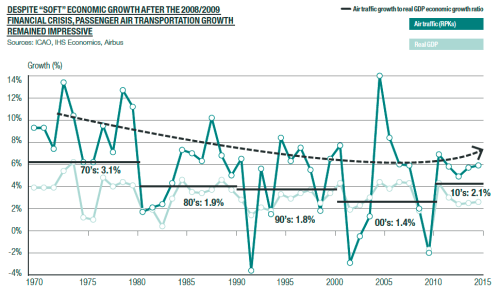
GDP and traffic growth (source: Airbus 2015 GMF).
As I do every year, I strongly recommend both documents (GMF and CMO) which provide a wealth of information of market dynamics.
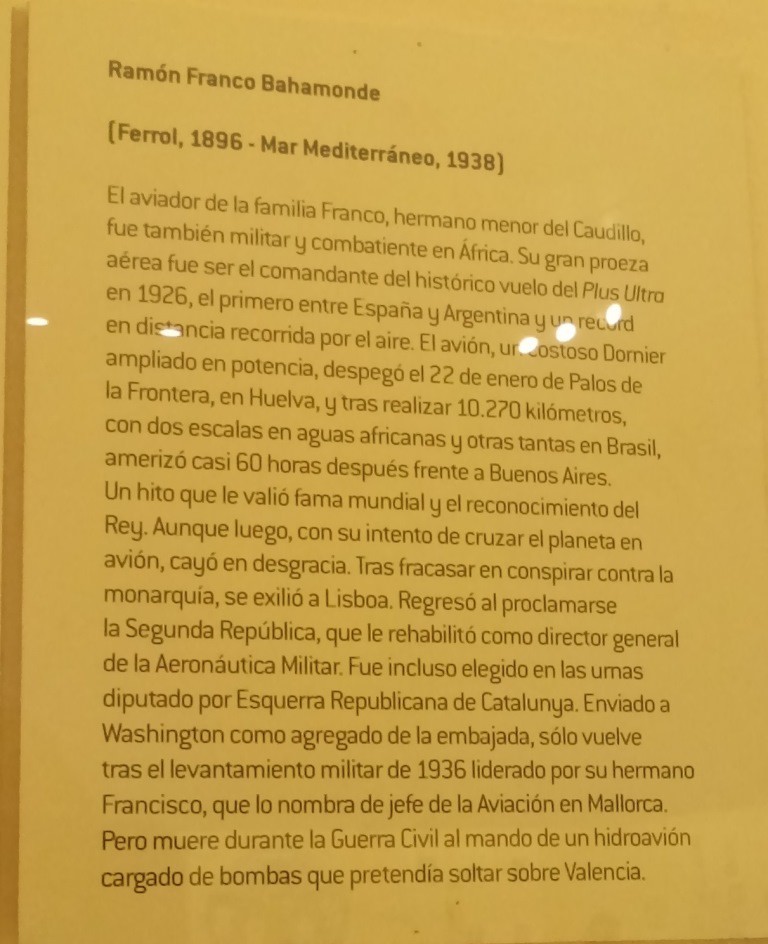
Durante mis últimas vacaciones en España, vi un tuit de la cuenta de Iberia promocionando la exhibición “Pasión por volar” en el Museo ABC (1). Dado que pocos días después, el viaje me llevaría a Madrid, me anoté la visita.
La exhibición ofrecía un breve repaso del desarrollo de la aviación desde principios del siglo XX hasta nuestros días con énfasis en España. El recorrido se basaba sobretodo en archivos (fotos, dibujos y textos) del periódico, trajes de azafatas de Iberia, fotos y maquetas de aviones de Iberia, y maquetas e imágenes de aeropuertos aportados por AENA, pequeños apuntes biográficos de algunos de los pioneros de la aviación…
Eché de menos la participación de Airbus como sponsor y como heredera de CASA, Hispano Aviación, etc., y como fabricante de aviones en España. De todos modos en la propia exhibición se indicaba que esta exposición tampoco pretendía ser exhaustiva y refería al Museo del Aire a tal efecto.
Carteles de Iberia. Siempre que va uno a un museo relacionado con la aviación se encuentra con carteles que son auténticas obras de arte. Carteles que le daban al hecho de volar un toque de ensueño. Si esa tradición no se ha perdido, al menos no conserva su misma aura. Los primeros carteles de la exposición venían firmados, precisaban el año, la introducción de la línea que se abría o promocionaba… Los últimos posters apenas si son una fotografía y un logo de la compañía.
El catálogo de la exposición. Antes de salir del edificio pasé a recoger a Luca en la tienda del museo, y allí vi el libro catálogo sobre la exposición. A pesar de que había tomado varias fotos, me decidí a comprarlo (18€) (2). Una gran decisión. En el libro hay bastantes más fotos, artículos, ensayos y curiosidades de las que había en la propia exhibición. De la misma forma me habría gustado comprar (al menos tener la posibilidad de hacerlo) alguna réplica de los posters de Iberia; pero no era posible. Pienso en la cantidad de posters del pintor Toulouse-Lautrec que uno ve adornando pisos, tiendas, bares… Si hubieran hecho una edición de posters de los carteles expuesto, creo que habría sido un éxito.
Maquetas y fichas técnicas de los aviones. Aquí los organizadores de la exhibición lo podrían haber hecho mejor. Maquetas y fichas estaban separadas. Recuerdo una pareja preguntándose por un avión “grande” (porque la maqueta era la más grande de las expuestas – sobretodo cuestión de escala) y evocando el avión que les había traído de algún origen en América del Sur, preguntándose si sería el mismo (la maqueta era un A330). No todo el mundo reconoce un avión con solo verlo.
Last Friday, while reading the Seattle Times article “Boeing CEO took home almost $29M last year” (referring to 2014) I was reminded of a recent conversation with some colleagues on the compensation of Boeing vs. Airbus Group CEOs.
As both companies are public companies, this information is public and can be found in the annual report and proxy statement from each one. I will just copy the information below for comparison and future reference. I use 2013 references to compare both at the same exercise, as 2014 annual report from Airbus Group is not yet available.
Airbus Group CEO, Tom Enders’ 2013 compensation (annual report here, PDF, 1.4MB)
Airbus Group’s Tom Enders 2013 compensation.
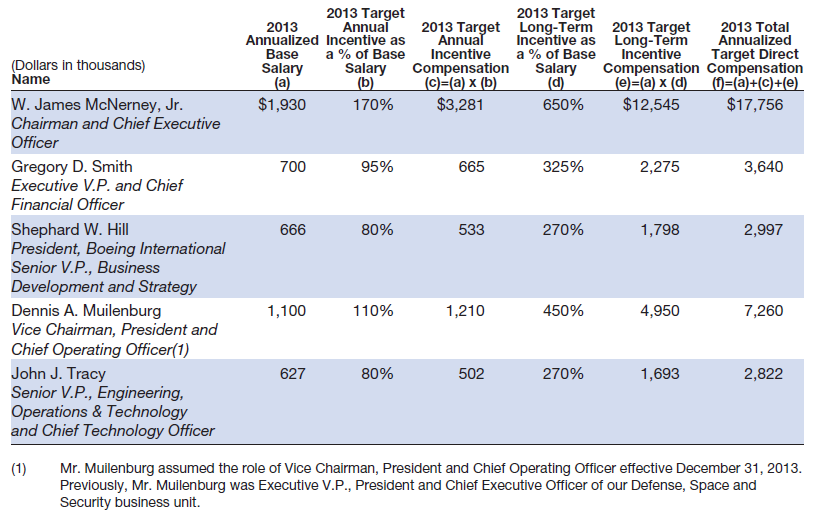
Boeing CEO, Jim McNerney’s 2013 compensation (proxy statement here, PDF, 1.1MB)
Boeing’s Jim McNerney 2013 compensation.
Just as a complement, see in this article from The Washington Post “The pay gap between CEOs and workers is much worse than you realize“, based on a study by Harvard Business School, how the ratios of compensation between CEO and the average worker are in different countries, compared to what respondents to a poll said those ratios should ideally be.
Last Friday, Airbus Group announced its 2014 full year financial results at a press conference in Munich (Germany). You can find here [PDF, 785KB] the presentation used at the conference. In general, the results have been very positive in most metrics. There is one that in my opinion especially deserves attention, see it bellow:
AIRBUS 2014 results – backlog.
Airbus has a record backlog of 6,386 civil aircraft.
In 2014, Airbus delivered 629 commercial aircraft. That is why, in the presentation it is stated “> 10 years of deliveries”. In essence, one may see it as if Airbus airplanes were sold out for the next 10 years! Of course, that is not the case for all product lines (think A330, A380) and will not be the case as a production ramp-up is announced in the A320ceo line.
Nevertheless, to put it into perspective, I wanted to compare this backlog to the historical aircraft deliveries of Airbus (which can be found here). Since its first delivery, an A300B2 back in May 1974, through the end of January 2015, Airbus had delivered 8,921 aircraft. With the information of yearly deliveries I compiled the graphic below, yearly per model and cumulative deliveries for all models combined.
AIRBUS deliveries through January 2015.
Take a look at the cumulative deliveries.
On the occasion of the 8,000th delivery, on August 2013 (an A320 for AirAsia) Airbus published an article making a review of all the main delivery landmarks.
the 1st delivery, in May 1974, an A300B2.
the 1,000th delivery, in March 1993, an A340-300,
the 2,000th handover, in May 1999, an A340-300,
the 3,000th delivery, in July 2002, an A320,
the 4,000th delivery, in September 2005, an A330-300,
the 5,000th delivery, in December 2007, an A330-200,
the 6,000th delivery, in January 2010, an A380,
the 7,000th handover, in December 2011, an A321,
the 8,000th delivery, in August 2013, an A320 featuring Sharklets,
the 9,000th delivery… somewhere in the Spring 2015.
You can see that since the first delivery in 1974, it took Airbus almost 19 years to deliver the first 1,000 aircraft.
It took over 35 years to deliver the first 6,000 aircraft. That is what today it has as backlog…
In previous years, I have published comparisons of both Airbus’ and Boeing’s forecasts (Current Market Outlook, CMO, PDF 5.3MB). You can find below the update of such comparison with the latest released figures from both companies.
Comparison of Airbus GMF and Boeing CMO 2014-2033.
Some comments about the comparison:
Boeing sees demand for 9% more passenger aircraft (excluding regional a/c) with a 10% more value (excluding freighters). The gap is closing, as in previous years Boeing forecasted up to 14% more aircraft.
In relation to last year studies, Airbus has increased demand by ~2,000 aircraft whereas Boeing by ~1,000.
Boeing continues to play down A380 niche potential (59% less a/c than Airbus’ GMF). This year, both companies have reduced in about 100 units their forecasted demand for the VLA segment.
Both companies’ forecast for the twin aisle segment is nearly identical: 7,260 aircraft. The mix between small and intermediate twins varies, 700 units up and down. However, Boeing’s wide-bodies mix is not to be taken as engraved in stone, see the erratic trend in the last years here.
On the other hand, Boeing forecasts about 3,600 single-aisle more than Airbus (the gap has closed in 800 units this year). The largest part of the difference comes in the single-aisles over 175 seats (A321, 737-9).
In terms of RPKs (“revenue passenger kilometer”), that is, the number of paying passenger by the distance they are transported, they see a similar future: Airbus forecasts for 2033 ~14.5 RPKs (in trillion) while Boeing forecasts 15.5 RPKs.
The main changes from last year’s forecasts are:
Both manufacturers have increased their passenger aircraft forecast, ~2,000 a/c Airbus and 1,000 a/c Boeing,.
Both manufacturers have increased the value of RPKs in 2033 (about 5-7%).
Both manufacturers have increased the volume (trn$) of the market in these 20 years, about 6.7% Airbus (to 4.4trn$) and 5.7% Boeing (to 4.86trn$) (excluding regionals and freighters).
Some lines to retain from this type of forecasts:
Passenger world traffic (RPK) will continue to grow about 4.7% per year (5.0% according to Boeing). This is, doubling every ~15 years.
Today there are about 16,855 passenger aircraft around the world (according to Airbus), this number will nearly double in the next 20 years to above 30,555 a/c in 2033 (over 33,000 as seen by Boeing).
Most deliveries to go to Asia Pacific, 39% or over 12,200 passenger aircraft
Domestic travel in China will be the largest traffic flow in 2033 with over 1,500bn RPK, or 11% of the World’s traffic.
Over 12,000 aircraft will be retired to be replaced by more eco-efficient type.
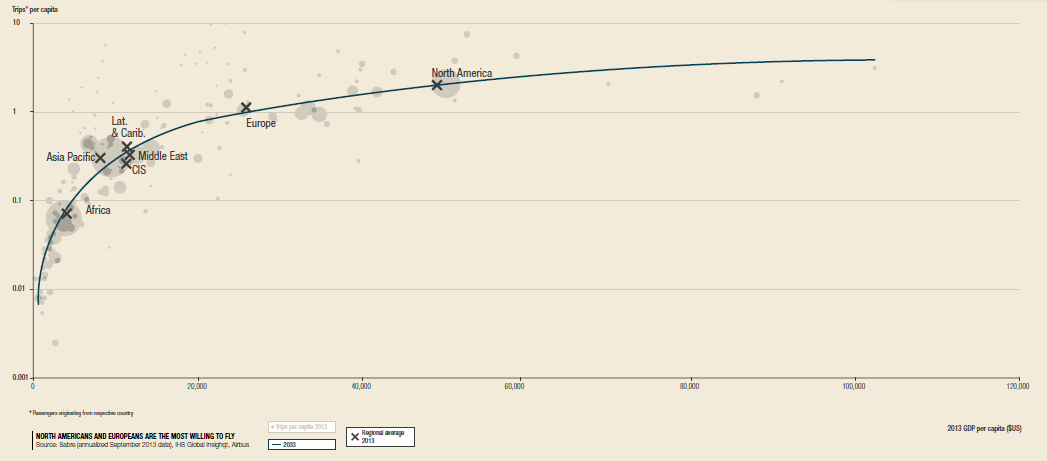
Trips per capita vs. GDP per capita (source: Airbus GMF).
As I do every year, I strongly recommend both documents (GMF and CMO) which provide a wealth of information of market dynamics.
Yesterday, a small event for employees was organized at Airbus Delivery Centre in Blagnac to see the concept airplane E-Fan, a prototype 2-seater electric aircraft. The airplane is expected to go into series production by 2017, by then the design will evolve in a side-by-side seating.
During yesterday’s event, the plane was to make a couple of flights. In the end it only made the first one, which I missed, and thus I didn’t get to see it flying. Nevertheless, I could get into the hangar, where the colleagues involved in the project were starting to disassemble it and I could take some pictures, ask some questions, wander around… #avgeeking.
See below the pictures I took and a video from Airbus Group Youtube channel:
Thanks to the drive of some individuals (Sarah, Eduardo, Dominique) a new Toastmasters corporate club (1) is being created within Airbus in Toulouse, where I work.
I joined Toastmasters in 2007 when I lived in Madrid and I have written often about Toastmasters in this blog, however I had become inactive in the last couple of years. This new initiative is very convenient and thanks to it I am engaging myself again in the association.
The topic of the speech is known for the reader of this blog: impact of delays in aircraft development projects seen as investment projects, the time value of money, discounting cash flows, break even, etc.
The feedback that I got: It was well received, especially the introduction, the interaction with the audience, the structure and how the topic was introduced and the main points called back in the end. However, I lost some individuals with the last slide, which needed some more explanation. I should have simplified the graphic. Some demanded more pauses and better vocalization.
—
(1) Up to now it is a prospect Toastmasters club.
(2) Project #1 of the “Speeches by Management” advanced manual: “The briefing”.
Few days ago I found an interesting blog post at Leeham News, “Lessons learned from A380, 787 benefit A350“, which discusses lessons learned reportedly being applied into the A350 programme and includes two interesting tables. I will use one of those tables in order to show an exercise of learning curve calculation, without caring of whether the information included in the table is accurate or reflects actual lead times of A350 at Final Assembly Line (FAL). [I do not validate the information of the table despite of using it for an intellectual exercise.]
A350 days in FAL as reported by Leeham News (Reprinted with permission by Leeham Co).
If we take the lead times reported by Leeham News in the table above, we can calculate to what learning curve profile would those lead times correspond. See the result in the graphic below:
Learning Curves.
The information reported by Leeham News corresponds to a learning curve between 85% and 90%, about 88%. If figures resemble the reality, between the first and second units, the learning was closer to 95%, however, between the 2nd and 3rd it improved greatly. Since the 3rd unit, the learning is more stabilized at about 88%. [Again, having made this calculation as an exercise does not validate the information taken as an input]
It is important to bear in mind the units used in this calculation are days. Days of assembly are linked to unit production costs, but not necessarily in a linear fashion, as it will depend on the labor / automation being employed in the production of each unit, which may change as production evolves. It is also important to note, that the example of learning curve calculated would refer only to assembly at FAL and not to the overall production process, from material costs, production at earlier stages of the manufacturing process, etc. The value added at FAL is but a minor percentage of the value of an airplane.
I leave for a following post a case in point 2, with the learning curve of the 787 during 2013.