The most (and least) read of the first 500 posts

A classic post of the blog: a recap at each hundredth post dedicated to show which were the most and least read of the first 500 posts. (1)

Since I started the blog in February 2010, the blog has received over 207,000 visits and hundreds of comments.

Find below the list of the top 10 and bottom 10 posts:

1. Impuestos en Francia vs. España
2. Will Boeing 787 ever break-even?
3. Mi adiós a Ibercaja
4. 787 Break Even for Dummies
5. Monaco GP Walking Tour
6. Impuestos en Francia vs. España (actualización 2012)
7. Airbus vs. Boeing, comparison of market forecasts (2012)
8. Beluga vs. Dreamlifter
9. Patek Philippe Caliber 89
10. Airbus vs. Boeing, comparison of market forecasts (2011)

490. Resist the bias to act
491. Bill Clinton endorsing Kiva (video)
492. Risk
493. Europe Day
494. Nothing like a good red wine…
495. What charities do you support?
496. Bye, Vistalegre
497. Boulevards de Colomiers 2014
498. Special assistance vs. free ride
499. Wells Fargo History Museum at San Francisco

Let’s see what I’ll write in the next 100 posts…

(1) I wrote four such posts when I reached the first 100200300 and 400 posts in the blog.

NOTE: the box in the right showing “Current Top Posts” shows the most read ones in the last two days, not the all-time most read ones (the ones above).

1 Comment

Filed under Miscellanea

International Women’s Day, Global Gender Gap and backing women dreams

Today, March 8th it’s International Women’s Day. In the last few days I have seen a significant buzz in social media about the day. In particular I read a couple of pieces that made contribute to the buzz with this post.

World Economic Forum:

Equal pay benefits men, too. Here are four reasons why, backed up by our Global Gender Gap Report. [PDF, 6.1MB]

I liked the approach: “What’s in it for me?” (from the perspective of men, of course) (1).

Take a look at the report (395 pages). I skimmed through it and picked some essentials, especially from a couple of graphics. The Global Gender Gap Index measures gaps in 4 sub-indices: Economic Participation and Opportunity, Educational Attainment, Health and Survival and Political Empowerment. The sources for the data are the International Labour Organisation, World Economic Forum, UNESCO Institute for Statistics, Central Intelligence Agency, World Health Organisation and the Inter-Parliamentary Union. The authors (Ricardo Hausmann (Harvard University), Laura Tyson (Berkeley), Yasmina Bekhouche (World Economic Forum) and Saadia Zahidi (World Economic Forum)) explain their methodology as follows:

There are three basic concepts underlying the Global Gender Gap Index, forming the basis of the choice of indicators, how the data is treated and the scale used. First, it focuses on measuring gaps rather than levels. Second, it captures gaps in outcome variables rather than gaps in input variables. Third, it ranks countries according to gender equality rather than women’s empowerment.

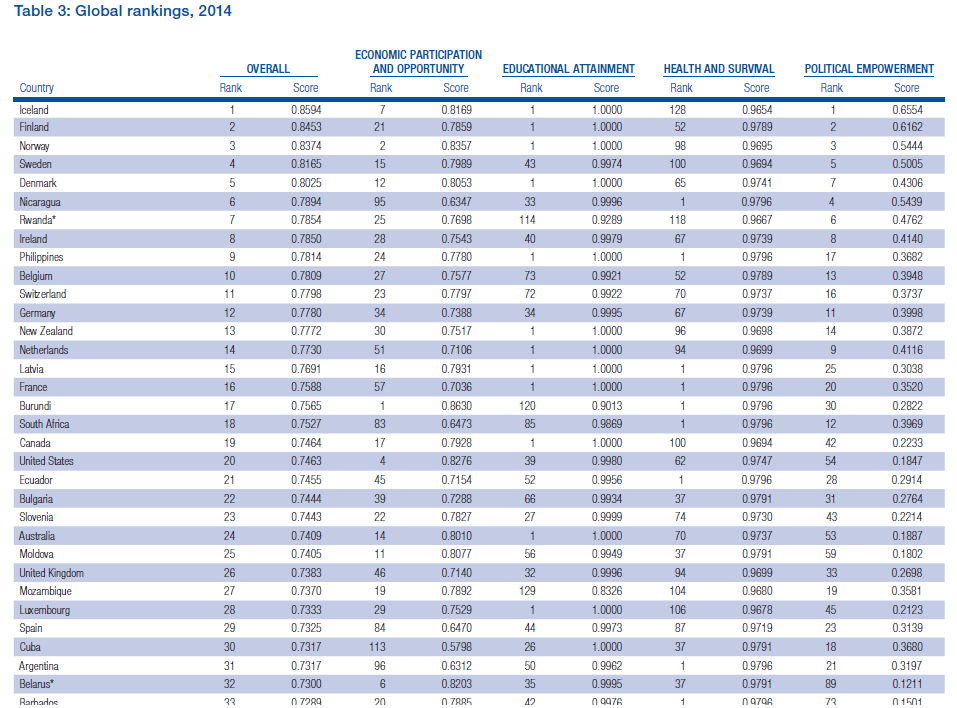
I attach below a screenshot showing the top 30 countries in the list.

Global Gender Gap Index, 2014 ranking, top 30 countries.

Global Gender Gap Index, 2014 ranking, top 30 countries.

Some comments to it:

  • Scandinavian countries are in the top of the list (no surprise here).
  • Some readers will wonder about the top places occupied by Nicaragua, Rwanda… read again the methodology above: “it focuses on measuring gaps rather than levels”.
  • When I see this kind of indices, for personal reasons I focus on the positions occupied by: Denmark #5, Germany #12, Netherlands #14, France #16, Spain #29, Lithuania #44.
  • A curiosity: Spain #29 vs. Cuba #30.
  • No surprises either at the bottom of the list: Bahrain, Turkey, Algeria, Ethiopia, Oman, Egypt, Saudi Arabia, Mauritania, Guinea, Morocco, Jordan, Lebanon, Ivory Coast, Iran, Mali, Syria, Chad, Pakistan, Yemen… which they all have in common that are located in arid subtropical zone and that most of them have at least one letter a in the name.

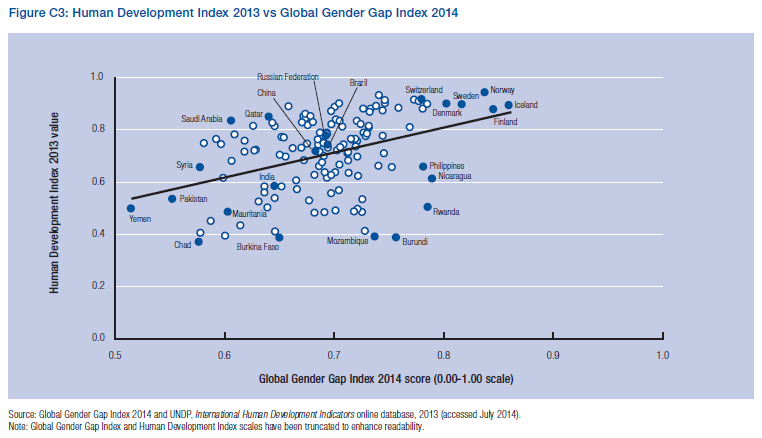
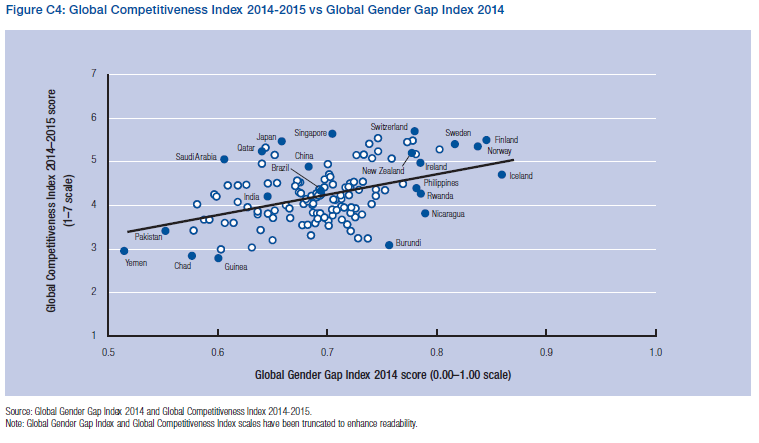
Coming back to the question: “What’s in it for me?” The report shows how countries in which the gender gap is lower also have good scores in several other metrics which improve the conditions of life for men as well. There is the catch. See below the comparison for the Human Development Index and the Global Competitiveness Index:

Human Development Index vs. Global Gender Gap Index.

Human Development Index vs. Global Gender Gap Index.

Global Competitive Index vs. Global Gender Gap Index.

Global Competitiveness Index vs. Global Gender Gap Index.

What can you do to help to close the gender gap? In your community you can do much. See this other open letter also in World Economic Forum from Belinda Parmar, “To men, for International Women’s Day“:

We need you.

We need you to listen. When we tell you about a problem, we don’t want you to jump to a solution for us. We just want to say it out loud to solve it ourselves knowing that you will support us.

We need you to talk. To raise the issue of gender. Don’t worry about saying the wrong thing. Saying the wrong thing is better than saying nothing at all. It’s the only way to start the conversation.

We need you to value our differences. Realise that we bring a different perspective and encourage us to bring our personalities to work, to not feel like we have to put on a ‘male suit.’

One step further: what can you do to help to close the gender gap in the countries at the bottom of the list? (those with the letter a in the names)

A few days ago I received an email from Jason Riggs of Kivathe world’s first and largest crowdfunding platform dedicated to alleviating poverty and expanding financial inclusion (about which I have written before in this blog (2)). Kiva has launched Kiva.org/Dreams to empower even more women to reach for their dreams and they asked me to help them in making this campaign more widespread. Thus, here is my contribution:

By visiting Kiva.org/Dreams, you can back a dream by choosing a woman whom Kiva should lend $25 to. There is no cost to you. By choosing her, you help her to follow her dream of starting or growing her business, sending her children to school, and ultimately, gaining financial independence.

When women have the resources to make their dreams a reality, the world changes. More children go to school, more food is grown, and nations are more peaceful and prosperous. A case in point: if women farmers had equal access to farming assets and finance, they could increase their crop yields up to 30% and 150 million people who go hungry every day would be able to eat.

By contributing to the success of an entrepreneurial woman who has overcome obstacles, we discover so much more about our own resiliency, possibility, and potential. Each of us has a part to play.

 Together we can make dreams a reality for thousands of women around the world. So in honor of International Women’s Day and the power of women, back a dream at Kiva.org/Dreams.

My suggestion: visit the site of Kiva, filter by Yemen, the country at the very bottom of the list and help dreams come true, gender gaps close and turning around the situation.

Happy International Women’s Day!

(1) I like the approach for its different persuasion approach, not like the closing the gap out of equal treatment, fairness, justice… wasn’t engouh.

(2) See other posts about Kiva: My 100th loan with Kiva“, “A Kiva success story

Leave a comment

Filed under Economy, Helping others

Turboprop market vs. oil price (ATR figures 2014 update)

Few weeks ago, the Toulouse-based aircraft manufacturer ATR (Avions de Transport Régional) published a press release reporting some of its numbers for the year 2014 (being a private company, owned by Airbus and Alenia, it does not publish a complete financial annual report). Some of the key figures were:

  • Revenues increased 10% to 1.8bn$.
  • A new record of 83 deliveries (+12%).
  • A new record of sales with 160 firm aircraft orders (plus 120 options). (1)
  • A record backlog at year-end with 280 firm aircraft in the order book.

About 4 years ago, I wrote a post, “Turboprops market different dynamic“, in which I discussed:

[…] how civil turboprop market is unrelated to the larger and more known turbofan civil aircraft market and how its dynamics are completely unrelated to World GDP growth and thus world air traffic growth. […]

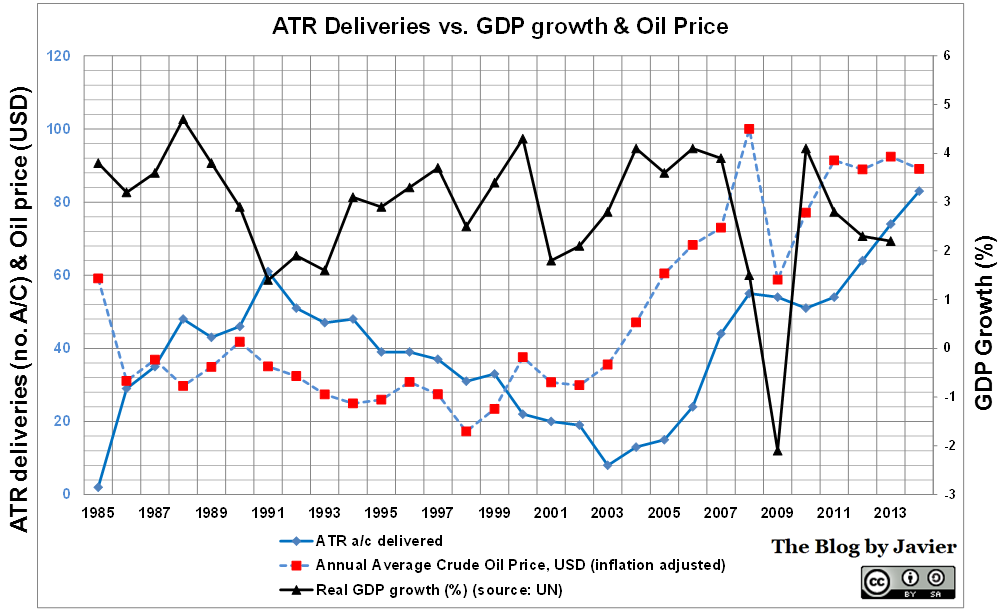
When calculating correlation between the different variables, I discovered that the correlation between GDP and deliveries is rather low, despite of the time lag applied (be it 2, 3, 4 years…). However I found that the oil prices and deliveries did correlate very well with a lag of 5-6 years, yielding coefficients of 0.55-.65, which are rather high.

I wanted to update the calculations I made then and last year, with the information of the 2014 exercise.

ATR deliveries vs. GDP growth and oil price (2014 update).

ATR deliveries vs. GDP growth and oil price (2014 update).

With the last years’ data, correlations are similar:

  • Between oil prices and deliveries: high, above 0.54 from 1 year time lag, increasing through 6 years time lag (when it reaches a maximum of 0.82).
  • Between GDP growth and deliveries: low, not more than 0.34, and negative correlations up from 1 to 5 years time lag.

If there was causality, we could infer that the from the moment that oil prices are computed, till they are taken into regional airlines’ models, the fleet planners identify the need for new turboprops, the case is approved by airlines’ management, discussions start with ATR, negotiations are closed between the airline and the manufacturer, the aircraft are built and delivered to the airline… it takes about 6 years. (2)

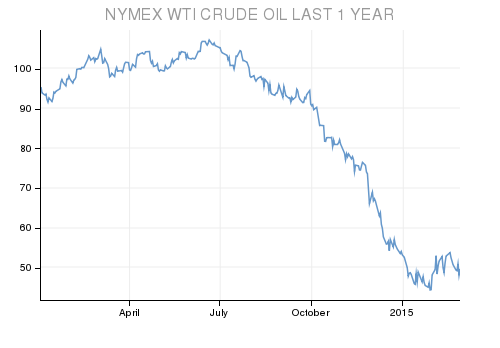
This year the prices of oil have abruptly decreased in the last quarter:

Oil prices drop Q4 2014.

Oil prices drop Q4 2014.

However, this large drop is not yet fully noticed in the comparison made before as the historical database I use (here) only reflects prices up to the end of November and thus the 2014 average is still 89$ vs. 92.4$ in 2013. Even so, taking into account the figures from December (~55$) the year average will drop only to about 86$, not changing much the result.

It would be interesting though to see if oil prices stay low (50-60$) for the full 2015 year. If so, we could check whether the correlation stands and ATR starts to notice it in the form of lower orders (more cancellations?) and this is translated into lower amount of deliveries in about 3 years time (2018?).

(1) Some 18 cancellations that took place in 2014 go untold in the press release, though they are easily deduced from the information of orders, and backlog from 2014 and 2013.

(2) About 3 of those 6 years are consumed from placing the firm order to getting the aircraft delivered, as we can see by the current figures of backlog (280 a/c) and yearly deliveries (83 a/c).

Leave a comment

Filed under Aerospace & Defence

The Theory of Interstellar Trade

This blog post is not about the movie Interstellar, which I haven’t watched yet, but about a rather wonkish paper (as its author would put it) that I stumbled upon very recently.

The American economist and Nobel laureate Paul Krugman wrote in 1978 the paper “The Theory of Interstellar Trade” [PDF, 516KB]. The paper is simply hilarious. One of the best pieces I have ever read. It has just 15 pages and in them the author sets out to search how interest charges should be computed in interstellar trade when goods travel at close to the speed of light. It mixes economy with very light special relativity and great doses of humour. The author himself remarked in the introduction:

It should be noted that, while the subject of this paper is silly, the analysis actually does make sense. This paper, then, is a serious analysis of a ridiculous subject, which is of course the opposite of what is usual in economics.

Well, given today’s ventures, it might not be so silly 😉

Let’s review some of the highlights and conclusions derived from the paper:

To start with, he sets some fundamental considerations:

There are two major features distinguishing interstellar trade from the interplanetary trade we are accustomed to. The first is that the time spent in transit will be very great, since travel must occur at less than the light speed; round trips of several hundred years appear likely. The second is that, if interstellar trade is to be at all practical, the spaceships which conduct it must move at speeds which are reasonable fractions of the speed of light.

Because interstellar trade will take so long, any decision to launch a cargo will necessarily be a very long-term investment project […]

The second feature of interstellar transactions cannot be so easily dealt with (physicists are not as tolerant as economists of the practice of assuming difficulties away). If trading space vessels move at high velocities, we can no longer have an unambiguous measure of the time taken in the transit. The time taken by the spacecraft to make a round trip will appear less to an observer on the craft than to one remaining on Earth. […]

To solve the problem he refers to the Minkowski space-time, and includes the following diagram with the note below:

"Readers who find the Figure II puzzling should recall that a diagram of an imaginary axis must, of course, itself be imaginary".

“Readers who find the Figure II puzzling should recall that a diagram of an imaginary axis must, of course, itself be imaginary”.

By comparing the returns from actual trade between planets with the return of bonds he arrives at the First Fundamental Theorem of Interstellar Trade:

When trade takes place between two planets in a common inertial frame, the interest costs on goods in transit should be calculated using time measured by clocks in the common frame, and not by clocks in the frames of trading spacecraft.

After proving the theorem take a look at this other passage:

theorem


The author then takes on investigating possible arbitrage in interstellar transactions, and arrives to the Second Fundamental Theorem of Interstellar Trade:

If sentient beings may hold assets on two planets in the same inertial frame, competition will equalize the interest rates on the two planets.

It goes without saying that I recommend the reading of this paper.

Leave a comment

Filed under Economy, Investing

Airbus backlog at end 2014 into perspective

Last Friday, Airbus Group announced its 2014 full year financial results at a press conference in Munich (Germany). You can find here [PDF, 785KB] the presentation used at the conference. In general, the results have been very positive in most metrics. There is one that in my opinion especially deserves attention, see it bellow:

AIRBUS 2014 results - backlog.

AIRBUS 2014 results – backlog.

Airbus has a record backlog of 6,386 civil aircraft.

In 2014, Airbus delivered 629 commercial aircraft. That is why, in the presentation it is stated “> 10 years of deliveries”. In essence, one may see it as if Airbus airplanes were sold out for the next 10 years! Of course, that is not the case for all product lines (think A330, A380) and will not be the case as a production ramp-up is announced in the A320ceo line.

Nevertheless, to put it into perspective, I wanted to compare this backlog to the historical aircraft deliveries of Airbus (which can be found here). Since its first delivery, an A300B2 back in May 1974, through the end of January 2015, Airbus had delivered 8,921 aircraft. With the information of yearly deliveries I compiled the graphic below, yearly per model and cumulative deliveries for all models combined.

AIRBUS deliveries through January 2015.

AIRBUS deliveries through January 2015.

Take a look at the cumulative deliveries.

On the occasion of the 8,000th delivery, on August 2013 (an A320 for AirAsia) Airbus published an article making a review of all the main delivery landmarks.

  • the 1st delivery, in May 1974, an A300B2.
  • the 1,000th delivery, in March 1993, an A340-300,
  • the 2,000th handover, in May 1999, an A340-300,
  • the 3,000th delivery, in July 2002, an A320,
  • the 4,000th delivery, in September 2005, an A330-300,
  • the 5,000th delivery, in December 2007, an A330-200,
  • the 6,000th delivery, in January 2010, an A380,
  • the 7,000th handover, in December 2011, an A321,
  • the 8,000th delivery, in August 2013, an A320 featuring Sharklets,
  • the 9,000th delivery… somewhere in the Spring 2015.

You can see that since the first delivery in 1974, it took Airbus almost 19 years to deliver the first 1,000 aircraft.

It took over 35 years to deliver the first 6,000 aircraft. That is what today it has as backlog…

Leave a comment

Filed under Aerospace & Defence

Warren Buffett’s 2014 letter to the shareholders of Berkshire Hathaway

Every last Saturday of February, a must read for the weekend comes out: Warren Buffett’s letter to the Shareholders of Berkshire Hathaway [PDF, 499KB]. This year, it is the 50th anniversary since Buffett took over the company, and thus together with the letter both him and Charlie Munger, his partner and vice chairman, have included as well two letters describing the last 50 years, what made them so successful and what can be expected in the following years. The 3 letters together make up 42 pages, a strongly recommended read.

From this year’s letter, I wanted to bring attention to the following quotes or passages on simplicity of some transactions, on the sale of TESCO, the distinction between volatility and risk, not using borrowed money to invest, consequences of using shares instead of cash for acquisitions, the synergies announced in M&A, the importance of cash, trust and bureaucracy:

***

On simplicity of some transactions and trust. Last year he introduced the acquisition of Nebraska Furniture Mart, this year is the turn of National Indemnity:

[…] since 1967, when we acquired National Indemnity and its sister company, National Fire & Marine, for $8.6 million. Though that purchase had monumental consequences for Berkshire, its execution was simplicity itself.

Jack Ringwalt, a friend of mine who was the controlling shareholder of the two companies, came to my office saying he would like to sell. Fifteen minutes later, we had a deal. Neither of Jack’s companies had ever had an audit by a public accounting firm, and I didn’t ask for one. My reasoning: (1) Jack was honest and (2) He was also a bit quirky and likely to walk away if the deal became at all complicated.

On pages 128-129, we reproduce the 1 1 ⁄2-page purchase agreement we used to finalize the transaction. That contract was homemade: Neither side used a lawyer. Per page, this has to be Berkshire’s best deal: National Indemnity today has GAAP (generally accepted accounting principles) net worth of $111 billion, which exceeds that of any other insurer in the world.

Offer Letter for National Indemnity (retrieved from BRK 2014 annual report [PDF, 2.2MB])

Offer Letter for National Indemnity (retrieved from BRK 2014 annual report [PDF, 2.2MB])

On the advantages of using an animated character as advertising tool in low cost operations:

[…] No one likes to buy auto insurance. Almost everyone, though, likes to drive. The insurance consequently needed is a major expenditure for most families. Savings matter to them – and only a low-cost operation can deliver these. […]

[…] Our gecko never tires of telling Americans how GEICO can save them important money. The gecko, I should add, has one particularly endearing quality – he works without pay. Unlike a human spokesperson, he never gets a swelled head from his fame nor does he have an agent to constantly remind us how valuable he is. I love the little guy.

On his lack of decisiveness in selling TESCO:

[…] An attentive investor, I’m embarrassed to report, would have sold Tesco shares earlier. I made a big mistake with this investment by dawdling.

At the end of 2012 we owned 415 million shares of Tesco, then and now the leading food retailer in the U.K. and an important grocer in other countries as well. Our cost for this investment was $2.3 billion, and the market value was a similar amount.

In 2013, I soured somewhat on the company’s then-management and sold 114 million shares, realizing a profit of $43 million. My leisurely pace in making sales would prove expensive. Charlie calls this sort of behavior “thumb-sucking.” (Considering what my delay cost us, he is being kind.)

During 2014, Tesco’s problems worsened by the month. The company’s market share fell, its margins contracted and accounting problems surfaced. In the world of business, bad news often surfaces serially: You see a cockroach in your kitchen; as the days go by, you meet his relatives.

We sold Tesco shares throughout the year and are now out of the position. (The company, we should mention, has hired new management, and we wish them well.) Our after-tax loss from this investment was $444 million, about 1/5 of 1% of Berkshire’s net worth.

On volatility versus risk:

Stock prices will always be far more volatile than cash-equivalent holdings. Over the long term, however, currency-denominated instruments are riskier investments – far riskier investments – than widely-diversified stock portfolios that are bought over time and that are owned in a manner invoking only token fees and commissions. That lesson has not customarily been taught in business schools, where volatility is almost universally used as a proxy for risk. Though this pedagogic assumption makes for easy teaching, it is dead wrong: Volatility is far from synonymous with risk. Popular formulas that equate the two terms lead students, investors and CEOs astray.

On not using borrowed money to invest:

[…] borrowed money has no place in the investor’s tool kit: Anything can happen anytime in markets. And no advisor, economist, or TV commentator – and definitely not Charlie nor I – can tell you when chaos will occur. Market forecasters will fill your ear but will never fill your wallet.

A confession after having introduce the major mistake of acquiring Berkshire (a sinking textile company) out of stubborness:

Can you believe that in 1975 I bought Waumbec Mills, another New England textile company? Of course, the purchase price was a “bargain” based on the assets we received and the projected synergies with Berkshire’s existing textile business. Nevertheless – surprise, surprise – Waumbec was a disaster, with the mill having to be closed down not many years later.

On his initial strategy of buying low priced small companies and why he changed it:

[…] Most of my gains in those early years, though, came from investments in mediocre companies that traded at bargain prices. Ben Graham had taught me that technique, and it worked.

But a major weakness in this approach gradually became apparent: Cigar-butt investing was scalable only to a point. With large sums, it would never work well.

In addition, though marginal businesses purchased at cheap prices may be attractive as short-term investments, they are the wrong foundation on which to build a large and enduring enterprise. […]

On using shares instead of cash for acquisitions:

Consequently, Berkshire paid $433 million for Dexter and, rather promptly, its value went to zero. GAAP accounting, however, doesn’t come close to recording the magnitude of my error. The fact is that I gave Berkshire stock to the sellers of Dexter rather than cash, and the shares I used for the purchase are now worth about $5.7 billion. As a financial disaster, this one deserves a spot in the Guinness Book of World Records.

Several of my subsequent errors also involved the use of Berkshire shares to purchase businesses whose earnings were destined to simply limp along. Mistakes of that kind are deadly. Trading shares of a wonderful business – which Berkshire most certainly is – for ownership of a so-so business irreparably destroys value.

On the trumpeted synergies announced in M&A:

(As a director of 19 companies over the years, I’ve never heard “dis-synergies” mentioned, though I’ve witnessed plenty of these once deals have closed.) Post mortems of acquisitions, in which reality is honestly compared to the original projections, are rare in American boardrooms. They should instead be standard practice.

On cash:

At a healthy business, cash is sometimes thought of as something to be minimized – as an unproductive asset that acts as a drag on such markers as return on equity. Cash, though, is to a business as oxygen is to an individual: never thought about when it is present, the only thing in mind when it is absent.

American business provided a case study of that in 2008. In September of that year, many long-prosperous companies suddenly wondered whether their checks would bounce in the days ahead. Overnight, their financial oxygen disappeared.

At Berkshire, our “breathing” went uninterrupted. Indeed, in a three-week period spanning late September and early October, we supplied $15.6 billion of fresh money to American businesses.

On trust and bureaucracy:

With only occasional exceptions, furthermore, our trust produces better results than would be achieved by streams of directives, endless reviews and layers of bureaucracy. Charlie and I try to interact with our managers in a manner consistent with what we would wish for, if the positions were reversed.

The books that are recommended this year in the letter are:

  • “Where Are the Customers’ Yachts?”, by Fred Schwed,
  • “The Little Book of Common Sense Investing”, by Jack Bogle,
  • “Berkshire Hathaway Letters to Shareholders”, compilation by Max Olson,
  • a new book in preparation commemorating the 50th anniversary of Berkshire Hathaway under present management.

Another article about Jim Ling in D magazine (from 1982) is recommended to understand the mentality of some CEOs running holdings at the time and why some negative perception towards holdings continue to exist today.

Finally, in the two last letters from Buffett and Munger, in which they review the future prospects of Berkshire there is some language that will no doubt stir again the rumours of whether Buffett may step down as CEO and / or chairman anytime soon. We will see.

For nostalgic investors, in this year’s annual report it is embedded Berkshire’s 1964 annual report (pages 130-142).

See the review I made of 2009, 2012 and 2013 letters.

2 Comments

Filed under Books, Investing

Boeing 787 recurring costs vs. recurring income

Few days ago I was discussing with some commenters on the blog of aviation analyst Scott Hamilton (Leeham News and Comment) about the recurring costs Boeing may be experiencing in the 787 program at the moment.

I used in the discussion the analysis I had made of the learning curve Boeing has experienced in the last 2 years according to cost reductions reported by its CFO, Greg Smith. See a post I wrote about it here. The result I reached is that lately they achieved a 87%. With information disclosed last year, the figure I arrived for 2013 was ~84%, see the post here. However, in the calculation to obtain the learning curve experience the actual costs are not needed, it is sufficient to know cost reductions achieved (reported) between given units.

However, when in 2011 I wrote a series of posts (1) about Boeing 787 break even, I did try to estimate what the cost of the first production units were using published information at the time. At that time it was disclosed that Boeing had about 18bn$ of work in process (WIP) and a number of aircraft in different stages of production. Reported average costs ranged from 250m$ to 400m$. I made some simple assumptions and arrived at an average cost of 310m$ for the first ~60 units.

The next step is to accommodate those average costs into a learning curve profile. The steeper the curve (75%) the more expensive the first unit would have been. Since in 2013 the calculated curve was a 84%, I obtain that the first must have been around 650m$ (2). From then on, I apply the mentioned 84% through end 2013. Then I switch to a 87% curve (slower learning) following the reported figures from Greg Smith.

This discussion so far gives an idea of how to estimate the recurring costs. At the end of 2014 this figure is estimated around 180m$.

In order to know by when Boeing will turn the production of 787s into something profitable, we first need to know by when the recurring costs will be lower than the recurring income. The latter is estimated from the information about prices (published by Boeing here) and discounts applied (estimated in other blog posts, see the last update for 2014).

Boeing list price for the 787-8 in 2014 was 218.3M$.

These list prices are, however, increased almost on a yearly basis by Boeing. Sometimes very steeply (+11.4% in 2010, from 2008) and other times more moderately (+2.4% in 2013 vs. 2012). Going into the future I assumed this increase to be constant and about equal to 2014′ increase, 3%.

On the other hand, Boeing applies some discounts to its customers. These are never disclosed. Some are reported by some sources. What I do is to try to estimate an average discount from reported information. See a detailed calculation here. The latest figure that I arrived at was about 47%. Going into the future I assumed this discount to remain constant. You can see here the recent evolution of discounted 787-8 prices.

With all these ingredients, the only thing left is to plot together the recurring costs and recurring income:

787 recurring cost vs. recurring income evolution.

787 recurring cost vs. recurring income evolution.

As you can see recurring costs may be lower than recurring income at the end of 2019.

This will truly depend on the learning curve achieved, the number of units produced (3) and the pricing power Boeing manages to have. If the learning is steeper, the date will be sooner. If the ramp up is higher, the date will be sooner. If the discounts are lower or the list prices increased more, the date will be sooner. In any other case, either 2019 or beyond.

(1) See the complete series here: “Will Boeing 787 ever break-even?“, “More on Boeing 787 break even” and “787 Break Even for Dummies“.

(2) We will never know that figure. I wonder whether this is even known or registered (if not deleted and forgotten) within Boeing.

(3) For the numbers of units built I based the model in reported information that the ramp up to 12 aircraft per month is expected for 2016. I assumed that in 2015 they are at somewhere between 10 and 12 aircraft per month.

Leave a comment

Filed under Aerospace & Defence

Boeing list prices increases vs. discounts increases (update for 2014)

In a previous post I updated the estimate of what is the average discount Boeing applies when selling its commercial airplanes using 2014 data of list prices, deliveries and reported revenues. The figure I came up with was a 47% discount. I included the following graphic showing the discount evolution:

Boeing Average Discount Evolution, through 2014.

Boeing Average Discount Evolution, through 2014.

Last year, seeing the increasing trend of average discount together with knowing the fact that Boeing regularly increases list prices triggered the following question: Have Boeing airplane discounted prices increased, decreased or stayed constant in the recent years? I set out to answer this question using the estimated average discount of each year (1) from the graphic above.

The Boeing list prices (LP) (2) can be found here. I have been recording those prices for years and thus have a table with the evolution of list prices for each model year by year. The following step is to apply the average discount estimated for each year to then-year list prices, to get the estimated discounted prices (EDP) (2) per model. Thus, a table can be built for the last 6 years.

You can find below the result for the best-selling aircraft during previous years: 737-800, 737-900ER, 777-300ER and 787-8. Together these 4 models amounted to over 640 deliveries in 2014 or 89% of the total 723 airplanes Boeing delivered in 2014.

Boeing List and discount Prices evolution table, 2008-2014.

Boeing List and discount Prices evolution table, 2008-2014.

In the table above I included in black figures what have been Boeing list prices of these models in the past years (as reported in their website) while I marked in blue the figures which are estimated, using as a departure point the calculated averages discounts per year (also included in blue in the table). I included as well the list prices year-on-year change as a % of the previous year list prices, per model.

The average list price increase included at the bottom line is computed with the information of all Boeing models (19 in 2008 and 20 in 2014, though different ones (e.g. last year addition of 777-8X and 777-9X), a total of 26 different models along this period), not only the 4 included in this table.

You may see in the table above that after not increasing prices in 2009, Boeing has steadily increased them in 2010 (6.3%), 2011 (4.7%), 2012 (6.7%), 2013 (1.9%) and 2014 (3.1%). However, if you take a look at the blue figures in the same table you will notice that prices of 2014 are between 2010 and 2011 price levels for all 4 models! That is, the widely announced yearly list prices increase has been yearly offset by a discreet (not-announced) increase in the discounts applied to the sales of airplanes. Thus, the pricing power of Boeing has remained barely constant during the last 5 years. You may see it better in the graphic below:

Boeing List & discount Prices evolution graphic vs. inflation in USA (through 2014).

Boeing List & discount Prices evolution graphic vs. inflation in USA (through 2014).

The graphic shows the price evolution for each of the 4 airplane models selected, taking as a reference their list and estimated discounted prices in 2008 (indicated as 100%) and also the evolution of inflation in the USA (3) in purple, to reflect the evolution of real prices (i.e. accounting for inflation). List prices are shown with straight lines, versus dashed lines used for estimated prices. Each pair of prices for each aircraft is presented in the same color for easier identification. Some comments to the graphic:

  • Through continuous increases, 2014 list prices were between 21% (737 and 777) and 31% (for the 787) higher than in 2008.
  • However, due to increasing discounts from 38% in 2008 to 47% in 2014, the increase in list prices is almost entirely offset (especially for 737 and 777, just 4% above 2008 levels).
  • 2014 discounted prices are below 2011 discounted prices for all models except 787.
  • If compare the evolution of prices vs. the US inflation (general prices in 2014 being 10% higher than in 2008), we see that:
    • Boeing actually lost pricing power in both the 737 and 777, which are cheaper in real (inflation-adjusted) discounted terms in 2014 than they were in 2008 (about 6% cheaper).
    • Only the 787 has been able to keep up the pace of discount escalation and inflation.

(1) There is no way to know the real price and discount that Boeing applies in each sale, as it will depend from customer to customer (American Airlines -AMR- or Fedex) and from model to model (737-800 or 787-8). There where competition is tougher, discounts will be higher. However, the estimates I have made are an average of all Boeing aircraft sold in a given year.

(2) Both list prices (LP) and estimated discounted prices (EDP) are expressed in then-year dollars.

(3) US inflation series since 2008: -0.4% (2009), 1.6% (2010), 3.2% (2011), 2.1% (2012), 1.5% (2013) and 1.6% (2014).

1 Comment

Filed under Aerospace & Defence

Boeing discounts detailed calculation, 2014 vs. 2013

Last years I have published in the blog  some posts (1) dedicated to show what was my estimate of the average discount Boeing applies to its commercial airplanes. I included in those posts the rationale used for the calculation. Find here the post related to the calculation of the discount based on 2014 data of Boeing Commercial Airplanes revenues, deliveries and list prices.

In 2014, I included in another post a simplified table (2) with the calculation comparing 2013 simplified result versus 2012. In this post I wanted to update that table with 2014 figures in comparison to those of 2013:

Boeing discount detailed simplified calculation: 2014 vs. 2013.

Boeing discount detailed simplified calculation: 2014 vs. 2013.

In the table above, you may find for both 2014 and 2013 Boeing reported deliveries per model and Boeing published list prices per model (3) and Boeing Commercial Airplanes reported revenues.

What is then estimated? Boeing Commercial Airplanes services revenues (these are deduced from financial reports reported information), Boeing Commercial Airplanes platforms revenues (derived from the previous figure) and the average discount; this is calculated from the difference between estimated BCA platforms revenues and what should have been that figure had the airplanes been sold at list prices.

Results: average discounts of 46.3% in 2014 and above 46.2% in 2013, though nearly the same.

(1) Find here what is becoming a “body of knowledge” on Boeing discounts: estimates calculated for 20142013201220112010 and 2009; a review of the French portal Challenges.fr of aircraft discounts prior to Le Bourget airshow of 2013; aBombardier’s CEO statement on what is known in the market as the Boeing discount; Boeing Commercial Airplanes president Ray Conner speaking about the more aggressive pricing they are being forced to offer.

(2) I refer to this table as “simplified” as it excludes from the calculation the potential influence on yearly revenues (note, not cash flow) of down payments linked to orders received in then-year versus orders received in previous years for aircraft delivered in then-year.

(3) Two assumptions are needed: 737-800A transfer prices from BCA to Boeing Defense Space & Security for the P-8 (for simplicity assumed to be the same as the 737-800 price) and for the 737-based business jets (for simplicity assumed to be the same as the 737-900ER).

Leave a comment

Filed under Aerospace & Defence

Buenos días, Sevilla!

At the time this post is being published, two friends (Juan and Jose), my brother and I are about to start the Marathon of Sevilla.

To prepare this marathon I followed the same 16-week long training plan I used for the previous two marathons (Rotterdam and New York). However, the 1st day of the plan was on November 3rd, just the day after we completed New York marathon. Thus, I took a week of full rest and another 3 of almost no running, and I started following the plan at full throttle only from week 5, beginning of December.

From December till February 15th (when writing this post) I have completed over 616km (650km including those few in November) in 11 weeks, or about 56km per week. I have completed about 20 sessions of series training, I ran 9 long runs over 17km (6 of them over 27km, 2 over 33km), I did not take part in any race but during training sessions I managed to clock my 5th best time over 10km and my 2nd best time over 21.1km (half marathon). I am close to the fastest shape that I have been in the last year, and have no doubt followed the best training season so far.

Weekly mileage completed along the training plan for Sevilla.

Weekly mileage completed along the training plan for Sevilla.

In between, I switched training shoes, so I will run with shoes with less than 150km though more or less used to the shape of my feet.

Back to the race. We will cover the 42.195km by running all around Sevilla. This marathon will be somewhat special to us since it will be the first one we will be running together all of us in Spain. It will also be special as both my brother and I lived for a year in Sevilla while studying and working (not simultaneously though).

It will start in Isla de la Cartuja (where we studied at EOI) to go South towards Triana and Los Remedios. At km. 4 will turn left to take Av Republica Argentina just 4 blocks where our cousin lives. We’ll cross the river and turn left to go along the river for about 8km, passing Torre del Oro, La Maestranza (bullfighting arena), Av Torneo all the way to the Puente del Alamillo (we’ll be passing the cinemas we used to go, places where friends used to live, etc). At km. 14 we’ll pass by La Macarena, where Jaime used to live. Shortly after we’ll take Luis Montoto heading towards the hotel we normally stay when on business, where more friends used to live, etc. Then we’ll take Kansas City avenue to the North for another 2km. Shortly afterwards we’ll cross the half marathon mark.

PlanoDetalleRecorrido_v2The next 7 km will cover parts of the city I don’t know that well, therefore it will be perfect time to focus on the pace, drinking and eating. At km. 28 we’ll take Luis de Morales street, where I use to train when on business in Seville. At km. 32 we’ll pass by the football stadium of Betis and then take the Paseo de la Palmera for 2km until Parque de Maria Luisa and Plaza de España, two of the most beautiful spots of the city (which I also go by when training in Sevilla).

From then on, the last 6km I guess that are going to be overwhelming: the race will go through the very centre of the city (the University, the Cathedral (La Giralda), the city hall, Av Constitucion, Tetuan, Trajano, Alameda de Hercules), by then it will be about noon and more people will be on the streets cheering the runners. Hopefully, by then, we’ll still be in good shape, fighting for the objective and enjoying the experience.

This tour through the centre will end at the Puente de la Barqueta to cross the river and cover the last 2km in Cartuja before reaching the Olympic stadium where world athletics championship of 1999 took place.

And what will be my objective? Since I mentioned that I arrive at this race with the best training so far (as does my brother), we’ll depart trying to stay with the pacer of 3h30′ all along the way and thus clocking a time under that mark, which for me (and possible for Jaime) would be a personal best. The race is quite flat and if the day does not turn out too hot, the conditions should help us to achieve that goal.

To support us along the race we’ll count with the direct families (Inma, Luca, Andrea), extended family, friends that come from Madrid explicitly to cheer us (Elena, Maicol) and possibly some others we may see along the race.

To end this pre-race post I leave you with the traditional picture by Jaime:

2 Comments

Filed under Sports