Category Archives: Twitter & Media

Bill and Melinda Gates 2014 Stanford commencement speech

Steve Jobs’ Stanford’s 2005 commencement speech in which he talked how he pursued different things that interested him at a young age and later on these things enabled him achieve successful endeavours (connecting the dots). In that same speech he invited graduates to live their life not somebody else’s as the time we all have is limited.

Yesterday, Bill and Melinda Gates gave the 123rd Stanford commencement speech for the class of 2014 [~25′ from 1h04′].

Gates fortune and world fame is due to his founding of Microsoft and its subsequent success. Nevertheless, both Bill and Melinda were introduced to the audience and spoke mainly in relation to their experience as philanthropists.

My main takeaways from the speech:

  • What they appreciate most of Stanford: ingenuity, innovation, etc., but above all optimism.
  • Their quest to understanding what keeps people poor and how innovation could still solve most of the toughest problems.
  • The experiences they shared of meeting the poor and sick in Soweto (South Africa) and India.
  • “If you want to do the most, you have to see the worst”, Melinda Gates.
  • The great stigma suffered by disfavored women.
  • “We can help people if don’t lose hope… and if we don’t look away”, Melinda Gates.
  • The need for empathy to channel our optimism and innovation to solve the problems that affect millions of people.
  • The reference to luck as a main ingredient of the success we may have in life. Luck partly understood as what Warren Buffett refers to as the “ovarian lottery”. Acknowledging that we have been this lucky, the next step is to have empathy for those who were not as lucky. “That could be me”.

***

Last year, during our trip to the US West coast we spent a morning visiting Stanford University. Few months before I had completed 3 online courses from Stanford’s VentureLab platform and I wanted to visit the place.

I was very satisfied with what we saw during our visit: a campus in which any student would have loved to study. Plenty of parks, gardens, bikes, benches. Buildings, classes and labs open for anyone to come and see. Fully equipped classes with reduced groups of students. Open cafeterias with informal places to work. A huge library with study rooms and the flavour of an old place. An impressive book shop where we surely purchased some books… No need to enter into the excellence of the faculty, measured by Stanford in the number of Nobel prizes, Pulitzer prizes, National Medal of Sciences recipients, etc.

No wonder why the Gates proffer that admiration to Stanford and no wonder why students from it have that optimism.

This slideshow requires JavaScript.

Leave a comment

Filed under Education, Twitter & Media

El Clásico: en streaming y de forma legal

Quería compartir en esta entrada como estoy viendo hoy El Clásico entre Real Madrid y Barcelona.

Estamos pasando unos días en París, y dada la hora del partido no me apetecía acercarme a un bar para verlo. ¿Solución? Verlo por streaming en el ordenador desde la habitación del hotel y de forma legal.

Desde hace un par de años estoy suscrito a beIN Sports, la cadena que tiene comprados los derechos televisivos del fútbol español en Francia. La suscripción a beIN Sports la gestioné en su día desde Free, el operador de telefonía e internet, a través del cual también recibo la televisión por cable.

Pues bien, beIN Sports me permite ver sus canales desde cualquier punto por internet (1). Disponibilidad. Esa es una de las claves si se quiere acabar con la piratería, como señalan en las siguientes entradas Jefotecs, “Receta contra la piratería: disponibilidad y precios razonables”, y Enrique Dans, “Una cuestión de disponibilidad y precio” (podría enlazar muchas otras entradas de ambos blogs u otros).

Mucho debe aprender la infame industria de contenidos en España.

El Clásico en beIN Sports.

El Clásico en beIN Sports.

(1) Por no hablar de la posibilidad de ver repeticiones por internet en cualquier momento, de la fracción de banda ancha que reserva Free para que sus usuarios podamos conectarnos por WiFi desde cualquier punto donde haya señal de Free, etc .

Leave a comment

Filed under Twitter & Media

Penosa encuesta de Metroscopia

Me encuentro hoy en El País con la siguiente encuesta “Autoubicación ideológica de los electores”:

Fuente: Metroscopia para El Pais,

Fuente: Metroscopia para El Pais,

Dicha encuesta va acompañada de un artículo (“¿Hay espacio más allá?”) firmado por Jose Pablo Ferrándiz, sociólogo y vicepresidente de Metroscopia. Y por lo que parece, mal profesional.

Viendo la encuesta me llama la atención que indiquen que hay 342.967 electores de extrema derecha (10), los mismos que prácticamente extrema izquierda (1) o derecha (9). Miro en detalle los números y veo que han preguntado exactamente a 100 personas.

La encuesta indica que la población de electores es de algo más de 34 millones de personas. Me llama la atención lo pequeño de la muestra, y me pregunto por la confianza de la muestra que han tomado, y así que se lo pregunto

Como no espero respuesta, decido hacer los números.

[Por cierto, cuando digo arriba “mal profesional”, en parte lo digo porque ya es poco profesional no adjuntar los datos de la muestra: número de encuestados, nivel de confianza e intervalo de confianza… pero veremos que no los incluye por algo]

Usando un simple calculador podéis ver que para un nivel de confianza típico de entre 95% y 99% con una población de más de 34 millones de electores, el hecho de haber cogido una muestra de solo 100 personas hace que el intervalo de confianza esté entre + / – 10-13%.

Es decir, lo que Jose Pablo no nos dice es “un 10% de los electores se ubica en el centro derecha (6) con un intervalo de confianza de más o menos 10%, podrían ser 0% o 20%, vaya usted a saber. Esa es la frase que echo en falta en su artículo donde llega hasta el punto de desgranar como se califica un 2% o 6% de la población (más menos 10%...)

El último detalle que me ha encantado es la nota del final: “* La diferencia hasta 100% corresponde a no sabe y a no contesta”. Lo gracioso es que las cifras de porcentajes que han dado sí que suman 100%, y por tanto la nota final sobra. Todo el mundo ha contestado y el único que no sabe aquí es Jose Pablo.

¿A quién debemos poner en solfa? ¿A El País? ¿A Metroscopia? ¿A su vicepresidente Jose Pablo Ferrándiz? ¿Al becario? ¿…?

NOTA: Al final dudo de si con los 100 encuestados se han limitado a preguntar a “electores” y aleatoriamente. Capaces de haber preguntado a menores de edad, extranjeros, y solo a familiares y amigos…

1 Comment

Filed under Miscellanea, Twitter & Media

Rebajas: descuentos de hasta -214%!

Como todos los años, tras las fiestas navideñas, llegará el periodo de las rebajas. Unos y otros iremos a alguna tienda buscando si determinado artículo que necesitamos ha sido rebajado, si encontramos alguna ganga… con un poco de suerte encontraremos descuentos de hasta un 50% o superiores.

¿Qué significa que un artículo ha sido rebajado en un 50%? Pensemos en un artículo, un par de zapatos cuyo precio inicial fuesen 100€. Si el precio final, en rebajas, es de 50€ diremos que ha sido rebajado un 50% porque la diferencia entre el precio inicial (100€) y el precio final (50€) es de 50€, y esa cantidad supone un 50% del precio inicial.

¿Y si los zapatos se vendiesen por 10€? Para ver cuál es el descuento aplicado hay de nuevo que ver la diferencia entre el precio inicial (100€) y el precio final (10€), que sería 90€. Esos 90€ suponen un 90% del precio inicial, por tanto el descuento en ese caso sería de un 90%.

¿Cuál sería el máximo descuento posible? Dentro de la lógica del mercado (1) el máximo descuento sería que el vendedor ofreciese gratis los zapatos (precio final de 0€), y por tanto el descuento sería de 100%.

Hasta aquí todo parece trivial. Nos encontramos cómodos hablando de porcentajes referidos a precios. Veamos el siguiente ejemplo.

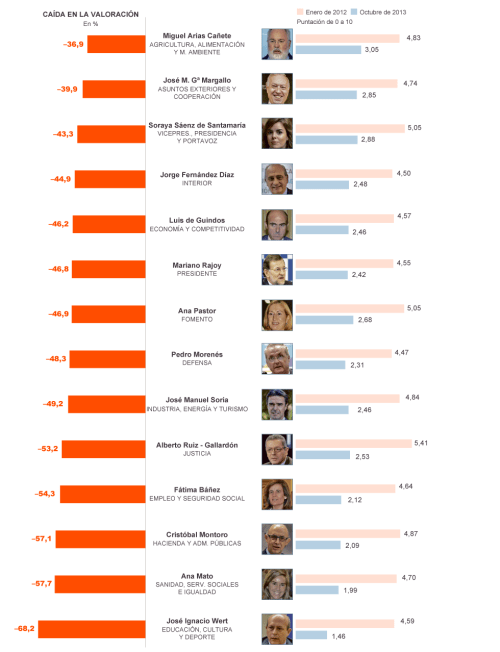
El domingo 30 de diciembre El País publicaba un artículo sobre la caída de valoración de los ministros del gobierno según una encuesta del CIS (Centro de Investigaciones Sociológicas). Podéis ver el gráfico que aparecía en la edición impresa:

Caída de valoración de los ministros (fuente El País). [ver las cifras de caída bajo las columnas rojas]

Caída de valoración de los ministros (fuente El País). [ver las cifras de porcentajes de caída bajo las columnas rojas]

Se puede ver en la gráfica que hasta 5 ministros tienen asignada una caída en la valoración superior al 100%. El ministro Wert se lleva la peor parte con un supuesto -214,4%.

¿Es esto posible? Si los encuestados deben puntuar de 0 a 10 a los ministros,  ¿cuál es la máxima caída posible?

Veamos el caso de Wert, procediendo igual que en el caso de los precios y descuentos (donde parece que sí nos sentíamos seguros).

  1. Su puntuación inicial era 4,59, su puntuación final es 1,46.
  2. La diferencia entre ambas. 4,59 – 1, 46 = 3,13.
  3. La caída de valoración en términos porcentuales: 3,13 entre 4,59: 68.2%.
  4. Si la valoración final hubiese sido “0”; la diferencia habría sido 4,59, y la caída un 100%, nunca más de ese 100%. (2)

Este error, tras haber visto los ejemplos con los descuentos en los precios, nos puede parecer de bulto. Y, sin embargo, ni el periodista, ni su redactor, fueron capaces de caer en él antes de que saliese la edición impresa. Al verlo en la edición digital algunos lectores (incluido yo) informaron al periódico y se rectificó en la edición digital, aunque el periodista que firma la noticia (Francesco Manetto) no termina de reconocer que el error fuese suyo…:

Debajo podéis ver la tabla corregida en la edición digital:

Caíde de valoración de los ministros. Versión online corregida.

Caída de valoración de los ministros. Versión online corregida.

Hace semanas escribía un post sobre el informe de PISA 2012. En ese post hacía la siguiente reflexión:

Siempre me ha llamado la atención la cantidad de periodistas, tertulianos y adultos en general que se apresuran a criticar el bajo nivel de la educación que reciben los alumnos hoy en día. Viendo los resultados del informe PISA, parecen tener razón. Quería incluir aquí esta pregunta, porque estoy razonablemente seguro de que no más de un 8% de esos periodistas, tertulianos y adultos en general serían capaces de responder a esta pregunta correctamente. Aún así, viven en la creencia de que ellos sí recibieron una educación de calidad (ni que hablar de que la superaron satisfactoriamente).

Estos periodistas que hacen estos cálculos de porcentajes que se publican en la edición del domingo (la de más tirada) de El País en el informe de PISA no pasarían del nivel 1 o 2 (de 6 niveles).

(1) Aunque no quede dentro de la lógica del mercado, sí se puede hacer el ejercicio conceptual de ver qué supondría un descuento de 214%. Usando el mismo ejemplo de los zapatos con precio inicial de 100€, deberíamos ver a qué precio final corresponde una diferencia de 214%, es decir de 214€. Restando esos 214€ a los 100€ llegamos a -114€, que equivaldría a una situación en la que el vendedor le daría al comprador 114€ cuando se llevase los zapatos (gratis). [en el caso de los zapatos no parece dentro de la lógica del mercado, pero se pueden pensar en casos de final de vida de un producto donde para deshacerse de un producto haya que pagar]

(2) En este caso, la imposibilidad de una caída superior al 100% viene de la forma de valorar a los ministros, de 0 a 10. Si el CIS diese total libertad a los encuestados (3) a la hora de valorar a los ministros sí se podría dar una caída del 214,4%. ¿Cuál sería en ese caso la valoración final del ministro? -5,25 (negativa).

(3) Esto me recuerda una ocasión donde en un centro comercial me pidieron valorar un producto de 1 a 5, y mi respuesta fue “pi”.

Leave a comment

Filed under Twitter & Media

Advertising in this blog

I started this blog in February 2010 as theblogbyjavier.wordpress.com . Sometime later I purchased an upgrade from WordPress acquiring the domain theblogbyjavier.com (initially for 25 $ per year, a bit expensive, though comfortable), that is why you don’t see the wordpress even if the blog is hosted in WordPress.com .

Among the conditions of WordPress to provide free hosting is that no advertising shall be included in the blog. However, you might have seen some advertisements at the bottom of the posts along these years. “How can that be?” When WordPress mentions no advertising, that means no ads included by the blogger (i.e. me), but WordPress has been indeed including ads from time to time. This is made if the blogger is not purchasing the option “No Ads“, for 30$ per year. I did not purchase it.

Some weeks ago I received an inquiry from a British advertising agency asking whether I would be interested in selling some advertising space. I knew it was against WordPress conditions and this blog is not aimed at being a profitable operation, thus I would not accept the offer. Nevertheless, I exchanged a couple of emails with the agent to know more about the proposal.

The offer consisted of including a link behind a word in one of my blog posts (a single word in a single post). The link would direct the reader to the advertised company. This is what they call unobtrusive advertising (it is funny that at the same time, a Spanish leading blogger, Enrique Dans, also wrote a post criticizing this kind of advertising practices in ¿En pleno 2012 y aún con estas tonterías? – in Spanish).

The proposal for that single link exceeded 100 $. This surprised me. I had previously researched how much one could expect to earn via Google AdSense depending on the traffic of a website, and the order of magnitude for a blog with the traffic of this one was below 100 $ per year.

Once I had left the offer aside, I took a look again about advertising possibilities within WordPress conditions, and I found out about a new program: WordAds.

This beta program had been running for over a year. Bloggers could apply for it and they would be accepted into it if the blog met some conditions. I applied. Few days later I got the confirmation that theblogbyjavier.com was accepted into the program as I announced it in Twitter:

The reader, you, will find some ads at the end of some posts. The same that happened beforehand, as I had not purchased the “No Ads” option. The only difference: now, I will earn some cash out of them. I don’t expect (nor intend) that sum to be big, but it will hopefully pay for the 26$ a year that the domain costs now. I will further comment when I start to see revenues.

8 Comments

Filed under Marketing, Twitter & Media

The Cosmonaut: date of release and update

I became an investor (for 100€) and producer (by buying a T-shirt) of the movie “El Cosmonauta (“The Cosmonaut”) about a year ago. I wrote then a post (in Spanish) about it as I had done when I first learnt about the movie in a TEDx conference two years ago.

Last week a received an update of the project via email. The team confirmed that the movie will be released in April 2013 and what it’s more important, it showed the update of “The Plan [PDF, 3.9 MB, in Spanish], a revision of the budget and the cash-flows to date. The Plan is 50-page document where the team explains the strategy for the product, which in this case is not just a movie.

My brother uses to remind me “it will only be success if the movie is good, no matter how fancy or novel the project behind is”. It might be true. But the project behind is indeed fancy and novel.

Reading the update of The Plan, one can see the variety of activities that have gone and go with the movie, the breadth of contents, formats, etc., to name a few:

  • The use of crowdfunding: to raise up to nearly 400k€ from over 4,500 investors (equity, almost 500 of them) and producers (buyers of merchandising prior to movie release).
  • Creation of a community: having organized several meet-ups and parties with investors. Planning to organize a big event with them for the release of the movie.
  • The use of Creative Commons: releasing the movie free for the viewer under Creative Commons licence.
  • One single release of the movie: which will be available at the same time in cinemas, TVs, free online, DVD…
  • Awareness: having appeared in dozens of media, hundreds of blogs and several festivals.
  • Case of study: in universities, business schools, subject of PhDs…
  • Prizes: having won several prizes for its innovation, entrepreneurial side, etc.
  • 4 classes of content: free to use, creative commons, under subscription, branded.
  • Webisodes: the movie will be accompanied by 37 short episodes showing secondary pieces, which will not be part of the main movie.
  • Documentaries: about the process of filming the movie from the perspective of a hummingbird and a crude making off.
  • Facebook profiles of the movie characters which will interact with fans at the time of the movie release.
  • Poetry book about cosmonauts.
  • Educational materials: developed for cinema schools and students.
  • Workbook manual of cinema.

If you want to know more, take a look at The Plan :-).

The project is really fresh and captivating, I wish the movie matches it. I leave you for now with the trailer of the movie:

Leave a comment

Filed under Investing, Twitter & Media

De profesión, periodisto: Sandro Pozzi

Hace meses escribí sobre como algunos periodistas no se enteran de las cifras que manejan. En aquella ocasión, el periodista simplemente copiaba mal una cifra, equivocándose en órdenes de magnitud y terminando por dar a entender que Bin Laden se encontraba en un región del tamaño… de un campo de fútbol.

Hoy leo una entrevista al premio Nobel de Economía de 2001 Joseph Stiglitz. A mitad de la entrevista, el periodista habla del último censo en Estados Unidos:

“LOS DADOS DEL ÚLTIMO CENSO de población en EE UU revelan que 150 millones de personas son pobres o tienen una renta por debajo de la media. Eso equivale a casi uno de cada dos habitantes.”

¿Nos toma a los lectores por tontos o el tonto es él? Si Estados Unidos tiene unos 311 millones de habitantes, ¿es escandaloso que 150, prácticamente la mitad, tengan una renta por debajo de la media? ¿Es noticia? Claro, la otra mitad, otros 150 millones (o alguno más) tienen una renta por encima de la media… Si quiere hablar de desigualdades alarmantes, me temo que tendría que haber acudido a otra cifra.

A continuación miro a ver quien firma la entrevista: Sandro Pozzi, el mismo periodisto que hace unos días firmaba otro artículo en El País sobre las conversaciones entre EADS y BAE Systems, eso sí conservando el error original de otros artículos de prensa americana (e.g. Bloomberg) diciendo que DASA compró Construcciones Aeronáuticas (CASA) en 1999.

Imagino que por lo menos habla buen inglés.

4 Comments

Filed under Twitter & Media

On why blog posts are read

Yesterday I wrote a post about the curiosity of seeing which blog posts are read more at different points in time. I pinpointed the case of a blog post related to taxes in France and Spain. I guessed that, referrals from the blog itself aside, this was due to the economic situation in Spain.

Now take the other top posts at the moment (prior to these last 2 posts were published):

Current Top Posts as of July 7th 2012.

Leave a comment

Filed under Twitter & Media

Brain drain or bank run?

A curiosity that comes with having a blog is that sometimes certain post starts to be read more and more and you keep wondering why. One plausible reason is clear and self-fulfilling: since the most read posts in the last few days appear at the right of the blog, readers may opt to read one of those after having read the post that brought them to the blog.

One of those post that it’s being read more and more recently is a comparison I made about income tax rates between Spain and France. I wrote it because I had some work colleagues who asked me about that, and instead of writing always the same answer I could refer them to the blog post.

See the stats below:

Stats of the post related to France income taxes.

In this particular case, and since the post it’s written and titled in Spanish, I decided to check the stats with the dates of the announcements of the bail outs of Bankia and Spain.

Another thought I have is: since the title is relatively vague “Taxes in Spain and France” (it does not mention “income” even if it only refers to income taxes), this keeps me wondering whether people arriving at this post are tempted to emigrate from Spain or to relocate their savings… brain drain or bank run? Sigh (as in lament).

To have a better view on that, and taking into account that my blog is not a special reference nor its low readership is representative of Spain, we could simply check with Google Trends. I started to look for it, but Google’s answer was “Your terms […] do not have enough search volume to show graphs”. Sigh (as in relief).

2 Comments

Filed under Economy, Twitter & Media

Where do you come from?

WordPress introduced a feature showing the geographical origin of the visits to the blog back in February (find below a map offered by WordPress – the host service of this blog). After 3 months, I decided to take a look at those stats.

Readers’ origin map provided by WordPress.

In these three months the blog received slightly above 7,700 visits; over 2,000 came from the United States and above 1,300 came from Spain (my country of origin). The top ten countries of origin summed up 75% of the visits (USA, Spain, UK, France, Germany, Canada, NL, Australia, Ireland & India). Following the famous “80/20 rule” or a Pareto distribution, the top 20% of the countries of origin summed up 85% of the visits (out of 117 countries).

Pareto distribution of blog readers per country of origin.

Finally, I had the curiosity to analyze the origin by world region. For this purpose, I compared the proportion of readers to the proportion of world population, internet users and internet penetration per region (internet users/population).

Blog readers, world population, internet users and internet penetration.

Europe, mainly due to Spain (my family and most of friends’ origin), is overrepresented (higher % of readers in relation to internet users). The other two regions overrepresented among readership are North America and Oceania, this must be due to the fact that most of the blog’s articles are written in English. Those three regions are also the ones where internet penetration is the highest.

China. In the last 3 months my blog only received 8 visits from China, that is 0.1% of the visits. China with over 1.3 billion inhabitants represents almost 20% of the world population; it counts with over 500 million internet users, over 22% of  the total; and the internet penetration is above 38%. China is clearly underrepresented among the countries of origin of the readers of the blog (0.5%). Shall I start writing more about China or in chinese language?

Leave a comment

Filed under Twitter & Media