I read in the following article “Airbus seeks to increase Washington State supply business; aims for 13 A350s/mo” (from Leeham News) how from a presentation of a A350 supplier (ElectroImpact) at an aerospace suppliers event in Washington State, it was concluded that the Airbus aimed at building 13 A350s per month, as the mentioned supplier had built its factory with capacity to extend production rates up to those 13 aircraft.
This would be news because in its presentations Airbus talks about a production ramp-up up to 10 a/c per month (as does Boeing for the 787, which 10 aircraft/month should be reached by the end of 2013).
Having analyzed several times Airbus’ Global Market Forecast (GMF) and Boeing’s Current Market Outlook (CMO), I believe that those production rates of above 10 aircraft per month should be expected by industry followers just by seeing the numbers included in those forecasts.
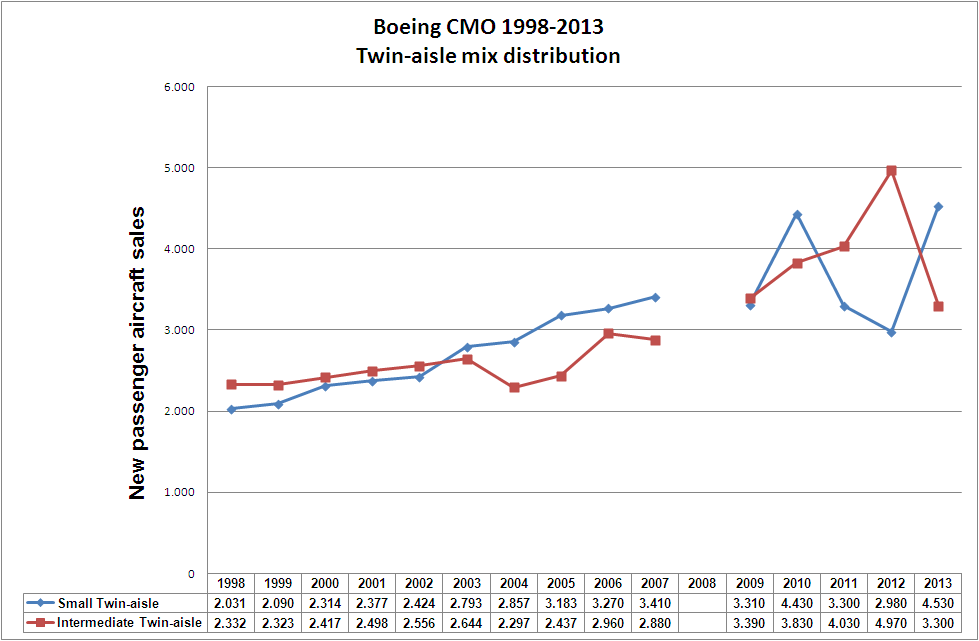
In 2012, the GMF forecasted about 6,500 twin-aisle to be delivered in the next 20 years. The CMO indicated 7,210 aircraft. In 2013, Boeing CMO slightly reduced the figure to 7,130 a/c.

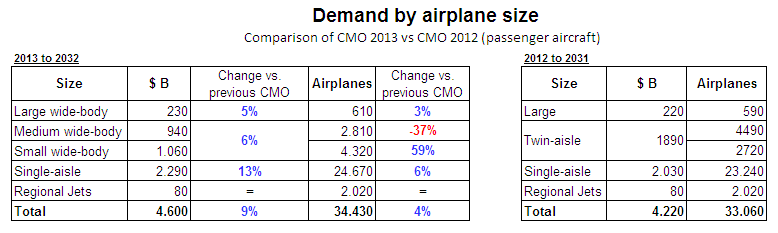
Comparison of Airbus GMF and Boeing CMO 2012-2031.
Thus, both companies expect between 6,500 to 7,200 twin-aisle passenger aircraft to be delivered in the following 20 years (excluding freighters, 747 and A380 – these 2 considered as Very Large Aircraft in the studies).
1st approach. If we were to take the mid-point of both forecasts, about 6,850 a/c, and simply divided by 20 years, we would reach to an average figure of 343 twin-aisle aircraft to be delivered per year between the 2 manufacturers, or 28 a/c per month. If Airbus wanted to maintain the long-term 50% market share, it would have to aim at delivering 14 a/c per month between all its twin-aisle products, which soon will be A330 and A350.
2nd approach. However, current twin-aisle production levels are in no way close to those 343 a/c per year. In 2012 there were 258 deliveries thanks to the introduction of 787s, but in the previous decade the average was about ~165 a/c per year. Thus, manufacturers must have a deliveries’ ramp up to accommodate those 6,850 in the next 20 years. Not knowing what that ramp-up is, I just linearized from where we are today and what is to be delivered.
I plotted in the graphic below all the deliveries of twin-aisle (excluding Very Large Aircraft) from the 1970s to 2012, and then what a forecast could be departing from 2012 deliveries’ figure to accommodate ~6,850 a/c in the next 20 years.
Taking a look at the graphic, one can already understand that if we take the GMF and CMO forecasts as good ones, the manufacturing rhythm will have to accelerate in the following years, especially in the second decade. In the late 2020s, over 400 twin-aisle would have to be delivered per year (over 33 per month), thus manufacturers will have to churn above 16 a/c per month each, that is the double of what they produced during the last decade.

Twin-aisle deliveries: historic series (1970s-2012) and forecast (excludes VLA -A380 & 747).
Market shares. One could wonder whether this growth will favour more one company or the other. I compared market shares (excluding VLA):
- in 2012: Boeing delivered 155 twin-aisle (26 767s, 83 777s, 46 787s) vs. Airbus 103 a/c (101 A330s, 2 A340s)… 60% / 40%.
- in 2003-2012: Boeing delivered 839 twin aisle (148 767s, 642 777s, 49 787s) vs. Airbus 880 a/c (44 A300s, 687 A330s, 149 A340s)… 48% / 51%.
- in 1993-2012: Boeing delivered 1,687 twin aisle (572 767s, 1,066 777s, 49 787s) vs. Airbus 1,521 a/c (175 A300s, 31 A310s, 938 A330s, 377 A340s)… 50% / 45%.
[The shares in the past decades include marginal deliveries from Ilyushin models and McDonnell Douglas models, which share I kept out of Boeing even after the merger in august 1997, these are ~30 a/c to be added to the 1,687]
Seeing that market shares have been fluctuating but always around 40-60% for each company, they could expect to have to at least deliver 40% of those 6,850 a/c in 20 years, or of those above 400 a/c in the late 2020s.
Backlog. Finally, just to see how the twin-aisle mix for each company is going to be, let’s look at the aircraft on order (backlog) that each company has as of today (end June 2013):
- Airbus (43%):
- A330: 260 a/c to be delivered.
- A350: 678 a/c to be delivered.
- Boeing (57%):
- 767: 56 a/c to be delivered.
- 777: 339 a/c to be delivered.
- 787: 864 a/c to be delivered.
Thus, of the 6,850 twin-aisle to be delivered in the next 20 years, about 2,200 are already contracted as of today (plus the above 130 a/c delivered within the first half of 2013), thus 33% of those 6,850 a/c is more or less secured and among those the split is 57 / 43 for Boeing.