Tag Archives: Boeing

My forecast of Boeing Commercial Airplanes 2014 revenues

In the previous years I have been estimating the discounts Boeing applies to its list prices of commercial aircraft. You can see here the result of last year estimate (based on 2013 figures). The results I arrived at are that Boeing has been increasing its discounts in the recent years, and that in 2013 they topped ~47%.

Boeing Average Discount Evolution, 2013.

Boeing Average Discount Evolution, 2013.

With this post I wanted to take a step ahead and put the model to the test by using it for forecasting what will be Boeing Commercial Airplanes revenues for the year 2014.

As of today, January 15th, these have not been announced yet. In Boeing’s investor relations website you can see that the 2014 earnings conference call will take place on January 28th.

How will I reach to my forecast?

  1. See here Boeing (net) orders for the year 2014: 1,432 aircraft among all models.
  2. See here Boeing deliveries in the year 2014: 723 aircraft among all models.
  3. See here Boeing 2014 list prices.
  4. See in the above curve the average discount I will use: 47% (unchanged from past year, this is a hypothesis that will be put to test with how accurate the forecast turns out).
  5. See here [PDF, 841KB] Q3 2014 earnings press release. I use it to see how were faring in 2014 Boeing Commercial Airplanes services, deducing it from the reported Sales of Services, Boeing Capital and Global Services & Support. Up to end September 2014, the services figures were declining in comparison to 2013 figures. I will assume the global figure to follow the same proportional decline; arriving at ~589m$ for Boeing Commercial Airplanes services (remember, this figure will not be actually explicitly reported).

With all these ingredients… my forecast is: 60.2bn$ (1).

In the 2014 Q3 report you can see Boeing’s own guidance for year-end figures:

Boeing's 2014 Financial Outlook at Q3 2014 earnings press release.

Boeing’s 2014 Financial Outlook at Q3 2014 earnings press release.

Some comments:

First, you can see that my forecast (60.2bn$) is a bit more optimistic than Boeing’s own outlook 3 months ago, 57.5-59.5bn$ (2).

Second, in the 2014 Q3 release, you can see the revenues up to end September (below). In them, you can see that up to then, revenues of Boeing Commercial Airplanes had increased 13% in relation to 2013 (12.66% to be more precise). My forecast is a bit more optimistic here as well: at year end the increase in revenues will be +13.6%.

Boeing Commercial Airplanes revenues Q3 2014.

Boeing Commercial Airplanes revenues Q3 2014.

Final comment: if Boeing managed in 2014 to command better prices on delivered aircraft, the figure will be even higher. If the figure is lower than the 60.2, and in line with their forecast, it’ll mean that the market is forcing Boeing to apply ever higher discounts to their published list prices.

I am now looking forward to January 28th and Boeing’s earnings call!

++++++++

Update on February 11th:

As announced, Boeing published on January 28th its full 2014 results [PDF, 838KB]. Which were the Boeing Commercial Airplanes revenues?

Boeing Commercial Airplanes revenues full 2014.

Boeing Commercial Airplanes revenues full 2014.

That is 59.99bn$, or 206m$ short of my detailed forecast of 60.196bn$. This means that I missed with my forecast by a 0.3%, not bad. Even better taking into account that the main discrepancy have been the lower level of services under the commercial airplanes unit.

The result, as my intuition went was above the upper limit of the bracket Boeing gave as guidance for the full year in the 2014 Q3 report, 57.5-59.5bn$ (see note (2)).

(1) To be more precise the forecast from the model is 60,196m$.

(2) If my forecast turns out correct some may be tempted to say that this is the usual trick played by CFOs: to present better figures than expected.

2 Comments

Filed under Aerospace & Defence

Swiftair MD-83 EC-LTV, BEA interim report

Some weeks ago I read the first interim report from the “Bureau d’Enquêtes et d’Analyses” (BEA) on the accident suffered by the Swiftair MD-83 matriculated EC-LTV on July 24th in Mali (find the report here, PDF 5.2MB). The last 1’30” of that flight must have been scary.

Take a look at the records of altitude, attitude, bank angle:

EC-LTV parametres

MD-83 EC-LTV parameters (2014, Mali).

Probably you are familiar with this other graphic that has appeared in the press:

EC-LTV trajectory worked out by BEA from FDR.

EC-LTV trajectory worked out by BEA from FDR.

Today, at lunch while on a training course, I had the chance to discuss about the accident with the course instructor (a retired former Airbus senior vice president in customer services) who pointed me at a similar accident undergone by a MD-82 HK-4374X in Venezuela in August 2005.

I went to the BEA website to check for the report of that other accident (here, PDF 20MB, in Spanish). While the investigation of the EC-LTV will most probably reach to the conclusions of the root causes of the accident, the are many similarities between the cases:

  • Hot weather conditions (ISA+10 or above, that is temperatures not below -30 degrees at FL31),
  • proximity of thunderstorms,
  • use of anti ice (inducing a penalty measured in about 3,000ft penalty for available engine thrust),
  • autopilot engaged in “Speed on Thrust” mode in “Altitude Hold” (making the aircraft pitch upwards when losing speed due to the lack of available power at FL310 due to hot weather and use of anti ice),
  • engine EPR close to maximum values for both engines (followed by a oscillations when the airplane starts to lose speed),
HK-4374X parametres.

MD-82 HK-4374X parameters (2005, Venezuela).

The report of the 2005 accident included a study from NASA and a presentation by Boeing then chief pilot covering similar incidents and showing a 2002 Boeing Flight Operations Bulletin warning flight crews of this kind of situations.

Boeing Flight Operations Bulletin MD-82-02-02A.

Boeing Flight Operations Bulletin MD-82-02-02A.

I’m looking forward for future reports from the BEA to see what are the findings they reach.

1 Comment

Filed under Aerospace & Defence

Airbus vs. Boeing, comparison of market forecasts (2014)

Yesterday, Airbus released the new figures of the 2014-33 Airbus’ Global Market Forecast (GMF, PDF 7.5MB).

In previous years, I have published comparisons of both Airbus’ and Boeing’s forecasts (Current Market Outlook, CMO, PDF 5.3MB). You can find below the update of such comparison with the latest released figures from both companies.

Comparison of Airbus GMF and Boeing CMO 2014-2033.

Comparison of Airbus GMF and Boeing CMO 2014-2033.

Some comments about the comparison:

  • Boeing sees demand for 9% more passenger aircraft (excluding regional a/c) with a 10% more value (excluding freighters). The gap is closing, as in previous years Boeing forecasted up to 14% more aircraft.
  • In relation to last year studies, Airbus has increased demand by ~2,000 aircraft whereas Boeing by ~1,000.
  • Boeing continues to play down A380 niche potential (59% less a/c than Airbus’ GMF). This year, both companies have reduced in about 100 units their forecasted demand for the VLA segment.
  • Both companies’ forecast for the twin aisle segment is nearly identical: 7,260 aircraft. The mix between small and intermediate twins varies, 700 units up and down. However, Boeing’s wide-bodies mix is not to be taken as engraved in stone, see the erratic trend in the last years here.
  • On the other hand, Boeing forecasts about 3,600 single-aisle more than Airbus (the gap has closed in 800 units this year). The largest part of the difference comes in the single-aisles over 175 seats (A321, 737-9).
  • In terms of RPKs (“revenue passenger kilometer”), that is, the number of paying passenger by the distance they are transported, they see a similar future: Airbus forecasts for 2033 ~14.5 RPKs (in trillion) while Boeing forecasts 15.5 RPKs.

The main changes from last year’s forecasts are:

  • Both manufacturers have increased their passenger aircraft forecast, ~2,000 a/c Airbus and 1,000 a/c Boeing,.
  • Both manufacturers have increased the value of RPKs in 2033  (about 5-7%).
  • Both manufacturers have increased the volume (trn$) of the market in these 20 years, about 6.7% Airbus (to 4.4trn$) and 5.7% Boeing (to 4.86trn$) (excluding regionals and freighters).

Some lines to retain from this type of forecasts:

  • Passenger world traffic (RPK) will continue to grow about 4.7% per year (5.0% according to Boeing). This is, doubling every ~15 years.
  • Today there are about 16,855 passenger aircraft around the world (according to Airbus), this number will nearly double in the next 20 years to above 30,555 a/c in 2033 (over 33,000 as seen by Boeing).
  • Most deliveries to go to Asia Pacific, 39% or over 12,200 passenger aircraft
  • Domestic travel in China will be the largest traffic flow in 2033 with over 1,500bn RPK, or 11% of the World’s traffic.
  • Over 12,000 aircraft will be retired to be replaced by more eco-efficient type.
Trips per capita vs. GDP per capita (source: Airbus GMF).

Trips per capita vs. GDP per capita (source: Airbus GMF).

As I do every year, I strongly recommend both documents (GMF and CMO) which provide a wealth of information of market dynamics.

4 Comments

Filed under Aerospace & Defence

Aircraft market forecasts accuracy (update 2014)

About two years ago I wrote a post in which I analyzed the accuracy of commercial aircraft market forecasts. In particular, Boeing’s series of yearly Current Market Outlook (CMO). In that comparison, between the CMOs from 1997 and 2012, we could compare the predicted and the actual world fleets at 2011 year-end. Except for the twin-aisle segment and especially the large aircraft sector, the accuracy was remarkable, as the estimated global fleet only exceeded the actuals in 1%.

In this post, I just wanted to provide an update with the figures from the latest CMO (2014), released a few weeks ago, in comparison with 1999’s CMO. In that CMO from 1999 [PDF, 1.5MB], we find the following chart showing Boeing’s forecasted fleet size and distribution for 2003, 2008, 2013 and 2018 year-ends.

1999 Boeing CMO year-end fleet forecasts for 2003, 2008, 2013 & 2018.

1999 Boeing CMO year-end fleet forecasts for 2003, 2008, 2013 & 2018.

In 2014 CMO, Boeing offered figures of 2013 year-end fleet (1).

Fleet at year end 2013 - Boeing 2014 CMO.

Fleet at year-end 2013 – Boeing 2014 CMO.

And now, the comparison is immediate:

Comparison of aircraft fleet at year-end 2013: 1999 forecast vs. actual (sources: Boeing CMO 1999 and 2014).

Comparison of aircraft fleet at year-end 2013: 1999 forecast vs. actual (sources: Boeing CMO 1999 and 2014).

Some reflections:

  • The forecasts for all segment except for single-aisle (737-800) predicted higher numbers of aircraft in the fleet than the actuals have shown 15 years later (2).
  • The total fleet figure was missed by 11%, a larger deviation than the 1% from two years ago.
  • The 737 has been the model outselling the forecasts, offsetting partially the lower demand in all other segments. In particular, even if deviations per segment have been higher, the global forecasted figure for passenger aircraft has been missed by only 3%.
  • The forecast is especially off mark the twin-aisle, where there are over 1,700 less aircraft in the current fleet than forecasted (3).

For the next such comparison we will need to wait some years, as from the year 2000 Boeing provided CMOs in a different fashion, offering a view of the forecasted fleet only 20 years from the date in question, instead of a view every 5 years. Therefore, we will have to wait until 2017, when we will be able to compare the 20-year forecast from 1997 CMO with the actuals of 2016 to be provided in 2017 CMO.

(1) In order to see the detailed split per segment differentiated between passenger and freighter aircraft, until the released of the full CMO, it is needed to use the exploring data tool offered in Boeing’s site.

(2) The differences in accuracy between the lower and higher end of the small-aisle segment should not be taken into account, as they are influenced by the different consideration of the cut off number of seats between a CMO and the other.

(3) Possibly a reason why Boeing plays down on the 747-8I and A380 segment.

4 Comments

Filed under Aerospace & Defence

Wide-body mix in 16 years of Boeing CMOs

Last year I wrote a post showing the puzzling change in Boeing’s predicted mix of twin-aisle sales, between small and medium wide-bodies (“Wide-body mix in 15 years of Boeing CMOs”). A few days ago I wrote a post about the publishing by Boeing of its Current Market Outlook for 2014-2033. This year’s CMO is more consistent with last years figures, i.e., the larger share of the forecasted market corresponds to small wide-bodies (787s from Boeing perspective). Recall the numbers:

  • small wide-bodies: 4,270 a/c in CMO2014 (passenger aircraft only),
  • medium wide-bodies: 2,990 a/c in CMO2014.

However, the trend is changed again in this year’s CMO in comparison with last year’s one: small wide-bodies market decreases while the medium wide-bodies’ one increases again. Since I keep a collection of CMOs from years back, I will include again a comparison going 16 years back…

Twin-aisle mix distribution (Boeing CMO 1998-2014).

Twin-aisle mix distribution (Boeing CMO 1998-2014).

Seeing at the graphic (made using Boeing figures):

  • During the first 5 years (1998-2003) the trends are quite constant.,
  • From 2003 to 2007, the mix is reverted, possibly to favour the launch of the 787.
  • In 2008 the CMO did not provide the split.
  • From 2009 to 2014, you can see that both trends in the forecasts are erratic… why? Only Boeing knows.

4 Comments

Filed under Aerospace & Defence

Review of Boeing Current Market Outlook 2014

Just ahead of Farnborough air show, Boeing Commercial has published its yearly update of the Current Market Outlook (CMO) for the next 20 years of commercial aircraft market (2014-2033).

I have just compared the figures for passenger aircraft of the last two years’ CMOs:

CMO 2014 vs 2013 comparison.

CMO 2014 vs 2013 comparison.

Some comments to it:

  • You can see that the total number of new aircraft delivered has slightly increased from 34,430 to 35,930, a 4%, which is consistent with the constant 5% traffic increase that Boeing predicts (1).
  • The volume (Bn$) increases by a larger percentage, 8% (360Bn$)… this is due mainly to the increase in:
    • single-aisle aircraft expected sales in volume (12%, +270Bn$) and aircraft (+1,010), and
    • medium wide-body segment with 180 more aircraft (+6%) and an increase in volume of 70Bn$ (+7%).
  • Last year I wrote about a sudden change between CMO 2013 and CMO 2012 of the mix in wide-bodies; CMO 2014 is more consistent with last year’s one even if the trend is reverted again.

This year study’s figures seem to push for the 737 and 777, which is backed by the presentation as well. It is curious how 777 market is increased whereas 787 is slightly decreased.

Find below the nice infographic [PDF, 0.1MB] that the guys from Boeing have put up together:

Boeing Commercial Aviation Market Forecast 2013-2032 infographic.

Boeing Commercial Aviation Market Forecast 2013-2032 infographic.

As always, I recommend going through the CMO, as you can learn a lot about the business: from global numbers, to growth, traffic figures, fleet distributions, forecasts, etc… You may find the presentation [PDF, 10.6 MB] and the file [XLS, 0.7 MB] with all the data.

For a comparison between this CMO and the respective Airbus’ GMF we will have to wait until after the summer, when Airbus publishes its update. Until then, find here the comparison based on 2013 market studies.

(1) These two ratios, 4% fleet growth and 5% traffic growth, point to an implicit increase in the average size of the aircraft in fleet.

(2) Find the review I wrote comparing 2013 CMO with 2012 CMO.

4 Comments

Filed under Aerospace & Defence

Musée de l’Air et de l’Espace (Le Bourget)

The Musée de l’Air et de l’Espace, in Le Bourget (north of Paris), is yet another great aerospace museum. It reminded me very much to the Aviodrome (The Netherlands) in the chronological point of view of the visit and the local aspect to it (1), paying special attention to French aviation pioneers, flying aces, French fighter aircraft, etc. This is possible, as the role France has played in the development of aviation is, no doubt, crucial.

You may see the distribution of the museum and its galleries in the plan below:

Plan of the museum.

Plan of the museum.

I will now list some of the things that in my opinion make this museum unique (I will leave some anecdotes or details to future blog posts), accompanied by the respective pictures.

Model of Alberto Santos Dumont's Demoiselle (1908).

Model of Alberto Santos Dumont’s Demoiselle (1908).

Alberto Santos-Dumont was a Franco-Brazilian aviation pioneer (2) who with his 14-bis, “Oiseau de proie“, on the 23rd of October 1906, in Paris, performed the first officially witnessed unaided takeoff and flight by a heavier-than-air aircraft. In the picture above you can see him aboard another of his early models, a Demoiselle from 1908.

Workshop of the brothers Voisin (L’Atelier des Freres Voisin),

Workshop of the brothers Voisin (L’Atelier des Freres Voisin).

Some of the construction pioneers at the time were the Voisin brothers. The museum has model of how an aircraft construction workshop could look like at the time, “L’Atelier des FrèresVoisin” (this reminded me of the William E. Boeing Red Barn at the Museum of Flight in Seattle, see a post about it here).


Nacelle of a dirigible  Zeppelin LZ 113.

Nacelle of a dirigible Zeppelin LZ 113.

Not everything in aviation are heavier-than-air machines, above you can see the inside of a nacelle of a Zeppelin LZ 113 used in war operations.

Old Le Bourget airport hall ("8 columns hall").

Old Le Bourget airport hall (“8 columns hall”).

Le Bourget was the first civil airport in Paris, opened in 1919. It was in Le Bourget where Charles Lindbergh landed his Spirit of Saint Louis in on the 27th May 1927 when he first crossed the Atlantic Ocean. The museum today occupies part of the old airport. In the picture above you may see the main hall, designed by the architect Georges Labro in a tender made in 1935 the ministry of aviation. The building was inaugurated in 1937 (this hall reminded me of Berlin Tempelhof, you may see a post I wrote about it here).

Models gallery.

Models gallery.

The museum includes an aircraft models gallery. As a collector of models, I liked to spend some time wandering through these models. It also helps to test your own capabilities as a spotter without having to walk or wait a lot.

Inside a C-47 Skytrain Dakota

Inside a C-47 Skytrain Dakota.

In this museum you can get on board a C-47 Skytrain (Dakota being the British designation for the airplane). I believe this was the first time I was inside a DC-3 (an aircraft of which importance to aviation cannot be overstated (3)), as if I remember well, in the Aviodrome you could get inside a DC-2 not -3.

Cut out of a Dassault Mirage F1.

Cut out of a Dassault Mirage F1.

In other museums I had seen cut outs of engines, here in Le Bourget you may see a full size cut out of a Dassault Mirage F1, a wonderful entertainment for engineers and aviation enthusiasts.

747 and Ariane 5

747 and Ariane 5.

In Le Bourget you can see replicas of the Ariane 4 and Ariane 5 (4). That allows you to get a picture of both in the same frame or to get them with a Boeing 747, as pictured above.

Inside of a Boeing 747 cut out.

Inside of a Boeing 747 cut out.

The Boeing 747 is legendary aircraft in itself (5) and the chances of flying in it are decreasing by the year as more airplanes are being retired from service. In Le Bourget, you get the chance to see it really from the inside, as parts of it are really cut out so you can admire its structure, systems, etc.

Concorde: prototype 001 and series airliner.

Concorde: prototype 001 and series airliner.

Some museums around the world have the Concorde as a highlight. In some of them you may get into it. Here in Le Bourget you may get into 2, one of them being the prototype 001, where you can see some flight test installations used for different experiments made with it.

I definitely recommend to visit this museum if you happen to be in Paris. It is located at Le Bourget airport and the entrance is free of charge. A ticket to get into some of the aircraft (747, Concorde, C-47) is sold for 8 euros. I would suggest to take no less than 4 hours to visit the museum.

(1) In the Aviodrome the local focus is put into the figure of Anthony Fokker.

(2) See in this post a review of French aviation pioneers.

(3) See more of the DC-3 in this post that a wrote as a tribute to Douglas Aircraft Company.

(4) So far, I had only seen a replica of the Ariane 5 at the Cité de l’Espace in Toulouse, see here a post I wrote about it.

(5) See here a book review I wrote about “747” by Joe Sutter, the programme chief engineer.

5 Comments

Filed under Aerospace & Defence, France

Boeing real prices (accounting for inflation) after discount

In a previous post I compared for some Boeing airplanes (737-800, 737-900ER, 777-300ER and 787-8) what had been the evolution from 2008 to 2013 of the published list prices against the estimated discounted prices. In that post, I arrived to the following conclusions:

[…] the pricing power of Boeing had remained barely constant during the last 5 years.

  • Through continuous increases, 2013 list prices were between 18% (737 and 777) and 27% (for the 787) higher than in 2008.
  • However, due to increasing discounts from 38% in 2008 to 47% in 2013, the increase in list prices is almost entirely offset.
  • 2013 discounted prices are below 2010 discounted prices for all models.
  • 2013 discounted prices are almost back at 2008 levels for the 737 and 777, only the 787 seems to have stayed at 2010 levels.

I, then, received one interesting comment from a reader, ikkeman, pointing at the fact that if the estimated discounted prices are expressed in then-year dollars (1), if real prices had not increased since 2010, that meant that they had indeed decreased.

See below the graphic I included in the a previous post updated adding the data of US inflation after 2008. [The series is: -0.4% (2009), 1.6% (2010), 3.2% (2011), 2.1% (2012) and 1.5% (2013)]

Boeing List & discount Prices evolution graphic vs. inflation in USA,

Boeing List & discount Prices evolution graphic vs. inflation in USA.

With the information of the inflation (purple line) the following 2 conclusions apply:

  • 787 real price (accounting for inflation) after discount has simply kept up with inflation rate since 2008.
  • 737 and 777 real prices after discounts, however, have lost ground with respect to inflation since 2008. On average they have lost about 8.5% in total or about 1.6% per year.

(1) That is the case as estimated discounted prices have been estimated year by year from the financial reports and list prices of the year, thus, using then-year US dollars.

Leave a comment

Filed under Aerospace & Defence

Boeing discounts detailed calculation, 2013 vs. 2012

Last years I have published in the blog  some posts (1) dedicated to show what was my estimate of the average discount Boeing applies to its commercial airplanes. I included in those posts the rationale used for the calculation. Find here the post related to the calculation of the discount based on 2013 data of Boeing Commercial Airplanes revenues, deliveries and list prices.

In this post, I wanted to show in detail a simplified table (2) with the calculation comparing 2013 simplified result versus 2012:

Boeing discount detailed simplified calculation: 2013 vs. 2012.

Boeing discount detailed simplified calculation: 2013 vs. 2012.

In the table above, you may find for both 2013 and 2012 Boeing reported deliveries per model and Boeing published list prices per model (3) and Boeing Commercial Airplanes reported revenues.

What is then estimated? Boeing Commercial Airplanes services revenues (deduced from financial reports reported information), Boeing Commercial Airplanes platforms revenues (derived from the previous figure) and the average discount; this is calculated from the difference between estimated BCA platforms revenues and what should have been that figure had the airplanes been sold at list prices.

Results: average discounts of above 46% in 2013 and above 45% in 2012.

(1) Find here what is becoming a “body of knowledge” on Boeing discounts: estimates calculated for 2013201220112010 and 2009; a review of the French portal Challenges.fr of aircraft discounts prior to Le Bourget airshow of 2013; aBombardier’s CEO statement on what is known in the market as the Boeing discount; Boeing Commercial Airplanes president Ray Conner speaking about the more aggressive pricing they are being forced to offer.

(2) I refer to this table as “simplified” as it excludes from the calculation the potential influence on yearly revenues (note, not cash flow) of down payments linked to orders received in then-year versus orders received in previous years for aircraft delivered in then-year.

(3) Two assumptions are needed: 737-800A transfer prices from BCA to Boeing Defense Space & Security for the P-8 (for simplicity assumed to be the same as the 737-800 price) and for the 737-based business jets (for simplicity assumed to be the same as the 737-900ER).

1 Comment

Filed under Aerospace & Defence

Learning Curves: Boeing 787 case in 2013

In the previous two posts I introduced the concept of learning curve and provided a case in point (based on figures attributed to A350 FAL by Leeham News). In the first of those posts, I discussed that:

Boeing does not disclose outright what is the actual learning curve it is achieving in its program. Nevertheless, in its investor relations conferences it provides information here and there of cost savings achieved, etc. This can be interpreted as derived from learning curve effects, and would permit to build a model, even if based on scarce information.

Let me quote again one of those excerpts from Boeing executives:

“We continue to see progress in key operational performance indicators and unit costs, as we further implement production efficiencies and stabilize the overall production system on the 787 program. Unit cost has improved approximately 20% over the past year on the 787-8 […]“Greg Smith, Boeing EVP – CFO at Q4 2013 Earnings Conference.

To the avid reader, and knowledgeable and savvy analyst, this paragraph is enough to deduce the actual learning curve achieved by the 787 during 2013, provided that information reported by Boeing CFO, Greg Smith, was accurate.
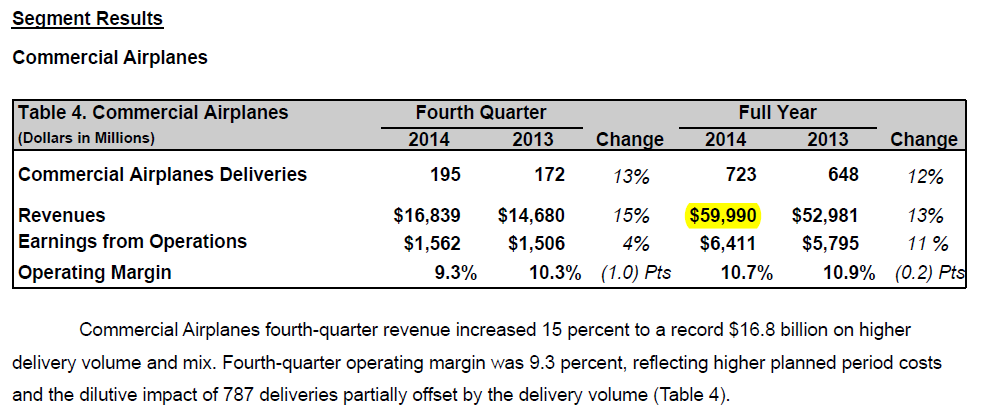
During 2013 Boeing delivered 65  787s, from the 50th to the 114th units (in previous years it had delivered already 3 in 2011 and 46 in 2012).

Thus, the exercise to find out what learning curve Boeing achieved in 2013 is as simple as to see what learning curve yields an “approximately 20% unit cost improvement” from the unit 50th to the unit 114th. The beauty is that we do not even need to know the initial unit cost to perform the calculation, as the relative improvements in terms of percentages are independent of the starting point. All the information has indeed been provided by Boeing.

In the first graph below I just plotted some generic learning curves, from 95% to 75%. This form of representation provides a good view of how learning is intense at the beginning of the production process and it stabilizes later on. It also shows well how learning is more intense and cost reductions are bigger for a 75% curve than for a 95% curve.

Generic learning curves.

Generic learning curves.

However, in the previous curve it is difficult to distinguish the 50th and the 114th units which are needed for the calculation. Thus, I plotted the same curves in with a log scale for the numbers of units produced in the graphic below:

Boeing 787 learning curve in 2013 calculation, delta unit cost between 50th & 114th units.

Boeing 787 learning curve in 2013 calculation, delta unit cost between 50th & 114th units.

In this second graphic I added the information of what relative cost reduction is achieved between the 50th and the 114th units for each of the curves (1).

To make sure that readers are not lost, let’s take the 85% curve. Following that curve, the unit cost of the 50th unit produced is a 40.2% of the 1st unit cost, whereas the unit cost for the 114th unit produced is a 32.9% of the 1st unit cost. The difference is then 40.2% – 32.9% = 7.2%, which represents a 18.0% cost reduction from the 50th unit cost. If you follow the same calculation for each of the curves, you will obtain the following unit cost improvements between 50th and 114th units:

  • 95% curve: -6.1% unit cost improvement
  • 90% curve: -12.0% unit cost improvement
  • 85% curve: -18.0% unit cost improvement
  • 80% curve: -23.8% unit cost improvement
  • 75% curve: -29.6% unit cost improvement

Thus, from the information provided by Boeing of units delivered and unit cost improvement (“approximately 20”, Greg Smith) we can deduce that during 2013 the learning curve that the 787 program has achieved is between 85% and 80%. Thus, in line with aerospace average indicated by NASA (85%), or in line with the reported 84% achieved in the 777.

If we wanted to know what learning curve yields exactly that 20% unit cost improvement, it is now trivial to calculate it: the 83.3% learning curve.

Having made these numbers, and taking into account the words used by Boeing CFO, “unit cost has improved approximately 20% over the past year on the 787-8″, I take it as that the improvement has been close to 20% though probably not reaching it; thus, I understand that the learning curve was rather between 83.3-85% instead of down to 83.3%.

(1) Bear in mind what a relative cost reduction is in contrast to the fact of relative costs represented in the vertical axis as percentages of the initial cost (100%).

2 Comments

Filed under Aerospace & Defence